

Abstract
Cells have the ability to measure and respond to extracellular signals like chemical molecules and topographical surface features by changing their orientation. Here, we examined the orientation of cultured human melanocytes exposed to grooved topographies. To predict the cells' orientation response, we describe the cell behavior with an automatic controller model. The predicted dependence of the cell response to height and spatial frequency of the grooves is obtained by considering the symmetry of the system (cell + substrate). One basic result is that the automatic controller responds to the square of the product of groove height and spatial frequency or to the aspect ratio for symmetric grooves. This theoretical prediction was verified by the experiments, in which melanocytes were exposed to microfabricated poly(dimethylsiloxane) substrates having parallel rectangular grooves of heights (h) between 25 and 200 nm and spatial frequencies (L) between 100 and 500 mm−1. In addition, the model of the cellular automatic controller is extended to include the case of different guiding signals acting simultaneously.
INTRODUCTION
It is well known that cultured mammalian cells respond to topographical cues in their environment. The physical topography of a substrate to which the cells attach is known to affect cell morphology and orientation (1–4). Possible mechanisms are the alignment of cytoskeleton elements and focal contacts (5–7), and the probing of the topography by filopodia (8). Topographies with grooves of heights and widths in the micrometer range but even with heights in the range 50–80 nm can induce a cellular orientation response (9–12). However, it is poorly understood how height and groove width or in which quantitative interaction these two signals determine the degree of cell orientation in a dose-response fashion (in analogy to pharmacology, we describe the cell response characteristics to various strengths of the signal as dose-response characteristics).
Here, a quantitative analysis of the orientation response of cultured human melanocytes was performed using systematically varied nanomicrostructured poly(dimethylsiloxane) (PDMS) substrates with parallel rectangular grooves with heights between 25 and 200 nm and spatial frequencies between 100 and 500 mm−1 (Fig. 1 A). To understand quantitatively the dose-response characteristics of the orientation of a cell to these topographical signals, there are two levels of approach:
On the molecular level, the final aim is the characterization of the interaction of all the relevant molecules in a corresponding signal network. Such an approach requires the characterization of all involved molecular steps and the corresponding rate coefficients and is a challenge to the experimentalists as well as to people doing simulations (13,14).
In a system analysis similar to engineering control principles one tries to characterize the dose-dependent response of the complete cell to a signal. The cellular orientation response can be predicted by a model if an appropriate information flux diagram exists.
FIGURE 1.

(A) Schematic cross section of the PDMS substrate characterized by grooves with the height h, the notch width d1, and the groove width d2 leading to an spatial frequency L = 2/(d1 + d2). (B) Electron microscopic picture of a human melanocyte on PDMS substrate having parallel grooves (d1 = 8 μm, d2 = 2 μm, h = 100 nm). (C) Cross section of an atomic force microscopic image of a substrate with d1 = d2 = 2 μm, h = 200 nm.
We follow the second approach and assume that the orientation response is controlled by a kind of automatic controller; that the properties of this controller can be mathematically modeled and then experimentally verified by an input-output analysis; and that this approach provides some insight into the nature of the response mechanism without knowing the molecular steps involved. This concept was successfully applied to describe orientation and movement of cells in guiding fields such as electrical fields or on bent surfaces (15–18). In general, such an approach can be useful to deduce the presence and type of control features, such as feedback mechanisms, in biological systems (19). In our work, the cells respond to this input signal by orienting their long axis to be parallel to the grooves. We demonstrate that the experimental results can be predicted by a model using the information flux diagram of a controller and considering the symmetries of the cell-substrate system. It yields the response characteristics to these signals, as well as the type of controller. Our general approach is then applied to different cell types and guiding signals. The verification of model assumptions such as the information flux diagram with certain symmetry properties lets us propose the existence of certain functional cellular states including their response characteristics.
MATERIALS AND METHODS
Surface preparation
The nanomicrostructured substrates were made as described in Jungbauer et al. (10). Briefly, master substrates (silicon-100 wafers) were structured by a photolithographic technique resulting in rectangular parallel grooves of different heights (0–200 nm, 25-nm steps), of notch widths d1 (2, 4, 5, 8, and 10 μm), and groove widths d2 (2, 4, 5, 8, and 10 μm) (Fig. 1 A). Such master substrates were used as a mold for the pattern transfer to poly(dimethylsiloxane) (PDMS) substrates (20). These substrates were treated with oxygen plasma (50 W) for 5 s to increase cell adhesion and then used in the experiments. The surface topography of the PDMS substrates was verified by atomic force microscopy (Fig. 1 B) and raster electron microscopy (Fig. 1 C).
Melanocyte cell culture and light microscope observation
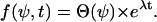
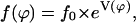
The orientation experiments were performed with cultured human melanocytes of healthy donors as described (21,22). This cell type was chosen because of its distinct elongated shape, which facilitates the measurement of orientation. Fifty cells/mm2 were seeded on the PDMS substrates. After two days, 20 micrographs were taken randomly and were digitized (450–600 cells per culture) by a Zeiss Axiovert 135 microscope equipped with Hamamatsu CCD camera (C5405). Based on NIH-IMAGE (http://rsb.info.nih.gov/nih-image/), the angles ψ of the bipolar cells with respect to the direction of the grooves were measured (Fig. 2 A), and collected in a normalized histogram f(ψ) = N(ψ)/N0. The value N0 is the total number of cells and N(ψ) the number of cells oriented between ψ and Δψ.
FIGURE 2.

(A) Sketch of cell orientation in respect to the orientation of grooves measured as angle ψ. Light microscopic pictures of human melanocytes: (B) on flat surface without guiding signal; (C) exposed to parallel grooves (h = 200 nm, L = 500 mm−1); and (D) exposed to electric field (0.6 V/mm, t = 24 h, field direction E, left to right).
Electric field experiments
Electric field experiments were performed with a galvanotactic chamber as described (15). The cells are cultured and allowed to orient on a flat substrate for one day. Subsequently, an electric direct current (DC) field was applied by salt bridges (length 15 cm, cross section 0.7 cm2, filled with phosphate-buffered solution with 2% agar). Images were taken at different time intervals (total 36 h) and cell orientation was measured as described above.
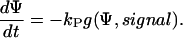
Mathematical description of a controller
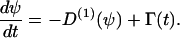
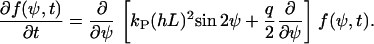
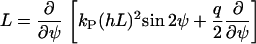
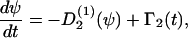
An information flux diagram of an automatic controller responsible for cell orientation is shown in Fig. 3. Its basic mathematical description in connection with the symmetry considerations was already described (15). The controlled variable is the angle of orientation of the cell, Ψ. The actual angle of orientation is measured and compared with the desired one, Ψ0, in the summation point. We turned our coordinate system to set Ψ0 = 0 for the parallel grooves as guiding signal. The angle- and field-dependence of the detection unit is described by the unknown function, g(Ψ, signal) and the strength of the reaction unit by the coefficient kP. The reaction of the cell can be quantified by the temporal change of the angle of orientation, dΨ/dt. This reaction minimizes the deviation angle Ψ. The predicted equation is
 |
(1) |
FIGURE 3.

Information flux diagram of an automatic controller.
The unknown function, g(Ψ, signal), is derived from the symmetry properties of the system as demonstrated in Kemkemer et al. (15) and Gruler and Nuccitelli (16) (see Appendix A for more details):
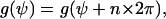
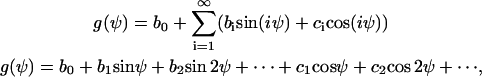
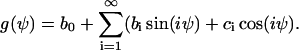
The controller variable Ψ is periodic with 2π (g(Ψ) = g(Ψ + 2π)) and, therefore, g(Ψ, signal) can be described by a Fourier series g(Ψ) = b1 sin Ψ + b2 sin 2Ψ + …. + c1 cos Ψ + c2 cos 2Ψ + ….
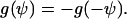
The assumed mirror symmetry g(Ψ) = g(−Ψ) yields ci = 0.
The assumed apolar symmetry (g(Ψ) = g(Ψ + π)) (the cells cannot register a sign of the guiding field) yields bi = 0 for all odd i. The first nontrivial term for g(Ψ) = b2 sin 2Ψ. That means the cells have a head-tail or apolar symmetry and cannot register a possible direction of a guiding signal (23).
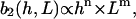
The strength of the cellular reaction depends on the height, h, and the spatial frequency, L, of the rectangular grooves. A power law is expected 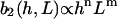 with n,m > 0, since a stronger cellular reaction is expected if the spatial frequency L or the height h is increased. The value m should be an even number due to the apolar symmetry of the substrate since one obtains the same physical state (b2(h, L) = b2(h,−L)) if the substrate is rotated in the x,y plane by π. The value n should be an even number if cell adherence is much stronger than gravitational forces. Then one practically obtains the same physical state (b2(h,L) = b2(−h,L)) if the substrate with the cells is turned upside down.
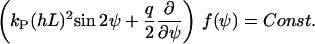
Furthermore, g(Ψ, signal) = 0 for a flat surface. No cellular response is predicted from Eq. 1, but cells change their orientation randomly over time. Thus, the cellular machinery is not only described by a deterministic signal, as shown above, but also by a stochastic signal, which is quantified by Γ(t). The final proposed equation is (24,25)
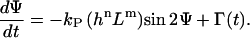 |
(2) |
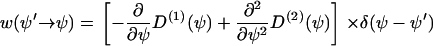
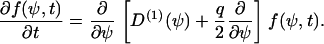
A white-noise source is assumed for the stochastic term. Its autocorrelation is 〈Γ(t) Γ(t′)〉 = qδ(t–t′), where q describes the strength of the stochastic signal and δ(t–t′) is Dirac's δ-function. Although, because of the stochastic properties in the cellular signal transduction chain, the orientation angle, Ψ, cannot be predicted, its statistical properties can. The probability for the orientation angle to be in the range between Ψ and Ψ + ΔΨ is described by the angular distribution density function, f(Ψ). The motion equation of f(Ψ) can be obtained from Eq. 2. The result is the Fokker-Planck equation (24):
 |
(3) |
The Fokker-Planck equation allows us to relate the model predictions to the experimental results.
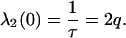
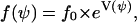
For steady state, ∂f(Ψ,h,L)/∂t = 0, a solution of Eq. 3 is the exponential function (see Appendix B):
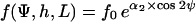 |
(4) |
with
 |
(5) |
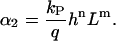
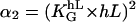
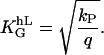
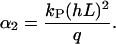
The value f0 is determined by the normalization (∫ f(Ψ) dΨ = 1). That predicted angle-distribution density is compared with the experimentally determined angle-distribution density. The coefficient, α2, describes, on the one hand, the signal-strength sensitivity of the cellular signal transformer; and on the other hand, it is a dimensionless quantity. Thus, a general guiding coefficient,  can be introduced that quantifies the cellular standard for measuring the topography of the grooves. One expects n,m = 2 if the first nontrivial term of the power law is considered alone:
 |
(6) |
with
 |
(7) |
The dimensionless quantity ( ) is the ratio of the deterministic part of the guiding signal and the stochastic part. If that term equals 1, the deterministic signal equals the stochastic signal and, thus, can be regarded as a cellular standard.
Apolar and polar order parameter
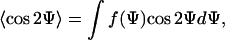
The dose-response curve is a dimensionless representation of the mean cell response if the signal applied to the cells is normalized by the appropriate guiding coefficient as demonstrated in Eq. 6. The mean cellular response is quantified by a dimensionless order parameter considering the appropriate symmetries. A grooved surface provides a bidirected (biaxial) signal to the cells. Considering a unit vector  parallel to the grooves, it means that
  and
and  are equivalent. The mean response of the cells can be quantified by an apolar order parameter,
 |
(8) |
where 〈cos 2Ψ〉 = 0 for a random orientation (no guiding signal) and 〈cos 2Ψ〉 = 1 for a parallel orientation. The apolar order parameter can be predicted by taking Eqs. 4 and 8, and is given by the ratio of two modified (hyperbolic) Bessel functions 〈cos 2Ψ〉 = I1(α2)/I0(α2) (26). A DC field provides a directed (axial) signal to the cells. If the unit vector  is parallel to the electric field,
  and
and  are not equivalent. A cell can react by directed migration to such a signal and the mean response can be quantified by a polar order parameter
 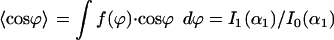 (16). Both order parameters are a fit-free representation.
RESULTS
Melanocytes respond to the physical topography by aligning their elongated axis parallel to the grooves (Fig. 1 and Fig. 2 C). The strength of the orientation response increases with increasing height of the grooves and spatial frequency. To determine the quantitative dependence of this response to height and spatial frequency, the orientation angle of the melanocytes was measured and characterized by normalized histograms. Our model of the controller (Fig. 3) results in a detailed prediction for the density distribution of the angle and the quantitative dependence to height and spatial frequency (Eqs. 4 and 5). The predictions of the model are verified by the experimental data as shown in the following section.
Evidence for the existence of an automatic controller in melanocytes
The existence of an automatic controller can be verified by experiments with time-dependent signals. If an automatic controller is present the system should automatically react to the time-dependent signal. Such experiments cannot easily be performed in a well-defined way with surface-structured substrates. Thus, we demonstrate the existence of a cellular automatic control mechanism in cultured melanocytes by performing experiments with electric DC fields as the guiding signal. Such a signal can be easily switched on and off. In case of an automatic control mechanism, the cell automatically follows the temporal variations of the guiding signal. Without an electric field, the cells show a random orientation pattern, giving an apolar order parameter, 〈cos 2ψ〉, of 0 (Fig. 2 B). When an electric DC guiding signal is switched on the cells align their long axis perpendicular to the direction of the applied electric field (Fig. 2 C). The apolar order parameter increases with a characteristic time of ∼12 h (E = 0.6 V/mm), until a saturation value is reached. When the guiding signal is then switched off, 〈cos 2ψ〉 decreases in time with a characteristic time τ0 of ∼20 h, until the cells are oriented randomly again. More details to the data about the time-dependent response of melanocytes to electric fields are presented in a further article.
Angular dependence and setpoint of the automatic controller
When using substrates containing parallel rectangular grooves as a guiding signal, the predicted density distributions of the model are compared with the normalized histograms. A typical example for such a histogram is shown in Fig. 4 (squares). The density function Eq. 4 (solid line in Fig. 4) fits the measured points. All histograms can be well fitted by the model density function, thus the angular dependence, g(Ψ), of the controller is well approximated by sin 2Ψ. In addition, the setpoint, ψ0, of the automatic controller is determined by the maximum of the histogram N(ψ), which is at 0° (in Fig. 4: cos 0° = 1).
FIGURE 4.

Logarithm of the angle-distribution density, log f(Ψ), versus cos 2Ψ for melanocytes guided by parallel grooves in a substrate with groove width d1 = d2 = 2 μm (spatial frequency L = 500 mm−1 and h = 100 nm). The squares represent experimentally determined histogram values. A predicted straight line (Eq. 4) is fitted to the data where α2 = 1.5 is the only fitting parameter.
Signal dependence of the automated controller to height and spatial frequency
To quantify the sensitivity of the automatic controller to height and spatial frequency we have to determine the parameter, α2, (Eq. 4), for different heights and spatial frequencies by comparing the theoretical density function with the experimentally derived histograms. The sensitivity to the height is examined by varying the height, h, between 0 and 200 nm while the spatial frequency, L, is kept constant with d1 = d2. Two typical results are shown in Fig. 5. The response shows saturation behavior at heights larger than 175 nm (L = 500 mm−1). At the spatial frequency of 100 mm−1, the smallest density used, the response is very weak. The sensitivity to the spatial frequency is examined by varying L between 0 and 500 mm−1 while the height, h, is kept constant. How α2 depends quantitatively on the groove height (α2 = α2(h) at fixed L) and on spatial frequency (α2 = α2(L) at fixed h) is predicted by Eq. 5. The assumed symmetries can only be satisfied by a power law with arguments restricted to even numbers. As demonstrated in Fig. 5, the experimentally derived data for α2(h) can be approximated up to a height of 150 nm with a parabolic line (α2(h) = (KL × h)2). One finds KL = 0.0108 nm−1 for L = 500 mm−1. A similar result was obtained for (α2(L) = (Kh × L)2). One finds Kh = 0.005 mm for h = 200 nm. As predicted, this means that α2 is proportional to h2 and L2. The general guiding coefficient,  of Eq. 6 is 24 ± 1. In conclusion, the cellular response is proportional to the square of the aspect ratio of the notch, (h/d)2 if d = d1 = d2. The measured orientation response exhibits saturation behavior with respect to the height. Surprisingly, this occurs already at a height of 150 nm for L = 500 mm−1.
FIGURE 5.

Height sensitivity: The slope α2 is plotted versus the height, h. The quadratic function (Eq. 6) is fitted to the data where KL (=  · L for L= constant) is the only fitting parameter. Data are shown for □, L= 100 mm−1 (d = d1 = d2 = 10 μm, KL = 0.0035 nm−1); and for •, L = 500 mm−1 (d = d1 = d2 = 2 μm, KL = 0.0108 nm−1).
In the next step, asymmetric profiles with d1 ≠ d2 were investigated. In the case of constant spatial frequency, we obtain the same cellular response: e.g., L = 154 mm−1: α2 = 0.71 (d1 = 8 μm, d2 = 5 μm) and α2 = 0.77 (d1 = 5 μm, d2 = 8 μm). By a constant width of the notch (d1) and different width of the grooves (d2) we obtain different cellular responses, as expected: e.g., α2 = 0.71 for d1 = 5 μm, d2 = 5 μm, and α2 = 0.33 for d1 = 5 μm, d2 = 10 μm. These experiments prove that only the spatial frequency is important for the cellular response.
To sum up: The orientation response of the melanocytes to parallel grooves is now predictable. If h, L, and the general guiding coefficient  are known, the density distribution f(Ψ, h, L) can be calculated (Eqs. 4 and 6).
Universal dose-response curves: polar and apolar order parameter
The apolar order parameter (Eq. 8) is a physiologically important parameter to quantify the cellular orientation response. The applied guiding signal is the dose that can be given in dimensionless units, which can be interpreted to be in natural units of the cell. In the case of the grooves, the dose is ( ), or in the case of an electric field, it is (
 ). The measured steady-state apolar order parameter for the melanocytes on grooves and in electric DC fields is given in Fig. 6 A represented by the squares, and the sigmoid solid line is the theoretical prediction. Again, there is good agreement. The sigmoid dose-response curve results from the fact that the response to the input signal of the automatic controller has a quadratic characteristic.
FIGURE 6.

Universal dose-response curve for an automatic proportional controller with apolar symmetries: (A) in melanocytes and (B) other cells (listed below). The sigmoid character is caused by the quadratic signal dependence of the cellular response. (Solid line, theoretical prediction as given by Eqs. 4, 6, and 8.) (A) Dots are experimental results of human melanocytes oriented by grooves (□,  ) and electric fields (▪,
  = 1.4 mmV−1). (B) Dots represent the orientation behavior of other cell types in different guiding fields published before: Chicken fibroblasts (□,
  = 3.1 mmV−1 (27)), human fibroblasts (▪,
  = 2.8 mmV−1 (15)), and gingival fibroblasts (▵,
  = 2.3 mmV−1 (41)) oriented in an electric DC field with α2 = (
 · E)2. Human osteoblasts and fibroblasts (•,
  = 85 mm (15)) oriented by bent surfaces with α2 =
  (curvature C). Bi-directional growth of mycelial fungus Neurospora crassa (○,
  = 0.4 mmV−1, (28,35) in an electric DC-field with α2 = (
 · E)2.
The universal character of our model approach is demonstrated by investigations of published data on the orientation response of additional cell types exposed to different guiding signals. As shown in Fig. 6 B, our model approach describes all the different orientation responses. This approach is also valid for the apolar growth of the hyphae Neurospora crassa. All data for orientation responses can be described by one theoretical curve, which is only based on the apolar symmetry conditions and the information flux diagram of the controller.
One may ask what happens if the symmetry conditions for the cellular automatic controller is altered, for example from apolar to polar. Then the first nontrivial term (b1 sin φ) of the Fourier series characterizes the angular dependence. Therefore, the directed cellular response is now characterized by the polar order parameter 〈cos φ〉. One can now follow the same procedure for data analysis, as shown for the apolar symmetry but, in contrast, one obtains a linear dependence on the signal. For example, one gets for galvanotaxis α1 = (KGT × E)1, (16,17) and for chemotaxis α1 = (KCT × grad ln c)1 (18).Various published data to such directed processes are presented in Fig. 7. The line represents the prediction of our model approach and describes all the different directed responses of different cell types and guiding signals. All these data can be described by one theoretical curve, which is only based on the polar symmetry conditions and the information flux diagram of the controller. It is noteworthy that fibroblasts as well as hyphae can respond in both ways, with polar and apolar processes, to electric fields (27,28).
FIGURE 7.

Polar universal dose-response curve for an automatic proportional controller. The hyperbolic character is caused by the linear signal dependence of the cellular response. Experimental results are taken from the given references. Solid line, theoretical prediction (17); human granulocytes, □, KGT = 4.75 mmV−1, anode (42,16); somitic chicken fibroblasts, •, KGT = 3.3 mmV−1, cathode (27); neural crest cells, quail, ○, KGT = 6.7 mmV−1 (43); and keratinocytes, °, KGT = 40 mmV−1 (16) in an electric field with α1 = (KGT · E), human granulocytes, ▵, in a concentration gradient (grad ln c) of the tripeptide f-Met-Met-Met with α1 = (KCT · grad ln c) ( and
and  = 9 mm, KR = 6.6 μM (44)). Directed growth of fungal hyphae Neurospora crassa, ◊, KGT = 0.5 mmV−1 (28,35), and of fucus, ▸, KGT = 0.5 mmV−1, in an electric field with α1= (KGT · E) and directed growth of fucus in a potassium gradient, ◂, KCT = 0.03 mm, (45) with α1 = (KCT · grad ln c).
DISCUSSION
Existence of an automatic cellular control mechanism
Feedback and control processes are essential in modern technology as well as in biological systems (19,29). In fact, the theory of automatic control is widely applied in physiology and neurophysiology. Here we apply this concept to the orientation behavior of single cultured cells. The electric field experiments demonstrate the existence of a cellular automatic control mechanism. The melanocytes follow automatically the temporal variations of the electric field. The mathematical description of the dynamic behavior of the controller (Eq. 2) is verified.
Characteristics of the automatic controller for the orientation response: angular dependence and proportional controller
The angular characteristic, g(ψ) for the orientation response to parallel grooves is predicted by using symmetry properties of the system. The agreement with the experimental results implies that 1), the automatic controller of the cell senses a director and not a vector field; and 2), a rotation of the cellular controller of 180° does not change the orientation response. The same characteristic is known for the orientation response of other cell types like fibroblasts or osteoblasts (15,27). The cell's automatic controller acts basically as a proportional controller, since for small angles one has sin 2ψ ≈ 2ψ (apolar symmetry) or sin φ ≈ φ (polar symmetry). Thus, the cell reacts strongly if the deviation between actual and desired angle is large and the cell reacts weakly if this deviation is small. We suggest that nature chooses a proportional controller when a biological task requires not only low accuracy but high security since no instability can occur.
Setpoint and noise of the automatic controller
For a technical automatic controller the setpoint is the crucial manipulated value, which is usually variable. For the cellular automatic controller the setpoint is determined by the guiding signal, in our case the direction of the parallel grooves, and the cell can usually not alter the setpoint. If that guiding signal is strong, the automatic controller finds exactly the signal direction that represents the setpoint. However, noise is an unavoidable component of real-world systems. It originates from external factors and intrinsic properties of the units comprising the system or the way in which they communicate. Obviously, the accuracy of the controller to adjust to the setpoint depends on a signal/noise ratio. Such a ratio can be obtained (Eq. 3) by the deterministic signal kP(hL)2 and the stochastic signal q. The strength of q is connected to the characteristic time τ0 = (2q)−1 (see (15) and Appendix B).
One might surmise that noise increases the difficulty in completing the tasks of the automated controller. In fact, in the technical world, engineers try to avoid noise in the signal transduction. But under certain conditions, noise drives a system toward optimal adaptive function (30). Examples in biology are the search mode of the white blood cells of the immune system (18) and neural navigation of growth cones (31,32).
Signal dependence to the product of height and line density
The signal strength characteristics, g(signal), predicted by the symmetry properties of the system, is the square of the cellular input signals: (hL)2, a strong indication that the symmetries are fulfilled. The measured general guiding coefficient  is 24 for melanocytes and 12 for fibroblasts (33). Both cell types have a comparable cell size but the coefficient differs significantly. That might indicate that a cell-type-specific internal structure is responsible for the sensitivity. Dunn and Heath (34) propose a model where internal elongated stiff structures determine the cellular response. Our model does not include the subcellular organization of filaments, and, thus, cannot make a prediction about such structures. However, our finding of the quadratic response indicates a strong feedback mechanism, which should be apparent in the subcellular organization of filaments if their hypothesis is true. Such a feedback mechanism is not recognizable for us in the model of Dunn and Heath (34).
One can demonstrate the response to small topographies with the following example. Parallel adjacently aligned cylinders with radius r, the height of the grooves, can be approximated by r, and the groove density by r−1. A very strong response is expected (〈cos 2ψ〉 ≈ 1) since  24 for melanocytes. This indicates that not only the chemical cue of aligned fibers, such as collagens, but their physical topography as well, can be a strong signal for inducing an orientation response from the cell.
In this study, the square dependence of the signal was verified for human melanocytes exposed to grooves and other cells exposed to other guiding signals (33) (Fig. 6). All of them seem to follow the same symmetry conditions.
Sigmoid or hyperbolic dose-response characteristics
The steady-state dose-response curve is of great physiological importance since it describes the mean orientation as a function of the applied guiding signal in natural units. As mentioned, the sigmoid characteristic in Fig. 6 is based on the quadratic signal dependence. The dose-response curve for directed processes is not of sigmoid but of hyperbolic character, due to the linear signal dependence (Fig. 7). Cell responses with quadratic and linear signal dependence can occur in the same cell simultaneously. For example, fibroblasts can simultaneously respond to electric fields by bipolar orientation and directed migration (27). Similar observation were made for directed and bidirectional growth in electric fields (28,35). For small doses (<1), the polar response prevails, whereas for large doses (>1), the apolar response prevails.
General predictions of the model
As demonstrated, the model can predict the response of different cell types to various guiding signals. One might ask how a cell responds if exposed to two guiding signals simultaneously. Our model can be generalized to two or more guiding signals, as demonstrated in Appendix C, by superimposing the deterministic parts of the two single signals. This means that the cellular standard signals are superimposed. For the example of a bidirectional response, the model predicts a random orientation if the preferred orientation to each guiding signal is perpendicular and the cellular standard guiding fields are equal. In the case of electric field and grooves as guiding signals, that prediction is verified by the experimental results of Gibson and McCaig (33).
We point out that our model is limited to grooves for which the characteristic length of the cell is large compared to the period of the grooves. If the groove width is much larger than the characteristic cell length, the cellular response will depend on the position of the cell. For example, the cell density and orientation could be large if the cell is close to the groove and the orientation is random if the cell is exposed to the flat part of the substrate. From our observation of cells located at the boundary between the grooved and flat part of the substrate, we estimate the persistence length of the orientation to be in the order of one cell length. If one wants to predict the dynamic behavior of this process, i.e., how long it takes until the orientation of a cell is random after it leaves a grooved field, the model has to be extended in order to include not only the rotation of the cell but also the translation.
Our experiments were performed with low cell densities to obtain data of single cell behavior. One might ask how the cellular response changes if the cell density is high and, therefore, cells may interact with each other. On flat surfaces, elongated cells such as melanocytes or fibroblasts are randomly orientated at low cell density. But at high cell density a strong interaction is expected and the elongated cells are anisotropically aligned. This indicates that the interacting elongated cells generate a guiding signal, which can be approximated by a mean field (Appendix C). Such a self-induced mean field was experimentally verified for melanocytes (36–38). In case of fibroblasts, the self-induced mean field is slightly modified since their cell shape depends also on the strength of the self-induced mean field in addition to the cell density (R. Kemkemer, M. Stökl, and H. Gruler, unpublished data). Again, these two signals (grooves + self-induced mean field) can be superimposed (Appendix C). The model predicts an increased response of melanocytes or fibroblasts to grooves if they interact with each other. In case of melanocytes, the cell hardly changes its morphology if a bidirected guiding signal is applied. Other cell types such as epithelia cells have no significantly elongated cell morphology if cultured on a flat surface. However, if cultured on grooves in low cell density, they elongate and align along the groove direction (40). If the epithelia cells interact with each other, their cell morphology gets even more elongated and the cells align more along the grooves (40). To describe such a phenomenon one must develop a self-consistent cell-cell interacting signal (R. Kemkemer, M. Stökl, and H. Gruler, unpublished data) similar to the mean-field in Appendix C.
In summary, our findings demonstrate a quantitative description for the contact guidance of cultured cells. Our approach is very general since it is not limited to parallel grooves as signal. The occurrence of simple but general symmetries may serve as a paradigm for a general classification of cellular phenotype. In addition, such an objective description may be useful to define and elucidate cases of cellular dysfunction.
Acknowledgments
Thanks are due to Joachim Spatz for the cooperation, Richard Nuccitelli and Camilla Mohrdiek for corrections of the manuscript, and Heidrun Goetz and Anna Siegel for technical assistance.
We acknowledge the financial support of Deutsche Forschungsgemeinschaft grant No. 551/13-2.
APPENDIX A: SYMMETRY CONSIDERATIONS
We are interested in cell orientation, thus, the cellular automatic controller must have the ability to measure the topographical signals of the surface. The coordinate system is defined in the following way: the y axis is determined by the direction of the parallel lines. The cells orient in the x,y plane. The following symmetry properties are assumed.
Rotational symmetry
The physical state is unchanged if a cell is rotated in the x,y plane by 2π. The angular dependence of the cellular signal transformer is restricted by
 |
(A1) |
where n is an integer. Thus, the angular dependence of the signal transformer must be a cyclic function, which can be described by a fourier series
 |
(A2) |
with the guiding signal-dependent coefficients bi(signal) and ci(signal). The rotary symmetry is evident and does not need an experimental verification.
Mirror symmetry
It is assumed that the cellular automatic controller senses a director and not a vector field. Then the physical state is unchanged if +x is exchanged by −x or the angle +ψ is exchanged by −ψ, which means that the angular dependence of the signal transformer is restricted by
 |
(A3) |
The consequence of this restriction is that all the coefficients ci in Eq. A2 are zero. One has now
 |
(A4) |
The mirror symmetry has to be verified by experiments as
 |
Apolar symmetry
The physical state is unchanged if a cell is rotated in the x,y plane by π. The angular dependence of the cellular signal transformer is restricted by
 |
(A5) |
All coefficients bi in Eq. (A4) with odd i are zero. One has now
 |
(A6) |
if only the first nontrivial term of the series is considered. Additionally, the strength of the cellular reaction to different heights, h, and spatial frequencies, L, is described by coefficient b2(h, L). A power law is expected
 |
(A7) |
with n,m > 0 since a stronger cellular reaction is expected if the spatial frequency L or the height h is increased. The exponent m should be an even number due to the apolar symmetry of the substrate since one obtains the same physical state, 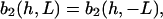 if the substrate is rotated in the x,y plane by π. The exponent n should be an even number if the cell adherence is much stronger than gravitational forces. Then one practically obtains the same physical state
 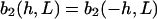 if the substrate with the cells is turned upside down. One expects n,m = 2 if the first nontrivial term of the power law is considered. This quadratic law has to be verified by the experiments.
APPENDIX B: FOKKER-PLANCK EQUATION
The behavior of our cellular system in respect to angular changes is described by a stochastic differential equation as
 |
(B1) |
The first term on the right side of this equation describes the deterministic angular changes and the second term the stochastic angular changes. Thus, the cellular orientation angle, ψ, will become a stochastic quantity, too. We therefore may ask for the probability to find the orientation of a cell in the interval (ψ, ψ + Δψ). Because ψ is a continuous variable we are looking for the probability density f(ψ). The probability density, f(ψ), times the length of the interval, Δψ, is then the probability of finding a cell oriented in the interval (ψ, ψ + Δψ). The probability density depends on time t and the initial distribution. The equation of motion for the probability f(ψ,t) is given by
 |
(B2) |
The first term on the right side of this equation arises from the deterministic cellular processes and is referred to as the drift term. The second term arises from the stochastic cellular processes and is referred to as the diffusion term. This probability density f(ψ,t) can be derived from a master equation,
 |
(B3) |
The first term on the right side describes the gain (or increase) of f(ψ) at the position ψ and the second term the loss (or decrease) of f(ψ) at the position ψ. The transition probability  has to be determined from the stochastic differential equation (Eq. B1). One finds (24)
 |
(B4) |
with Dirac's δ-function. If the stochastic cellular processes can be approximated by a white noise, then one obtains D(2) = q/2, where q describes the strength of the stochastic processes. From Eqs. B3 and B4 we obtain the final Fokker-Planck equation (24),
 |
(B5) |
In the case of grooves, we have
 |
(B6) |
In steady state, ∂f/∂t = 0, the Fokker-Planck equation simplifies to
 |
(B7) |
This differential equation is solved by
 |
(B8) |
where f0 is determined by the normalization (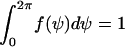 ). Eq. B8 can be fitted to experimental determined angle-distribution densities where the coefficient α2 is the only fitting parameter. The model prediction for this coefficient α2 is
 |
(B9) |
The partial-differential equation (Fokker-Planck equation) (Eq. B6) can be solved by a separation ansatz:
 |
(B10) |
It leads to the eigenvalue equation
 |
(B11) |
with the Fokker-Planck operator
 |
(B12) |
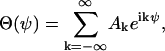
The unknown function Θ(ψ) can be expressed by a Fourier series
 |
(B13) |
where the unknown coefficients, Ak, are given by the starting conditions.
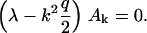
For vanishing guiding signal, (hL) = 0, the eigenvalue equation reduces to
 |
(B14) |
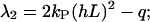
The eigenvalue, λ(0), for k = 2 is then
 |
(B15) |
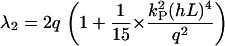
For nonvanishing guiding signals, the eigenvalue equation has to be solved numerically. But, one obtains for large guiding signals ((kP(hL)2 ≫ q/2),
 |
(B16) |
and for small guiding signals (kP(hL)2 ≪ q/2),
 |
(B17) |
APPENDIX C: SEVERAL GUIDING SIGNALS
An elongated cell exposed to a guiding signal can show different responses:
In the case of directed response, the cellular speed as well as the direction of migration, φ, can be influenced.
In the case of bidirected response, the orientation angle, ψ, of the elongated cell can be influenced.
Directed response
If the cells are exposed to one guiding signal that induces a change in the direction of migration, then the cellular processes are described by the rate equation
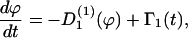 |
(C1) |
with the deterministic rate  (ϕ) and the stochastic rate Γ1(t) (noise strength,q1). We have, in the case of a concentration gradient,
 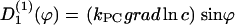 ; or in the case of an electric field,
 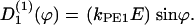 If two guiding signals are applied, one expects a superposition of the two deterministic signals:
 |
(C2) |
In the case of a concentration gradient, the cells migrate toward the φ1 direction, and in the case of the electric field, in the φ2 direction. The predicted angle distribution density would be (steady state)
 |
(C3) |
with the generating function
 |
(C4) |
and KCT = 2kPC/q1 and KGT = 2kPE1/q1.
Bidirected response
If the cells are exposed to one guiding signal that induces cell rotation, then the cellular processes are described by the rate equation
 |
(C5) |
with the deterministic rate  (ψ) and the stochastic rate Γ2(t) (noise strength q2). We have in the case of a grooved surface
 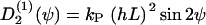 or in case of an electric field
 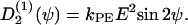 If two guiding signals are applied, one expects a superposition of the two deterministic signals:
 |
(C6) |
In the case of grooves, the cells orient their long axis in the ψ1 direction, and in the case of the electric field, in the ψ2 direction. The predicted angle distribution density would be (steady state)
 |
(C7) |
with the generating function
 |
(C8) |
and 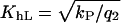 and
and 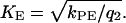 The predicted angle-dependence as well as the predicted addition of normalized guiding signals (Eq. C8) is verified for fibroblasts exposed to electric field and grooved surfaces (data from (33)). For single cues one gets KhL = 12 and KE = 0.025 mm/mV. For two cues like an electric field with 100 mV/mm and grooves with 2 μm width and 347-nm height one gets for α2 ∼−0.64 (experimentally) and −1.9 (prediction from single cue experiments).
Interacting cells
Single elongated cells exposed to a flat surface orient their long axis randomly. But interacting elongated cells exposed to a flat surface can form a uniaxial condensed state—that is, a nematic liquid-crystal-like state (36,37). In the mean field approach it is assumed that each elongated cell is subject to a mean guiding signal,  (ψ). It is expected to be proportional to the apolar order parameter, S2, of the cells in the environment and the cell density, ρ: A large guiding signal is expected for well-oriented cells (large S2) and a weak guiding signal for weakly oriented cells (small S2). In addition, a large guiding signal is expected for strong interacting cells (high cell density = small cell-cell distance) and a weak guiding signal for weakly interacting cells (low cell density = large cell-cell distance). The mean guiding signal is
 |
(C9) |
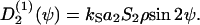
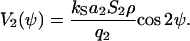
The coefficient, a2, quantifies the strength of the orientational cell-cell interacting and the coefficient kS quantifies the deterministic part of signal transduction chain. If one cell is exposed to the mean guiding signal then the cellular response is described by Eq. C5. The predicted angle distribution density is described by Eq. C7 with the generating function
 |
(C10) |
The self-consistency is used to calculate the stability of the nematic state: The apolar order parameter,  is calculated for a fixed guiding field strength, a2S2ρ, with Eq. C7. The problem is self-consistent if the calculated order parameter,
  equals the used order parameter, S2. The transition for the nematic state is
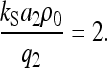 |
(C11) |
For ρ < ρ0 the cells are in a nonordered state with S2 = 0 and for ρ > ρ0 the cells are in an ordered nematic liquid-crystalline-like state with S2 > 0. The threshold cell density ρ0 (= 2q2/(kSa2)) is in case of human melanocytes 55 cells/mm2. The mean-field approximation in connection with the machine equation (Eq. 5) is experimentally verified for melanocytes (36–38).
The interaction coefficient, a2, quantifies the anisotropic cell-cell interaction. This coefficient is large for elongated cells and small for minor elongated cells. Melanocytes do not practically alter their shape if they come in contact with other cells and, therefore, the coefficient a2 can be regarded as constant, independent of cell density. But other cells like fibroblasts do, thus, the coefficient a2 depends on the self-induced mean field. If this effect is introduced, then the nematic order-disorder state transition becomes first-order (39), whereas melanocytes have a second-order state transition. If we consider two guiding signals like parallel grooves and a self-organized mean field, we expect 
References
- 1.Curtis, A. S. G., and C. D. W. Wilkinson. 1998. Reactions of cells to topography. J. Biomater. Sci. 9:1313–1329. [DOI] [PubMed] [Google Scholar]
- 2.Brunette, D. M., and B. Chehroudi. 1999. The effects of the surface topography of micromachined titanium substrata on cell behavior in vitro and in vivo. J. Biomech. Eng. 121:49–57. [DOI] [PubMed] [Google Scholar]
- 3.Andersson, A., P. Olsson, U. Lidberg, and D. Sutherland. 2003. The effects of continuous and discontinuous groove edges on cell shape and alignment. Exp. Cell Res. 288:177–188. [DOI] [PubMed] [Google Scholar]
- 4.Teixeira, A. I., G. A. Abrams, P. J. Bertics, C. J. Murphy, and P. F. Nealey. 2003. Epithelial contact guidance on well-defined micro- and nanostructured substrates. J. Cell Sci. 116:1881–1892. [DOI] [PMC free article] [PubMed] [Google Scholar]
- 5.Walboomers, X. F., L. A. Ginsel, and J. A. J. Jansen. 2000. Early spreading events of fibroblasts on microgrooved substrates. J. Biomed. Mater. Res. 51:529–534. [DOI] [PubMed] [Google Scholar]
- 6.Oakley, C., and D. M. Brunette. 1995. Topographic compensation: guidance and directed locomotion of fibroblasts on grooved micromachined substrata in the absence of microtubules. Cell Motil. Cytoskeleton. 31:45–58. [DOI] [PubMed] [Google Scholar]
- 7.Wojciak-Stothard, B., A. Curtis, W. Monaghan, K. MacDonald, and C. Wilkinson. 1996. Guidance and activation of murine macrophages by nanometric scale topography. Exp. Cell Res. 223:426–435. [DOI] [PubMed] [Google Scholar]
- 8.Dalby, M. J., M. O. Riehle, H. Johnstone, S. Affrossman, and A. S. G. Curtis. 2004. Investigating the limits of filopodial sensing: a brief report using SEM to image the interaction between 10 nm high nano-topography and fibroblast filopodia. Cell Biol. Int. 28:229–236. [DOI] [PubMed] [Google Scholar]
- 9.Dalby, M. J., M. O. Riehle, D. S. Sutherland, H. Agheli, and A. S. Curtis. 2004. Use of nanotopography to study mechanotransduction in fibroblasts—methods and perspectives. Eur. J. Cell Biol. 83:159–169. [DOI] [PubMed] [Google Scholar]
- 10.Jungbauer, S., R. Kemkemer, H. Gruler, D. Kaufmann, and J. P. Spatz. 2004. Cell shape normalization, dendrite orientation, and melanin production of normal and genetically altered (haplo-insufficient NF1)-melanocytes by microstructured substrate interactions. ChemPhys Chem. 5:85–92. [DOI] [PubMed] [Google Scholar]
- 11.Zhu, B., Q. Zhang, Q. Lu, Y. Xu, J. Yin, J. Hu, and Z. Wang. 2004. Nanotopographical guidance of C6 glioma cell alignment and oriented growth. Biomaterials. 25:4215–4223. [DOI] [PubMed] [Google Scholar]
- 12.Curtis, A., and C. Wilkinson. 2001. Nanotechniques and approaches in biotechnology. Trends Biotechnol. 19:97–101. [DOI] [PubMed] [Google Scholar]
- 13.Endy, D., and R. Brent. 2001. Modelling cellular behaviour. Nature. 409:391–395. [DOI] [PubMed] [Google Scholar]
- 14.Kitano, H. 2002. Systems biology: a brief overview. Science. 295:1662–1664. [DOI] [PubMed] [Google Scholar]
- 15.Kemkemer, R., C. Neidlinger-Wilke, L. Claes, and H. Gruler. 1999. Cell orientation induced by extracellular signals. Cell Biochem. Biophys. 30:167–192. [DOI] [PubMed] [Google Scholar]
- 16.Gruler, H., and R. Nuccitelli. 2000. The galvanotaxis response mechanism of keratinocytes can be modeled as a proportional controller. Cell Biochem. Biophys. 33:33–51. [DOI] [PubMed] [Google Scholar]
- 17.Schienbein, M., K. Franke, and H. Gruler. 1994. Random walk and directed movement: comparison between inert particles and self-organized molecular machines. Phys. Rev. E. 49:5462–5471. [DOI] [PubMed] [Google Scholar]
- 18.Gruler, H. 1995. New insights into directed cell migration: characteristics and mechanisms. Nouv. Rev. Fr. Hematol. 37:255–265. [PubMed] [Google Scholar]
- 19.Tomlin, C. J., and J. D. Axelrod. 2005. Understanding biology by reverse engineering the control. Proc. Natl. Acad. Sci. USA. 102:4219–4220. [DOI] [PMC free article] [PubMed] [Google Scholar]
- 20.Whitesides, G. M., E. Ostuni, S. Takayama, X. Jiang, and D. E. Ingber. 2001. Soft lithography in biology and biochemistry. Annu. Rev. Biomed. Eng. 3:335–373. [DOI] [PubMed] [Google Scholar]
- 21.Griesser, J., D. Kaufmann, I. Eisenbarth, C. Bauerle, and W. Krone. 1995. Ras-GTP regulation is not altered in cultured melanocytes with reduced levels of neurofibromin derived from patients with neurofibromatosis 1 (NF1). Biol. Chem. Hoppe Seyler. 376:91–101. [DOI] [PubMed] [Google Scholar]
- 22.Kemkemer, R., S. Schrank, W. Vogel, H. Gruler, and D. Kaufmann. 2002. Increased noise as an effect of haplo-insufficiency of the tumor-suppressor gene neurofibromatosis type 1 in vitro. Proc. Natl. Acad. Sci. USA. 99:13773–13778. [DOI] [PMC free article] [PubMed] [Google Scholar]
- 23.Ramaswamy, S., R. Aditit Simha, and J. Toner. 2003. Active nematics on a substrate: giant number fluctuations and long-time tails. Europhys. Lett. 62:196–202. [Google Scholar]
- 24.Risken, H. 1984. The Fokker-Planck Equation. Springer, Heidelberg, Germany. 1–110.
- 25.Haken, H. 1983. Synergetics: Nonequilibrium Phase Transitions and Self-Organization in Physics, Chemistry and Biology. Springer, Heidelberg, Germany. 191–227.
- 26.Abramowitz, M., and I. A. Stegun (editors). 1972. Modified Bessel functions I and K. In Handbook of Mathematical Functions with Formulas, Graphs, and Mathematical Tables, 9th Ed. Dover, Mineola, NY. 374–377.
- 27.Erickson, C. A., and R. Nuccitelli. 1984. Embryonic fibroblast motility and orientation can be influenced by physiological electric fields. J. Cell Biol. 98:296–307. [DOI] [PMC free article] [PubMed] [Google Scholar]
- 28.Gruler, H., and N. A. R. Gow. 1990. Directed growth of fungal hyphae in an electric field—a biophysical analysis. Z. Naturforsch. [C]. 45c:306–313. [Google Scholar]
- 29.Wiener, N. 1961. Cybernetics: Or Control and Communication in the Animal and the Machine. MIT Press, Cambridge, MA.
- 30.Shinbrot, T., and F. J. Muzzio. 2001. Noise to order. Nature. 410:251–258. [DOI] [PubMed] [Google Scholar]
- 31.Poo, M., and H. Song. 2001. The cell biology of neuronal navigation. Nat. Cell Biol. 3:E81–E88. [DOI] [PubMed] [Google Scholar]
- 32.Maskery, S. M., H. M. Buettner, and T. Shinbrot. 2004. Growth cone pathfinding: a competition between deterministic and stochastic events. BMC Neurosci. 8:22–31. [DOI] [PMC free article] [PubMed] [Google Scholar]
- 33.Gibson, I. R., and C. D. McCaig. 2005. Competitive guidance cues affect fibroblast cell alignment: electric fields vs. contact guidance. Mater. Res. Soc. Symp. Proc. 845:AA1.8.1–AA1.8.6. [Google Scholar]
- 34.Dunn, G. A., and J. P. Heath. 1976. A new hypothesis of contact guidance in tissue cells. Exp. Cell Res. 101:1–14. [DOI] [PubMed] [Google Scholar]
- 35.McGillivray, A. M., and N. A. R. Gow. 1986. Applied electrical fields polarize the growth of mycelial fungi. J. Gen. Microbiol. 132:2515–2525. [Google Scholar]
- 36.Gruler, H., U. Dewald, and M. Eberhardt. 1999. Nematic liquid crystals formed by living amoeboid cells. Eur. Phys. J. B11:187–192. [Google Scholar]
- 37.Gruler, H. 1998. Fluid self-organized machines. Liquid Crystals. 24:49–66. [Google Scholar]
- 38.Kemkemer, R., V. Teichgräber, S. Schrank-Kaufmann, D. Kaufmann, and H. Gruler. 2000. Nematic order-disorder state transition in a liquid crystal analogue formed by oriented and migrating amoeboid cells. Eur. Phys. J. E. 3:101–110. [Google Scholar]
- 39.Reference deleted in proof.
- 40.Oakley, C., and D. M. Brunette. 1995. Response of single, pairs, and clusters of epithelial cells to substratum topography. Biochem. Cell Biol. 73:473–489. [DOI] [PubMed] [Google Scholar]
- 41.Ross, S. M., J. M. Ferrier, and J. E. Aubin. 1989. Studies on the alignment of fibroblasts in uniform applied electrical fields. Bioelectromagnetics. 10:371–384. [DOI] [PubMed] [Google Scholar]
- 42.Rapp, B., A. de Boisfleury-Chevance, and H. Gruler. 1988. Galvanotaxis of human granulocytes. Dose-response curve. Eur. Biophys. J. 16:313–319. [DOI] [PubMed] [Google Scholar]
- 43.Gruler, H., and R. Nuccitelli. 1991. Neural crest cell galvanotaxis: new data and novel approach to the analysis of both galvanotaxis and chemotaxis. Cell Motil. Cytoskeleton. 19:121–133. [DOI] [PubMed] [Google Scholar]
- 44.Zigmond, S. H. 1977. Ability of polymorphonuclear leukocytes to orient in gradients of chemotactic factors. J. Cell Biol. 75:606–616. [DOI] [PMC free article] [PubMed] [Google Scholar]
- 45.Bentrup, F., T. Sandan, and L. F. Jaffe. 1967. Induction of polarity in fucus eggs by potassium ion gradients. Protoplasma. 64:254–266. [Google Scholar]