Abstract
Fluorescence detection of single molecules provides a means to investigate protein dynamics minus ambiguities introduced by ensemble averages of unsynchronized protein movement or of protein movement mimicking a local symmetry. For proteins in a biological assembly, taking advantage of the single molecule approach could require single protein isolation from within a high protein concentration milieu. Myosin cross-bridges in a muscle fiber are proteins attaining concentrations of ∼120 μM, implying single myosin detection volume for this biological assembly is ∼1 attoL (10−18 L) provided that just 2% of the cross-bridges are fluorescently labeled. With total internal reflection microscopy (TIRM) an exponentially decaying electromagnetic field established on the surface of a glass-substrate/aqueous-sample interface defines a subdiffraction limit penetration depth into the sample that, when combined with confocal microscopy, permits image formation from ∼3 attoL volumes. Demonstrated here is a variation of TIRM incorporating a nanometer scale metal film into the substrate/glass interface. Comparison of TIRM images from rhodamine-labeled cross-bridges in muscle fibers contacting simultaneously the bare glass and metal-coated interface show the metal film noticeably reduces both background fluorescence and the depth into the sample from which fluorescence is detected. High contrast metal film-enhanced TIRM images allow secondary label visualization in the muscle fibers, facilitating elucidation of Z-disk structure. Reduction of both background fluorescence and detection depth will enhance TIRM's usefulness for single molecule isolation within biological assemblies.
INTRODUCTION
Optical spectroscopic characterization of proteins in a biological assembly provides structural and dynamical information often accumulated as ensemble-averaged signals. Without synchronization of the protein dynamics, ensemble-averaged amplitude is lessened or lost from a signal that destructively self-interferes over the protein functional cycle. Additionally, proteins in their native biological assembly might be arranged with a local symmetry precluding detection of certain displacements. Myosin cross-bridges in muscle fibers probably exemplify both effects by their stochastic nature and ability to rotate undetectably about the fiber symmetry axis (1). Analysis of signal fluctuations from the ensemble average, or noise analysis, eliminates these idiosyncrasies because the noise signal is ultimately attributable to individual particles (2). Fluorescence correlation spectroscopy (FCS), the noise analysis technique for fluorescence signals originating from biological samples (3), has been used in a variety of applications (4–7). Alternatively, emerging techniques detect protein movement from single molecules (8,9). Compared to ensemble methods, the single molecule approach provides more insight into protein dynamics accompanying function (10,11).
In situ, single molecule detection requires the use of novel fluorescence excitation and detection schemes that isolate one or just a few molecules in a high concentration milieu. We previously have described an approach based on prismless total internal reflection microscopy or TIRM (12) that isolated ∼5 myosin cross-bridges in a muscle fiber (13). In TIRM, excitation light is incident from the glass side of a glass/water interface at angles greater than critical angle, θc, for TIR. Although light is totally reflected, an evanescent field created in the water medium and decaying exponentially with distance from the interface excites fluorophores within ∼100 nm of the surface (14). Focused (13,15,16) or unfocused (17) versions of prismless TIRM, combined with confocal microscopy, provide detection volumes of ∼3 or ∼7 attoL (10−18 L), respectively.
Axelrod et al. (18) described theoretically the effect on probe emission (19), and demonstrated practical experimental usefulness (20), of inserting a thin metal film at the glass/water interface in TIRM. The novel optical sensor, made up of glass/metal-film/aqueous-buffer multilayered media, utilizes the intervening nanometer-scale metal film to maintain selective optical coupling between detector and emitting fluorophore in the aqueous medium. They showed that the metal film affects both excitation and probe-emitted fields. The thin metal film reflects or absorbs incident light, permitting negligible transmission for all incidence angles except near to the surface plasmon angle, θsp, where transmission enhancement occurs due to the resonant excitation of electron oscillations (surface plasmons) propagating along the water/metal interface. As in TIRM at a bare glass interface, the surface plasmon resonance (SPR) field in the water medium is evanescent, decaying exponentially with distance from the interface. A fluorescent probe located near the interface is excited by the SPR evanescent field. The isolated probe dipolar emission field is the superposition of propagating transverse waves forming the far-field and nonpropagating (evanescent) waves forming the near-field. The near-field is not detected unless perturbed by the proximity of the interface (metallic or dielectric) such that the nonpropagating evanescent waves are converted to detectable propagating transverse waves. Converted near-field propagating waves appear in the glass medium beyond critical angle and are referred to as supercritical angle fluorescence or SAF (21). Oil immersion objectives with numerical aperture (NA) ≳1.3 are able to capture the SAF emission. Detectable SAF emission intensity decreases with the probe distance from the interface, thereby creating a second level of spatial selectivity (in addition to the exponential decay from the exciting field) for probes nearest to the interface. SAF occurs for both bare glass and metal-coated interfaces; however, all detectable emission on the glass side of the interface from the glass/metal-film/aqueous sensor is SAF. As pointed out by Axelrod et al. (18) the metal film also totally quenches fluorescence from probes within ∼10 nm of the interface, further narrowing the detection volume for probes near the interface (19).
We describe here the use of the thin metal film-enhanced TIRM. We find that the presence of the metal film reduces background fluorescence providing a larger signal/noise (S/N) ratio in all applications tested. We also find that the detection volume is visibly reduced. The combination of SPR excitation, SAF emission, and probe quenching near the metal film interface noticeably reduces the detection volume obtainable with metal film-enhanced TIRM compared to conventional TIRM. Background and detection volume reduction will enhance our ability to do in situ single molecule detection.
MATERIALS AND METHODS
Chemicals
Carboxylate-modified fluorescent microspheres and 5′-iodoacetamidotetramethylrhodamine (5′IATR) were purchased from Molecular Probes (Eugene, OR). ATP, dithiothreitol (DTT), Triton X100, and phenylmethanesulfonyl fluoride (PMSF) were purchased from Sigma Chemical (St. Louis, MO). All chemicals are ultrapure.
Solutions
Rigor solution contains 80 mM KCl, 5 mM MgCl2, 2 mM EGTA, 1 mM DTT, 0.2 mM PMSF, and 5 mM phosphate buffer. Relaxing solution is rigor solution plus 4 mM ATP. Glycerinating solution is relaxing solution with 50% glycerol (v/v). Skinning solution is relaxing solution containing 0.5% Triton X100. Labeling solution is relaxing solution without DTT. All solutions are pH 7.
Fluorescent spheres
Carboxylate-modified fluorescent spheres have 40- or 100-nm diameters and excitation/emission maxima at 565/580 or 540/560 nm according to the Molecular Probes catalog. Sphere fluorescence was observed with a rhodamine filter set. Sphere concentrations were computed using the formula in the catalog after dilution in rigor buffer. We used 103–104-fold dilutions from stock giving ∼(3–10) × 1010 spheres/mL. Sphere diffusion constants in water at room temperature are 1.1 × 10⁻⁷ or 4.4 × 10⁻⁸ cm2/s for the 40- or 100-nm spheres. Experiments were conducted at room temperature.
Metal-coated coverslip preparation and characterization
Clean No.1 glass coverslips were sonicated for 10 min in ethanol then plasma cleaned (Harrick Plasma, Ithaca, NY) for 15–30 min. Aluminum film deposition onto the top of a coverslip was accomplished by thermal vacuum evaporation at the Mayo Electron Microscope Facility (22). To enable comparison of fluorescence images from bare glass and metal-coated interfaces, film deposition was sometimes limited to half of the coverslip top surface by partially covering one coverslip with another. The result was an abrupt edge to the film as viewed in the light microscope. Aluminum film depth was measured with atomic force microscopy by scanning the tip over the edge in the partially aluminized coverslip. Aluminum film depth is 30–40 nm.
Sample chamber preparation
Metal-coated coverslips were placed with the metal side up on a 1- × 3-inch brass slide with a large hole cut out, permitting the objective from the inverted microscope to contact the coverslip through immersion oil. A water tight chamber was constructed on top of the metal-coated coverslip as described previously (13). The chamber contained either a muscle fiber or a suspension of nanospheres.
Muscle fiber preparation and modification with a fluorescent probe
Rabbit psoas muscle fibers were obtained as previously described (23) and kept in glycerinating solution at −15°C for up to several weeks. All fiber preparations were performed at 4°C. Muscle fibers were bathed in skinning solution (10 min) to remove the membrane and then placed in labeling solution containing 70 μM 5′IATR for 30 min. The labeling reaction is stopped with 1 mM DTT and excess dye exhaustively washed out with relaxing solution (2 h). Under these circumstances, we showed that ∼77% of the total probe intensity emitted from the 5′IATR label in modified fibers originates from the myosin heavy chain reactive thiol (SH1 or Cys-707) (24). The remaining probe intensity originates from actin (15%), α-actinin (5%), and myosin light chain 1 (3%). Myosin extracted from the labeled fibers had ∼0.32 probe/myosin headgroup (25). Microscope fluorescence measurements on muscle fibers were performed at 20°C.
Standard confocal microscopy
Images of muscle fibers were collected on an LSM 5 Live confocal laser scanning microscope (Carl Zeiss, Oberkochen, Germany). Individual images were collected at 512 × 512 pixels using a C-Apochromat 63×/1.20 NA water immersion objective lens on an Axiovert 200 M inverted microscope stand. Excitation was with a 532-nm diode laser. Emission was taken through a 650-nm long-pass filter with the charge-coupled device (CCD) camera of the LSM 5 Live confocal microscope. The pinhole was set to give a 1.3-μm optical slice.
Prismless TIRM
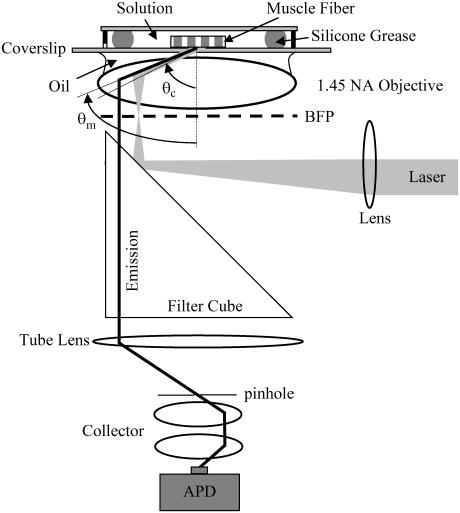
Fig. 1 shows the prismless TIRM instrument. Plane polarized light from an expanded argon ion laser beam impinges on a lens that focuses the excitation light at the back focal plane (BFP) of an NA = 1.45 60× oil immersion objective (Olympus, Melville, NY). Excitation light refracted by the objective propagates toward the coverslip at angles greater than critical angle, θc. A fluorescent-labeled muscle fiber in aqueous buffer solution makes contact with the coverslip and is illuminated by the evanescent field. Excited fluorescence, focused into a narrow cone by the metal film with maximal intensity at θm > θc and collected by the objective, is filtered and formed into an image by the tube lens at the confocal pinhole aperture. Collector lenses focus divergent fluorescent light, transmitting the pinhole onto the avalanche photodiode detector (APD, SPCM-AQ-161, PerkinElmer OptoElectronics, Freemont, CA). The APD outputs a transistor-transistor-logic compatible pulse for each detected photon. A counter/timer card (6602, National Instruments, Austin, TX) counts pulses over time bins ≥4 μs. Custom-written Labview software controls the counter/timer card and displays/processes data.
FIGURE 1.
Prismless TIRM. Excitation light from an expanded laser beam is focused by a lens on the BFP of the objective. Light is refracted at the objective into a parallel ray propagating toward the glass/coverslip interface. All refracted light is incident on the interface at angles beyond critical angle for TIR. The evanescent light at the interface excites fluorescence at the sample surface that is focused into a narrow cone by the metal film with maximal intensity at θm > θc and collected by the objective. Fluorescence transmits the filter cube and is focused by the tube lens on the pinhole. A collector focuses light transmitting the pinhole onto the active surface of the APD.
In some experiments a 16-bit CCD camera (Orbis 16, SpectraSource Instruments, Westlake Village, CA) replaces the pinhole, collector lens, and APD.
NUMERICAL RESULTS
TIR at a glass/water interface separated by a thin metal film
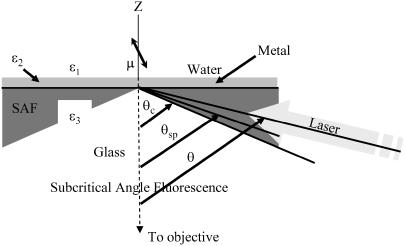
Excitation laser light propagates from the glass medium toward the interface at angles beyond critical angle as shown in Fig. 2. A metal film 30–40-nm thick interposed between the glass and water interfaces has complex dielectric constant, ɛ2. Incident light transmits the glass/metal interface, undergoes multiple reflections between the metal/water and glass/metal interfaces, and then emerges as a refracted ray in the water medium (18).
FIGURE 2.
The water/metal/glass multilayer used with TIRM. A dipolar probe (μ) is excited by the evanescent field in the water medium produced by the totally internally reflecting laser beam incident at angle θ. Fluorescence emission from dipole μ propagates in the glass medium in the super- and subcritical angle fluorescence regions and is collected by the objective. SAF originates from the dipole near-field, whereas subcritical angle fluorescence is from the dipole far-field emission. Critical angle θc is the incidence angle beyond which TIR occurs at a glass/water interface with dielectric constants ɛ3 and ɛ1. The SPR angle, θsp, is the incidence angle for peak transmission through the metal film with dielectric constant ɛ2.
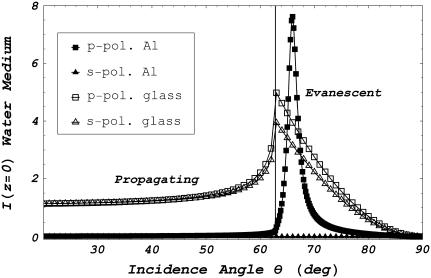
Fig. 3 shows I(z = 0), the field intensities in the water medium of the multilayered system, tabulated as a function of incidence angle θ. Results are expressed as intensities for s- or p-polarized incident electric fields (s- or p-polarization are perpendicular or parallel to the plane made by the incident and refracted wave vectors) for the multilayer water/aluminum/glass system (ɛ1 = 1.77, ɛ2 = −32.5 + i 8.4, ɛ3 = 2.25) and incident light wavelength of 514.5 nm. Intensities are separated in the figure into propagating or evanescent waves by θc ≈ 63°. Results for the simpler water/glass interface (ɛ1 = ɛ2 = 1.77 and ɛ3 = 2.25) are also depicted in the figure. Metal film insertion dramatically perturbs the field intensities in the water medium (18,26,27). The film reflects or absorbs s-polarized incident light, permitting negligible light transmission for all incidence angles. Similarly, the film reflects or absorbs p-polarized incident light, permitting negligible transmission for θ < θc. However, a dramatic enhancement of transmission occurs in a narrow peak for incidence angle θsp ≈ 66° just larger than θc. Angle θsp is the surface plasmon angle where transmission enhancement occurs due to the resonant excitation of electron oscillations (surface plasmons) propagating along the water/metal interface. This phenomenon occurs at interfaces where constituent materials have real dielectric constants with opposite signs. Evanescent field polarization for p-polarized incident light is elliptical but approximates linear polarization along the z axis and intensity decays exponentially with distance z from the interface (18,28). Both polarization and field depth depend on θ.
FIGURE 3.
Excitation light intensity on the water side of the metal/water (metal) or glass/water (glass) interface as a function of incidence angle θ for p-polarized or s-polarized incident light. Light incident at 0 ≤ θ < θc propagates into the water medium, whereas for θc ≤ θ < 90° an evanescent field is produced in the water medium. The vertical line marks the θ = θc point separating propagating and evanescent. For all incidence angles, the metal severely attenuates s-polarized incident light. Peak transmission for p-polarized light incident on the metal interface occurs at the surface plasmon angle θsp. Dielectric constants are ɛ1 = 1.77, ɛ2 = −32.5 + i8.4, and ɛ3 = 2.25 for the water, metal, and glass media, respectively. Metal film thickness is 30 nm and the incident light wavelength is 514.5 nm.
Effect of a glass/water interface separated by a thin metal film on probe emission
When the excited dipolar probe is near a conducting and/or dielectric planar interface, the radiated fields are significantly altered (19,18,29–35). The dipole radiation field in the absence of the interface can be expressed as a sum over plane waves. The plane waves, reflected and refracted at the interface, are summed providing the perturbed dipole radiation field. The plane wave expansion method delineates contributions into propagating transverse and nonpropagating longitudinal or evanescent plane waves. The evanescent waves in the absence of the interface form the dipole near-field. Reflection and refraction at the interface convert some of the evanescent waves into detectable propagating transverse plane waves. SAF is light associated with the emission dipole near-field that is converted into propagating transverse plane waves by the close proximity of the interface. It appears in the glass medium at angles beyond critical angle giving rise to the supercritical fluorescence or SAF, see Fig. 2. In the presence of the metal surface, dipole emission into the glass medium is confined to a narrow cone with peak intensity at polar angle θm > θc, implying all light is emitted into the SAF region, i.e., there is no detectable subcritical angle fluorescence. For the aluminum film, θm ≈ 68°. In contrast, the bare glass interface transmits both subcritical and supercritical fluorescence. In our application, we collect emitted light from both subcritical and SAF regions.
The interface, particularly one containing a conductor, near the dipole radiator also affects total radiated power. Hellen and Axelrod (19) pointed out that for a fluorophore under steady illumination the dissipated power must equal the absorbed power, implying that a fixed power, rather than a fixed amplitude, dipole radiator is the appropriate model for probe emission near an interface (19). An important consequence of this model, observed for cells adsorbed to aluminum-coated glass (18,20), is that the metal film totally quenches fluorescence from probes within ∼10 nm of the interface.
Propagating plane waves incident on a dielectric or metallic interface obey boundary conditions determining the familiar Fresnel reflection coefficients for reflected field amplitudes (36). Hellen and Axelrod (19) described conditions where Fresnel reflection coefficients are inadequate and need to be replaced by alternative coefficients derived from quasistatic semiclassical infinite barrier (SCIB) theory (27). The SCIB correction, inserted when large amplitude radial wave vectors of the dipole near-field contribute to emission, is largest for dipoles very near to the metal film (≲5 nm) and affects total power dissipated by the dipole. All emission intensities computed include the SCIB correction, but its effect is undetectable in our applications.
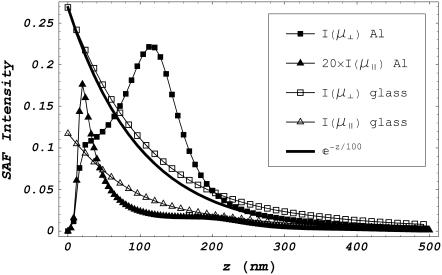
Fig. 4 shows the SAF emission intensity from dipolar probes as a function of their distance z from the interface. Light collection is from the glass medium and over a surface area that covers the solid cone of fluorescence emitted from the dipole and transmitting the interface with polar angle 105° ≤ θem ≤ 116° measured from the z axis depicted in Fig. 2. The SAF z-profiles indicate disparate patterns for probe dipole components oriented parallel (μ‖) or perpendicular (μ⊥) to the interface and for glass or metal surfaces. Also depicted for comparison is the exponential function e−z/100. I(μ‖) amplitude was adjusted to fit on scale as indicated in the legend. All emission intensities fall off rapidly in z, implying SAF is a tool for selectively detecting probes near the interface independent of how probes are excited.
FIGURE 4.
SAF intensity as a function of dipole distance z from the metal/water (metal) or glass/water interface (glass). Constants are identical to those in Fig. 3 and collection is from the glass medium over a surface area that covers the solid cone of fluorescence emitted from the dipole and transmitting the interface with polar angle 105° ≤ θem ≤ 116° measured from the z axis in Fig. 2. SAF z-profiles are indicated for dipole components parallel (μ‖) or perpendicular (μ⊥) to the interface. Also depicted for comparison is the exponential function e−z/100. SAF intensity for μ‖ at the metal film has a peak height ∼20-fold smaller than the other intensities as indicated in the legend. All emission intensities fall off rapidly in z, implying SAF selectively detects probes near the interface.
Metal film-enhanced TIRM
The thin metal film allows significant TIR excitation only for p-polarized incident light (Fig. 3). The evanescent field has elliptical polarization that is highly eccentric (essentially linear) in favor of polarization perpendicular to the interface allowing efficient excitation of the μ⊥ dipole component. Emission into the objective is dominated by the μ⊥ component with >20-fold higher efficiency than μ‖ dipoles, implying the interface acts as an emission polarizer. Emission intensity decays with the distance z from the interface in the complex patterns indicated in Fig. 4 (19).
Size and shape of the detection volume
Fluorescent intensity at the image plane in the diffraction limited, far-field microscope is the convolution of the excitation and emission intensity profiles (37). The light intensity profiles are derived from geometrical optics and given by the Fraunhofer diffraction pattern from a circular aperture (38). Detected fluorescence is the intensity at the image plane integrated over the confocal pinhole; thus the size and shape of the detected volume depends on the excitation beam profile, diffraction of emitted light through the microscope optics, and the size and shape of the confocal pinhole.
Excitation field intensity in the water medium containing the sample decays exponentially in the z-dimension normal to the glass/water interface. Intensity depth zd is given by
 |
(1) |
for n1 = (ɛ1)1/2, n3 = (ɛ3)1/2, and λ the excitation light wavelength in vacuum. Field intensity spatial distribution in lateral dimensions is essentially uniform. The emission intensity profile in the z-dimension is given in Fig. 4. The I(μ⊥) curve is appropriate for the metal-coated interface since I(μ‖) contributions are negligible. The point spread function (PSF) integrated over the pinhole aperture (IPSF) in image space as a function of point source position sets boundaries for detection volume appropriate for a point-like fluorescence emitter.
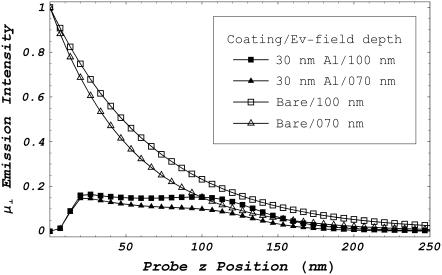
Fig. 5 compares the IPSF z-dimension profile for a unit magnitude dipole emitter μ⊥ under TIRM with and without a 30-nm aluminum film. Excitation light incidence angle was chosen to produce evanescent depths in the water medium of ∼70 and 100 nm. Emission is summed over the solid angle collected by an NA 1.45 microscope objective including both SAF and subcritical angle fluorescence (Fig. 2). For the metal film, essentially all emission is SAF and summation over subcritical angle fluorescence contributes negligibly to the IPSF z-profile. For the bare interface, subcritical angle fluorescence makes a substantial contribution to the IPSF z-profile. These conditions for computing Fig. 5 are appropriate for all observations reported here. We find that for equal excitation intensity, the metal film reduces overall detected intensity. The IPSF z-profile amplitude for the bare glass interface is >1/e for probes 0–80 nm from the interface. If only SAF light is included, this length changes to 0–50 nm (data not shown).
FIGURE 5.
The IPSF z-dimension profile for a unit magnitude dipole emitter perpendicular to the interface (μ⊥) under TIRM with and without a 30-nm-thick aluminum film. Excitation light incidence angle was chosen to produce evanescent field depths of ∼70 and 100 nm. Emission is collected from the glass medium over a surface area that covers the solid cone of fluorescence emitted from the dipole and transmitting the interface with polar angle 105° ≤ θem ≤ 180° measured from the z axis in Fig. 2 and appropriate for an NA 1.45 microscope objective. Collected fluorescence includes both SAF and subcritical angle fluorescence (Fig. 2). For the metal film, essentially all emission is SAF so the summation over subcritical angle fluorescence contributes negligibly to the IPSF z-profile. For the bare interface, subcritical angle fluorescence makes a substantial contribution to the IPSF z-profile.
We deployed identical chromophores in a rectangular solid lattice in sample space to calculate an effective detection volume for single molecule isolation (13). The lattice fills the volume occupied by sample in a real experiment. A single chromophore in the lattice, the principal chromophore, occupies the sample space equivalent of the maximum intensity point in the IPSF. Fluorescence detected from each chromophore in the lattice is summed and normalizes fluorescence collected from the principal chromophore as a function of unit cell lattice dimensions. We define the minimum unit cell in the lattice to have xyz-dimensions Lx × Ly × Lz for which the principal chromophore fluorescence accounts for more than half of the total fluorescence collected. The maximum volume defined by the lattice containing only the principal chromophore is the effective Vd. IPSF shape suggests it is the z > 0 half triaxial ellipsoid centered on the origin with semiaxes lengths Lx × Ly × Lz. Vd, estimated for 5- and 50-μm pinholes with the IPSF z-profiles shown in Fig. 5, is ∼7 and ∼70 attoL, respectively, for bare and metal-coated interfaces and the 100-nm evanescent field depth. There is ∼15% reduction in Vd with the 70-nm evanescent field depth. We show in Experimental Results that the metal film has the smaller Vd.
EXPERIMENTAL RESULTS
Observation of rhodamine labels in skeletal muscle fibers
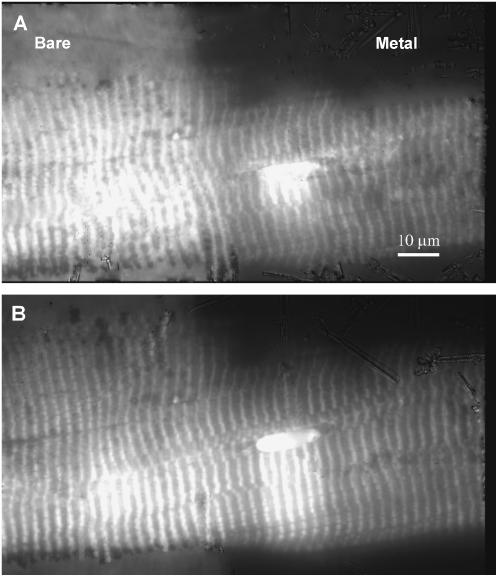
Skeletal muscle fibers were labeled with 5′IATR and observed under TIRM and metal film-enhanced TIRM with a CCD camera. Fig. 6 A shows a rhodamine-labeled fiber under TIRM where a split field of view shows collected fluorescence for a fiber contacting a bare glass interface (left) and a metal-coated interface (right). The striated pattern is due to localization of 5′IATR in the myosin thick filament in the sarcomeres. Bare glass meets the metal film at the line approximately centered in the field of view and demarcated by the background fluorescence visible from the bare glass side. The image shows the metal-coated side has the shallower detection volume as indicated by the disappearance of the striated pattern at the top of the image. The bright oval structure is a nucleus that has scattered surface plasmons creating propagating light. Propagating light creation by scattering excites fluorescence from labeled myosin that would otherwise be invisible. Fig. 6 B has the same object as panel A but with reduced excitation intensity and a somewhat deeper penetrating evanescent field. With the deeper field, more sample fluorescence is excited compared to background, hence the better sample/background contrast on the glass side of the image compared to Fig. 6 A. Larger evanescent field depth is indicated by the longer scattering “shadow” at the nucleus.
FIGURE 6.
A single skeletal muscle fiber labeled with 5′IATR and observed with fluorescence under metal film-enhanced TIRM (right) and TIRM at a bare-glass interface (left). Metal film thickness is 30–40 nm. Panels A and B correspond to different evanescent field depths. Panel B has the normal depth of ∼100 nm. Panel A is shallower but deeper than the minimal depth in Fig. 8. Observations were recorded on a CCD camera using a rhodamine filter set. The striated pattern is due to 5′IATR localization in the thick filament at the myosin cross-bridge. The bare-glass/metal-film boundary is demarcated by the abrupt change in background fluorescence. The bright oval structure is a nucleus that has scattered surface plasmons creating propagating light that excites fluorescence deeper in the fiber.
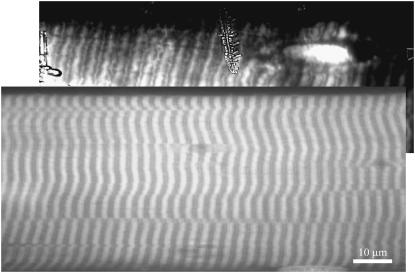
Fig. 7 compares fiber images from aluminum film-enhanced TIRM to an image from a conventional diffraction-limited confocal microscope. Different fibers were used in the two images; however, both fibers were from the same 5′IATR-labeled fiber bundle. The shallower depth of field gives better contrast to the TIRM image. The high contrast aluminum film-enhanced TIRM image shows 5′IATR label localized in the Z-disk as well as the thick filament of the fiber. This probably originates from the small fraction of α-actinin modified by 5′IATR. The conventional confocal image just registers the presence of the Z-disk localized label. CCD camera images sometimes show ice crystal formation on the camera window.
FIGURE 7.
Comparison of fluorescence images of two single skeletal muscle fibers labeled with 5′IATR. The upper image was taken under metal film-enhanced TIRM. Metal film thickness is 30–40 nm. The lower image was taken with a conventional diffraction-limited confocal microscope (no metal film present). Different fibers were used in the two images; however, both fibers were from the same 5′IATR-labeled fiber bundle. The metal film-enhanced TIRM image shows 5′IATR label localized in the Z-disk of the fiber and reveals features of Z-disk structure. The fluorescence probably originates from the small fraction of α-actinin modified by 5′IATR. The TIRM image shows ice crystal formation on the camera window.
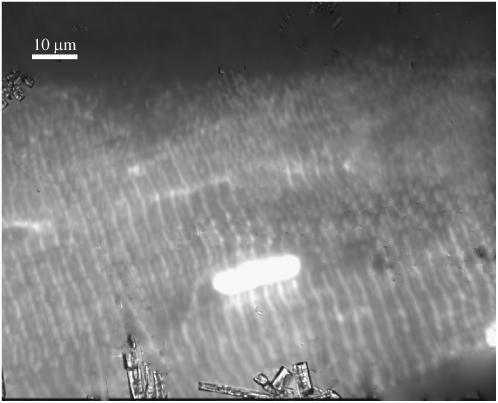
TIR illumination using the setup in Fig. 1 allows reasonably easy evanescent field depth adjustment by varying laser incidence angle. The incidence angle is affected by adjusting where the focused beam strikes the BFP. A critical angle incident beam produces a fluorescent streak propagating along the glass/metal/water interface. Figs. 6 B and 7 correspond to normal evanescent field depths caused by a just supercritical incident beam. This setting has normal field depths (∼100 nm) and produces the most intense fluorescence. Minimal field depth corresponds to a focused beam farthest from the center of the back aperture of the objective. We adjusted the focused spot to just inside the back aperture where TIR intensity begins to rapidly fall off due to input light intensity loss as it is blocked by the back aperture edge. Evanescent field strength is also influenced by SPR dependence on incidence angle (Fig. 3). Fig. 8 shows the image of the fiber under metal film-enhanced TIRM at minimal evanescent field depth. Here sarcomeres appear narrower, and scattering at the nucleus is minimal. Labeling at the Z-disk is visible but sometimes interrupted. Despite the low fluorescence light level, the fiber is cleanly imaged because of the good suppression of background fluorescence. The evanescent field producing the image in Fig. 6 A has intermediate depth between normal and minimal.
FIGURE 8.
Minimal evanescent field depth image from a single skeletal muscle fiber labeled with 5′IATR. Image was taken under metal film-enhanced TIRM. Metal film thickness is 30–40 nm. Sarcomeres appear narrower and scattering at the nucleus is minimal compared to the moderate field depth in Figs. 6 or 7. Labeling at the Z-disk is visible but interrupted. Despite the low fluorescence light level, the fiber is cleanly imaged because of the good suppression of background fluorescence by the metal film. The image shows ice crystal formation on the camera window.
Diffusing fluorescent spheres
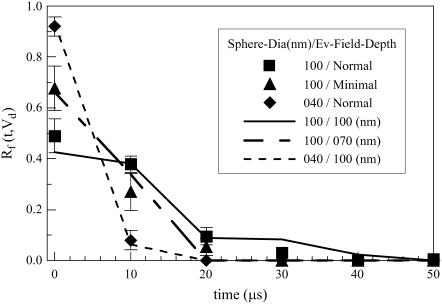
Fluorescence-labeled nanospheres in Brownian motion translate through Vd, producing a time-dependent intensity that depends on sphere diffusion constant D, Vd size and shape, and constraints imposed on sphere position by the presence of the planar glass/metal/water interface where TIR occurs (13). We model sphere diffusion as a three-dimensional random walk subject to constraints imposed by the presence of the planar interface. Fluorescent sphere random walks, generated for conditions identical to experiment, produced simulated fluorescence versus time traces. The simulated fluorescence from diffusing spheres, like its experimental counterpart, is mainly a null signal disturbed occasionally by short fluorescence bursts when a single sphere enters then leaves Vd (possibly several times in one encounter). Simulated and experimental data were subjected to identical automated event counting analyses to determine the fluorescence intensity residence duration distribution, Rf(t,Vd) (13).
Rf(t,Vd) characterizes sphere residence time inside Vd. It is the summed fluorescence intensity during a burst of t duration produced by an ensemble of sphere paths as a function of t. A single sphere encountering Vd could produce many events contributing to Rf(t,Vd). Size and shape of Vd under TIR illumination and with the 50-μm pinhole is a cylindrically symmetric solid volume with an axial depth defined by the IPSF z-profiles shown in Fig. 5. The axial depth is much shorter than any lateral dimension making sphere diffusion characteristics, in particular Rf(t,Vd), determined solely by the IPSF z-profile.
We observed fluorescence intensity versus time for 40- or 100-nm diameter fluorescent spheres diffusing through Vd for aluminum-film-enhanced TIRM using a NA 1.45, 60× objective and 50-μm diameter confocal pinhole. Two evanescent field depths were employed corresponding to normal from Fig. 6 B and minimal from Fig. 8. Fig. 9 indicates Rf(t,Vd) tabulated from observed (square, triangle, or diamond) and simulated (solid or dashed lines) data. Rf(t,Vd)s from 100-nm spheres (square or triangle) are broader than that for the 40-nm spheres (diamond) due to slower diffusion of the larger spheres. Likewise, Rf(t,Vd) from 100-nm spheres diffusing in the normal evanescent field (square) is broader than when they diffuse in the minimal evanescent field (triangle) because spheres are slower to leave the larger Vd defined by the normal evanescent field. Simulated data accurately reproduced the observed Rf(t,Vd)s where we used 100-nm (solid line) or 70-nm (long-short-dashed line) evanescent field depths. Simulated data for the 40-nm spheres (short-dashed line) used 100-nm evanescent field depth.
FIGURE 9.
The fluorescence intensity residence duration distribution, Rf(t,Vd), tabulated from observed (▪, ▴, or ♦) and simulated (solid or dashed lines) data. Error bars are the standard error of the mean for five independent observations of Rf(t,Vd). Rf(t,Vd)s from 100-nm spheres (▪ or ▴) are broader than that for the 40-nm spheres (♦) due to their slower diffusion. Likewise, Rf(t,Vd) from 100-nm spheres diffusing in the normal depth evanescent field (▪) is broader than when they diffuse in the minimal depth evanescent field (▴) because spheres are slower to leave the larger Vd defined by the deep evanescent field. Simulated data accurately reproduced the observed Rf(t,Vd)s where we used 100-nm (solid line) or 70-nm (long-short-dashed line) evanescent field depths. Simulated data for the 40-nm spheres (short-dashed line) used 100-nm evanescent field depth.
DISCUSSION
Confocal microscopy is widely used for acquiring high spatial resolution tissue sample images of interesting fluorescent molecules inside cells. The fluorescent molecules are often tagged proteins participating in a biological function. High spatial resolution in confocal microscopy compared to wide field imaging comes from an ability to optically isolate and image exceedingly small volume elements made up of the lateral (focal plane) and depth dimensions. Currently this means image formation from volumes on the order of 0.5 femtoliter (10−15L). The standard confocal microscope employs propagating far-field electromagnetic radiation for imaging and is a diffraction-limited instrument.
Nonpropagating evanescent fields decay exponentially in space to define subdiffraction-limited volumes (11,39). TIRM produces a one-dimensional evanescent field at the glass/water interface made by a coverslip contacting aqueous solution. Prism and prismless forms of TIRM have been described (40). Prismless TIRM utilizes a high NA oil immersion objective to refract excitation laser light at supercritical angles for total internal reflection (TIR) at the coverslip/water interface (12). As we did here, prismless TIRM is normally set up to illuminate a uniform field in object space (unfocused TIRM) using a laser beam focused at the BFP. Ruckstuhl and Seeger (16) developed prismless TIRM with a parabolic mirror objective (PMO) producing a focused spot on the sample in the aqueous medium (focused TIRM). They described results indicating the detection volume produced with this setup is <5 attoL. We have recently described a focused TIRM technique where a conventional high aperture objective substitutes for the PMO, producing a detection volume of ∼3 attoL (13). Axelrod et al. (18) introduced a nanometer scale metal film at the glass/water interface in TIRM (18–20). They showed that the metal film affects both excitation and probe-emitted fields in a manner that further enhances selective detection of fluorescent molecules at the interface. We characterize the effect of the metal film in TIRM on detection volume using diffusing fluorescent spheres and images from rhodamine-labeled cross-bridges in muscle fibers.
Fig. 5 compares IPSF z-profiles in the aqueous medium for the glass/water and glass/metal/water systems. The metal film quenches the fluorescence near z = 0 and more effectively eliminates fluorescence from the areas deeper in the sample although total fluorescence intensity is diminished. Detection volumes calculated from the IPSF z-profiles suggest that the metal film does not significantly reduce detected volume penetration into the water medium. In contrast, visual inspection (Fig. 6, A or B) indicates the metal film reduces the detected volume depth. One possible reason for this discrepancy is that aluminum film oxidization alters the relationships between the IPSF z-profiles to better favor z-dimension spatial selectivity in the aluminum coating. Another possibility is that the metal film reduces evanescent light scattering and conversion to deeply penetrating propagating light, thereby reducing fluorescence from sources deep within the sample. We tested the accuracy of the computed IPSF z-profiles for the metal films using diffusing fluorescent spheres.
Time-dependent fluorescence detected from diffusing fluorescent spheres characterizes size and shape of Vd via the fluorescence intensity residence duration distribution, Rf(t,Vd). Observed and simulated Rf(t,Vd)s were compared over a wide variety of conditions including various sphere diameters and two evanescent field depths (Fig. 9). The excellent agreement between the observed and simulated Rf(t,Vd)s suggests data in Fig. 5 are an accurate representation of the IPSF z-profile for metal film-enhanced TIRM and that the apparent reduction in Vd shown in Fig. 6, A or B, by incorporation of the metal film works by suppression of background fluorescence and light scattering rather than a discrepancy between real and theoretical IPSFs.
Previous work showing good agreement between simulated and observed Rf(t,Vd) characteristics derived from diffusing fluorescent spheres for the glass/water interface (no metal film) further supports the notion that the theoretical IPSFs are accurate (13). Evidently, fluorescence from background and extraneous light scattering does not perturb Vd from theoretical expectations enough for it to be detectable with Rf(t,Vd). It does make measurements more difficult because higher sample fluorescence levels are needed to overcome background. For example, we could not routinely detect 40-nm diameter fluorescent spheres above background with the glass/water interface and under the conditions used in Fig. 9. Additionally, the glass/water interface with the minimal evanescent field depth produced less fiber/background contrast (as an example compare panels A and B in Fig. 6 where the shallower field was not the minimal field) and was not practical for use with diffusing fluorescent spheres.
Fig. 7 compares images of labeled muscle fibers taken with metal film-enhanced TIRM and conventional far-field confocal fluorescence microscopy. The metal film-enhanced TIRM image is more spatially resolved as should be expected from a near-field technique. The contrast enhancement from the metal film reveals significant nonspecific labeling in the Z-disk that would be overlooked in the confocal image. Previous biochemical work locating sites of 5′IATR labeling in the muscle fiber indicated actin is the second most reactive protein (after myosin) with ∼15% of the total probe content. The actin should appear in the I-bands separating the bright thick filaments and probably is responsible for what appears to be the above background fluorescence in this region. The α-actinin in the Z-disk contains ∼5% of the total probe content. The image qualitatively confirms this assessment. The remaining probe was shown to reside on the myosin light chain and would appear in the bright thick filament indistinguishable from the myosin heavy chain. The image contrast afforded by metal film-enhanced TIRM suggests future biochemical work related to probe specificity in fiber constituent proteins can at least be qualitatively confirmed with visual microscopic inspection provided competing constituent proteins are spatially separated.
Our interest in single molecule detection in situ has motivated our desire to shrink the microscopic detection volume. We have isolated individual SH1-labeled myosin motors in myofibrils with confocal TIRM and detected actin association-dissociation kinetics in polarized fluorescence fluctuations (17). Actin-bound myosin is rigidly oriented in the complex, giving highly polarized fluorescence. Dissociated heads rotate freely and quickly, giving low polarized fluorescence. Polarized fluorescence was quantified by the ratio, P = (F‖ − F⊥)/(F‖ − F⊥), where F is fluorescence intensity and subscripts refer to emission polarization relative to the actin filament symmetry axis. Excitation polarization was linear and parallel to the actin filament axis. Polarization fluctuations reflect transitions between associated and dissociated states at a rate equal to phosphate production. S/N limitations and low polarization ratio contrast between states prohibited myosin dynamics characterization without ensemble averaging. The principal advantage of single molecule techniques is its ability to extract a characteristic of single molecule dynamics. We achieved something short of this goal by isolating fluorescence from single myosins in a muscle fiber without extracting a single myosin characteristic. The metal film-enhanced TIRM suppresses background fluorescence and reduces apparent detection volume. Background fluorescence suppression is essential for use of the minimal evanescent field depth TIRM shown in Fig. 8. There the sample emits at the lowest light level because it is illuminated with the least penetrative evanescent field. It is precisely under these conditions where TIRM is most effective for use in single molecule in situ imaging. Metal film-enhanced TIRM shows promise for taking us closer to our goal of extracting characteristics of single myosin dynamics in situ.
CONCLUSION
A thin metal film deposited on a glass substrate forms a multilayer system of glass/metal-film/water. Excitation light propagating toward the interface from the glass side at the surface plasmon incidence angle totally internally reflects, producing an evanescent field that excites fluorescence from probes on the water side but near the metal/water interface. Near-field probe emission perturbed by the metal-coated interface became propagating transverse waves in the glass medium that were collected in a high NA microscope objective as SAF. Far-field probe emission was reflected by the metal film and did not enter the objective. Similarly, in the absence of the metal film, incident light beyond critical angle totally internally reflects producing an evanescent field that excites fluorescence from probes on the water side but near the glass/water interface. Near-field probe emission perturbed by the glass/water interface became propagating transverse waves in the glass medium that were collected in a high NA microscope objective as SAF. Far-field probe emission was refracted at the glass/water interface but entered the objective as subcritical angle fluorescence. TIRM images of rhodamine-labeled muscle fibers from both kinds of interfaces were observed simultaneously using a glass coverslip substrate partially covered with a thin film of aluminum. The metal-coated portion had suppressed background fluorescence and a reduced apparent detection volume compared to the bare glass portion. Both properties enhance TIRM effectiveness for selective detection of molecules near the interface.
Acknowledgments
We thank Dr. Salah Sedarous from SemBionics, Rochester, MN, for assistance in characterizing metal film thickness.
This work was supported by National Institutes of Health-National Institute of Arthritis and Musculoskeletal and Skin Diseases grant R01AR049277 and the Mayo Foundation.
References
- 1.Burghardt, T. P., T. Ando, and J. Borejdo. 1983. Evidence for cross-bridge order in contraction of glycerinated skeletal muscle. Proc. Natl. Acad. Sci. USA. 80:7515–7519. [DOI] [PMC free article] [PubMed] [Google Scholar]
- 2.Feher, G., and M. Weissman. 1973. Fluctuations spectroscopy: determination of chemical reaction kinetics from the frequency spectrum of fluctuations. Proc. Natl. Acad. Sci. USA. 70:870–875. [DOI] [PMC free article] [PubMed] [Google Scholar]
- 3.Elson, E. L. 1974. Fluorescence correlation spectroscopy. I. Conceptual basis and theory. Biopolymers. 13:1–27. [DOI] [PubMed] [Google Scholar]
- 4.Thompson, N. L., and D. Axelrod. 1983. Immunoglobulin surface-binding kinetics studied by total internal reflection with fluorescence correlation spectroscopy. Biophys. J. 43:103–114. [DOI] [PMC free article] [PubMed] [Google Scholar]
- 5.Starr, T. E., and N. L. Thompson. 2002. Local diffusion and concentration of IgG near planar membranes: measurement by total internal reflection with fluorescence correlation spectroscopy. J. Phys. Chem. B. 106:2365–2371. [Google Scholar]
- 6.Lieto, A. M., R. C. Cush, and N. L. Thompson. 2003. Ligand-receptor kinetics measured by total internal reflection with fluorescence correlation spectroscopy. Biophys. J. 85:3294–3302. [DOI] [PMC free article] [PubMed] [Google Scholar]
- 7.Elson, E. L. 2004. Quick tour of fluorescence correlation spectroscopy from its inception. J. Biomed. Opt. 9:857–864. [DOI] [PubMed] [Google Scholar]
- 8.Yildiz, A., and P. R. Selvin. 2005. Fluorescence imaging with one nanometer accuracy: application to molecular motors. Acc. Chem. Res. 38:574–582. [DOI] [PubMed] [Google Scholar]
- 9.Rosenberg, S. A., M. E. Quinlan, J. N. Forkey, and Y. E. Goldman. 2005. Rotational motions of macromolecules by single-molecule fluorescence microscopy. Acc. Chem. Res. 38:583–593. [DOI] [PubMed] [Google Scholar]
- 10.Neuweiler, H., and M. Sauer. 2005. Exploring life by single-molecule fluorescence spectroscopy. Anal. Chem. 77:179A–185A. [DOI] [PubMed] [Google Scholar]
- 11.Dunn, R. C. 1999. Near-field scanning optical microscopy. Chem. Rev. 99:2891–2927. [DOI] [PubMed] [Google Scholar]
- 12.Axelrod, D. 2001. Total internal reflection fluorescence microscopy in cell biology. Traffic. 2:764–774. [DOI] [PubMed] [Google Scholar]
- 13.Burghardt, T. P., K. Ajtai, and J. Borejdo. 2006. In situ single molecule imaging with attoliter detection using objective total internal reflection confocal microscopy. Biochemistry. 45:4058–4068. [DOI] [PubMed] [Google Scholar]
- 14.Harrick, N. J. 1967. Internal Reflection Spectroscopy. Wiley Interscience, New York.
- 15.Ruckstuhl, T., and S. Seeger. 2003. Confocal total-internal-reflection fluorescence microscopy with a high-aperture parabolic mirror lens. Appl. Opt. 42:3277–3283. [DOI] [PubMed] [Google Scholar]
- 16.Ruckstuhl, T., and S. Seeger. 2004. Attoliter detection volumes by confocal total-internal-reflection fluorescence microscopy. Opt. Lett. 29:569–571. [DOI] [PubMed] [Google Scholar]
- 17.Borejdo, J., J. Talent, I. Akopova, and T. P. Burghardt. 2006. Rotations of a few cross-bridges in muscle by confocal total internal reflection microscopy. Biochim. Biophys. Acta. 1763:137–140. [DOI] [PubMed] [Google Scholar]
- 18.Axelrod, D., E. H. Hellen, and R. M. Fulbright. 1992. Total internal reflection fluorescence. In Topics in Fluorescence Spectroscopy, Vol. 3: Biomedical Applications. J. R. Lakowicz, editor. Plenum, New York. 289–343.
- 19.Hellen, E. H., and D. Axelrod. 1987. Fluorescence emission at dielectric and metal-film interfaces. J. Opt. Soc. Am. B. 4:337–350. [Google Scholar]
- 20.Fulbright, R. M., and D. Axelrod. 1993. Dynamics of nonspecific adsorption of insulin of erythrocyte membranes. J. Fluoresc. 3:1–16. [DOI] [PubMed] [Google Scholar]
- 21.Ruckstuhl, T., and D. Verdes. 2004. Supercritical angle fluorescence (SAF) microscopy. Opt. Express. 12:4246–4254. [DOI] [PubMed] [Google Scholar]
- 22.Bozhevolnyi, S. I., J. Erland, K. Leosson, P. M. W. Skovgaard, and J. M. Hvam. 2001. Waveguiding in surface plasmon polariton band gap structures. Phys. Rev. Lett. 86:3008–3011. [DOI] [PubMed] [Google Scholar]
- 23.Borejdo, J., S. Putnam, and M. F. Morales. 1979. Fluctuations in polarized fluorescence: evidence that muscle cross bridges rotate repetitively during contraction. Proc. Natl. Acad. Sci. USA. 76:6346–6350. [DOI] [PMC free article] [PubMed] [Google Scholar]
- 24.Ajtai, K., P. J. K. Ilich, A. Ringler, S. S. Sedarous, D. J. Toft, and T. P. Burghardt. 1992. Stereospecific reaction of muscle fiber proteins with the 5′ or 6′ isomer of iodoacetamidetetramethyl rhodamine. Biochemistry. 31:12431–12440. [DOI] [PubMed] [Google Scholar]
- 25.Burghardt, T. P., S. P. Garamszegi, and K. Ajtai. 1997. Probes bound to myosin Cys-707 rotate during length transients in contraction. Proc. Natl. Acad. Sci. USA. 94:9631–9636. [DOI] [PMC free article] [PubMed] [Google Scholar]
- 26.Weber, W. H., and C. F. Eagen. 1979. Energy transfer from an excited dye molecule to the surface plasmons of an adjacent metal. Opt. Lett. 4:236–238. [DOI] [PubMed] [Google Scholar]
- 27.Ford, G. W., and W. H. Weber. 1984. Electromagnetic interactions of molecules with metal surfaces. Phys. Rep. 113:195–287. [Google Scholar]
- 28.Burghardt, T. P., and N. L. Thompson. 1984. Evanescent intensity of a focused Gaussian light beam undergoing total internal reflection in a prism. Opt. Engn. 23:62–67. [Google Scholar]
- 29.Burghardt, T. P., and N. L. Thompson. 1984. Effect of planar dielectric interfaces on fluorescence emission and detection: evanescent emission with high aperture collection. Biophys. J. 46:729–738. [DOI] [PMC free article] [PubMed] [Google Scholar]
- 30.Thompson, N. L., H. M. McConnell, and T. P. Burghardt. 1984. Order in supported phospholipid monolayers detected by the dichroism of fluorescence excited with polarized evanescent illumination. Biophys. J. 46:739–748. [DOI] [PMC free article] [PubMed] [Google Scholar]
- 31.Burghardt, T. P. 1989. Polarized fluorescent emission from probes near dielectric interfaces. Chem. Phys. Lipids. 50:271–287. [Google Scholar]
- 32.Thompson, N. L., and T. P. Burghardt. 1986. Total-internal reflection fluorescence: measurement of spatial and orientational distributions of fluorophores near planar dielectric interfaces. Biophys. Chem. 25:91–97. [DOI] [PubMed] [Google Scholar]
- 33.Lukosz, W., and R. E. Kunz. 1978. Light emission by magnetic and electric dipoles close to a plane interface. I. Total radiated power. J. Opt. Soc. Am. 67:1607–1619. [Google Scholar]
- 34.Drexhage, K. H. 1974. Interaction of light with monomolecular dye layers. In Progress in Optics. E. Wolf, editor. North-Holland, Amsterdam, The Netherlands. 163–232.
- 35.Enderlein, J. 2000. A theoretical investigation of single-molecule fluorescence detection on thin metallic layers. Biophys. J. 78:2151–2158. [DOI] [PMC free article] [PubMed] [Google Scholar]
- 36.Born, M., and E. Wolf. 1975. Basic properties of the electromagnetic field. In Principles of Optics. Pergamon Press, Oxford, UK. 1–70.
- 37.Wilson, T. 1990. Confocal microscopy. In Confocal Microscopy. T. Wilson, editor. Academic Press, New York. 1–64.
- 38.Born, M., and E. Wolf. 1975. Electromagnetic theory of propagation, interference, and diffraction of light. In Principles of Optics. Pergamon Press, Oxford, UK. 370–458.
- 39.Levene, M. J., J. Korlach, S. W. Turner, M. Foquet, H. G. Craighead, and W. W. Webb. 2003. Zero-mode waveguides for single-molecule analysis at high concentrations. Science. 299:682–686. [DOI] [PubMed] [Google Scholar]
- 40.Axelrod, D., T. P. Burghardt, and N. L. Thompson. 1984. Total internal reflection fluorescence. Annu. Rev. Biophys. Bioeng. 13:247–268. [DOI] [PubMed] [Google Scholar]


