

Abstract
We studied the functional properties and underlying neural mechanisms associated with inhibitory combination-sensitive neurons in the mustached bat’s inferior colliculus (IC). In these neurons, the excitatory response to best frequency tones was suppressed by lower frequency signals (usually in the range 12-30 kHz) in a time-dependant manner. Of 143 inhibitory units, the majority (71%) were type I, in which low frequency sounds evoked inhibition only. In the remainder, however, the low frequency inhibitory signal also evoked excitation. Of these, excitation preceded the inhibition in type E/I units (16%), while in type I/E units (13%) excitation followed the inhibition. Type E/I and I/E units were distinct in the tuning and threshold sensitivity of low frequency responses, while type I units overlapped the other types in these features. In 71 neurons, antagonists to receptors for glycine (strychnine, STRY) or γ-aminobutyric acid (GABA) (bicuculline, BIC) were applied micro-iontophoretically. These antagonists failed to eliminate combination-sensitive inhibition in 92% (STRY), 93% (BIC), and 87% (BIC+STRY) of the type I units tested. However, inhibition was reduced in many neurons. Results were similar for type E/I and I/E inhibitory neurons. The results indicate that there are distinct populations of combination-sensitive inhibited neurons in the IC, and that these populations are at least partly independent of glycine or GABAA receptors in the IC. We propose that these populations originate in different brainstem auditory nuclei, that they may be modified by interactions within the IC, and that they may perform different spectrotemporal analyses of vocal signals.
Keywords: combination-sensitive, delay-tuned, FM-FM, mustached bat, spectral integration
INTRODUCTION
Analysis of complex sounds depends on comparison of information within different spectral or temporal elements of these sounds. The inner ears of vertebrates decompose sounds into distinct frequency channels, and while the ear may introduce some spectral interactions, e.g., distortion products and two-tone suppression, it is the central auditory system that is largely responsible for the interactions that underlie spectral comparisons. Centrally, spectral comparisons can be effected through facilitatory and additive neural interactions (Suga et al., 1978; Fuzessery and Feng, 1983; Margoliash and Fortune, 1992), but may arise more commonly through inhibitory interactions. The types of inhibitory spectral interactions are varied, including lateral (sideband) inhibition and very broadly tuned inhibition. A third type is inhibition tuned far from a neuron’s excitatory center: this inhibition suppresses a neuron’s response when distinct spectral elements are present (Mittmann and Wenstrup, 1995; Imig et al., 1997; Kanwal et al., 1999; Sutter et al., 1999). When this latter form of spectral inhibition also has specific temporal features, highly selective responses to complex sounds may result. These inhibitory features underlie sensitivity to or selectivity for sound location (Imig et al., 1997), sonar call-echo combinations (O’Neill, 1985; Olsen and Suga, 1991; Portfors and Wenstrup, 1999), and social vocalizations (Rauschecker and al, 1995; Portfors, 2004). This paper examines features associated with distant spectral inhibition in the mustached bat’s inferior colliculus (IC).
The inhibitory interactions examined here are termed combination-sensitive inhibition, since the inhibition suppresses a neuron’s response to one spectral element in vocal signals in the presence of a second spectral element (O’Neill, 1985; Mittmann and Wenstrup, 1995; Portfors and Wenstrup, 1999). Tuned to a frequency at least an octave away from the neuron’s best excitatory frequency, this inhibition is distinct from sideband or lateral inhibition. The low frequency inhibition is thought to result from a specifically tuned inhibitory input (Mittmann and Wenstrup, 1995; Portfors and Wenstrup, 1999), although cochlear suppressive phenomena cannot be ruled out in some cases (Marsh et al., 2006). In the mustached bat, combination-sensitive inhibition permits auditory responses to sonar echoes but suppresses responses to emitted sonar signals (Mittmann and Wenstrup, 1995; Portfors and Wenstrup, 1999), and may create other auditory responses that are selective for social vocalizations (Portfors, 2004).
Similar combinatorial inhibitory properties, by other names, occur in the auditory forebrain of several species (Rauschecker et al., 1995; Imig et al., 1997; Sutter et al., 1999; Kadia and Wang, 2003). While these specific spectral interactions appear to be more common at midbrain or forebrain levels, their origins are not understood. To examine both the origin and the types of inhibitory interactions in the mustached bat’s IC, we used single unit recording in combination with local application of antagonists to GABAA and glycine receptors. The results reveal different forms of inhibitory combination sensitivity with distinct temporal characteristics and frequency tuning. However, with few exceptions, the combination-sensitive inhibition persists after blockade of glycine or GABAA receptors in the IC.
MATERIALS AND METHODS
We examined auditory responses in the inferior colliculus (IC) of awake mustached bats (Pteronotus parnellii), captured in Trinidad and Tobago. Procedures used in this study were approved by the appropriate Institutional Animal Care and Use Committees. The methods are briefly described here. For a more detailed description, please refer to Nataraj and Wenstrup (2005).
Surgical procedures
Twelve bats provided data for this study. For surgery, some bats were anesthetized with methoxyflurane (Portfors and Wenstrup 1999), but most were anesthetized with isoflurane (Nataraj and Wenstrup 2005). After the anesthetic abolished nociceptive reflexes, the skull was exposed and cleaned. A tungsten ground electrode was cemented into the skull over the right cerebral hemisphere. A metal pin was cemented to the skull in order to position the head in the stereotaxic apparatus during physiological experiments. A hole (< 0.5 mm in diameter) was placed in the skull above the IC. After these procedures were completed, the animal was returned to the holding cage and allowed to recover for 2-3 days before starting physiological experiments.
Acoustic stimulation and data acquisition.
Acoustic stimulation and data acquisition were computer-controlled. Single and multiple tone bursts (4 to 31 ms duration, 0.5 ms rise/fall time, 4 presentations per second) were digitally synthesized and converted to analog signals at a sampling rate of 500 kHz. These analog signals were filtered, attenuated, amplified and sent to a loudspeaker placed 10 cm in front of the bat and 25° into the sound field contralateral to the IC under study. The performance of the entire acoustic system was tested with a calibrated microphone (Brüel and Kjaer, model 4135). There was a smooth decrease of approximately 2.7 dB per 10 kHz from 10 to 120 kHz. Distortion components were not detectable 60 dB below the signal level, as analyzed by an application a fast Fourier transform of the digitized microphone signal.
Extracellular potentials were first amplified and filtered (bandpass, 500-6000 Hz), then digitized at a sampling rate of 40 kHz and uploaded to the computer. Custom software calculated the time of occurrence of action potentials and displayed peristimulus time histograms (PSTHs), raster plots, and statistics of the neural responses in real time.
Recording procedures.
Physiological experiments were conducted inside a single-walled acoustic chamber lined with polyurethane foam to reduce echoes. On experimental days, the bat was placed in a stereotaxic apparatus inside the heated and humidified acoustic chamber. If the bat showed signs of discomfort or distress, it was lightly sedated with acepromazine (1 mg/kg, subcutaneous) or butorphanol (0.05 mg/kg, subcutaneous), or removed from the stereotaxic apparatus for the day. Recording sessions did not exceed 4-6 hours and were limited to one per day.
Single-unit recordings were obtained using a glass micropipette electrode mounted on a 5-barreled pipette (Havey and Caspary 1980). The multibarreled pipette (A-M Systems Inc.) was pulled to a tip and broken to a total tip diameter of 15-30 μm. The single barrel recording electrode (A-M Systems Inc.) was glued onto the tip of the multibarrel pipette at a 20° angle and protruded 10-25 μm beyond it. Recording electrodes were filled with 1 M NaCl and had resistances in the 10-30 MΩ range. One barrel of the pipette, filled with 1M NaCl, balanced currents of other channels that delivered or retained drugs. The remaining barrels were filled with strychnine-HCl (STRY) (10 mM in distilled water, 3.0 pH, Fluka, Milwaukee, WI), and bicuculline-methiodide (BIC) (10 mM in 0.9% NaCl, 3.0 pH, Sigma, St. Louis, MO). All drugs and recording solutions were prepared on the day of the experiment. Both STRY and BIC were retained with negative current (-15 nA each) and ejected using positive currents (15-40 nA for STRY and 10-50 nA for BIC). Each barrel of the multibarreled pipette was connected via a silver wire to a channel of a microiontophoresis current generator (Dagan programmable current generator, model 6400) that controlled the retention and ejection currents for each barrel separately. Drug ejection times and ejection currents were varied depending on the drug and the effect of the drug, as evaluated audiovisually and by quantitative tests.
Electrodes were advanced into the brain by a hydraulic micropositioner. Electrodes were angled to record from the high frequency (56-120 kHz) regions of the IC. Data were obtained only from well-isolated single units. When a single unit was isolated, the best frequency (BF) and minimum threshold at BF (MT) were obtained with single tone burst stimuli. BF was defined as that frequency requiring the lowest sound level to elicit consistent, stimulus-locked action potentials. MT was defined as the lowest sound level at the BF to elicit consistent, stimulus-locked action potentials. This use of the term “best frequency”, common in the neuroethological literature, is equivalent to “characteristic frequency”. We used a two-tone stimulus paradigm to evaluate the inhibitory combination-sensitive interactions. One of the tones was at the unit’s BF (high frequency signal), 10 dB above threshold. The second signal, within or adjacent to frequencies of the first harmonic of the biosonar call (23-30 kHz), was varied over a range of frequencies (10-40 kHz), sound intensities, and timing (delays) relative to the BF signal. When a combination-sensitive response was suspected, quantitative measures of delay-sensitive inhibition were obtained and compared to single-tone responses. In such tests, the lower frequency signal was presented at a level 10-15 dB above the threshold for inhibition. Responses to 32 presentations of each stimulus variable were collected.
Units were considered to show inhibitory combination-sensitive interactions if the response to the combined low and high frequency signals, separated by the appropriate delay, was at least 20% lower than the sum of the responses to the two signals presented separately. The strength of combination-sensitive interactions was quantified by an interaction index, where index = (Rc-Rl-Rh)/(Rc+Rl+Rh). Rc is the unit’s response to the combination of low and high frequency signals, Rl is the unit’s response to the low frequency signal alone, and Rh is the unit’s response to the high frequency signal alone. Interaction index values of +1 and -1 correspond to the strongest facilitation and inhibition, respectively, and interaction index values of 0.09 and -0.11 correspond to thresholds for facilitation and inhibition, respectively. For units that showed excitatory responses to the low frequency signal, we wished to isolate the inhibitory effects of the low frequency signal on the response to the BF signal. Consequently, the response to the combination of sounds were evaluated within a fixed, short duration time-window (10-20 ms wide) centered at the response to the BF signal and the interaction index was redefined as (Rc-Rh)/(Rc+Rh).
Identical delay sensitivity tests and rate-level functions were obtained prior, during and in some cases, after application of drugs. During drug application, rate-level or delay sensitivity tests were continuously obtained. Changes in response magnitude or the shape of response functions served to indicate the presence of a drug near the recording site. Low ejection currents, e.g. 10 nA, were used initially. If no effect was observed, the ejection current was gradually increased. For every current setting, delay curves were obtained until no further changes in response magnitudes or response functions were observed. With currents used in this study, effects of BIC and STRY could be observed as early as 2 and 3 minutes, respectively, while steady state effects of BIC and STRY could be observed after 4 and 8 minutes, respectively. If there was any indication that drugs could not be ejected, the pipette/electrode assembly was retracted and discarded. New piggybacked electrodes were used for every penetration.
To save time, data were collected in the following sequence: Control, Drug-1, Drug1+Drug-2, Recovery, Drug-2, and Recovery. The two drugs STRY and BIC were interchangeably applied as Drug-1 or Drug-2.
Data analysis.
Combination-sensitive interactions were characterized by three features: 1) the delay at which the interaction was at its maximum (best delay), 2) the range of delays over which the interaction occurred (delay width), and 3) the maximum strength of the interaction (interaction index).
Statistical analyses were performed with an error (α) level of 0.05. Analyses of variance tested for differences in various features of combination-sensitive interactions (best delay, delay width, interaction index) across the groups of inhibitory units. Within each group, paired t-tests were used to find significant differences among the features of the combination-sensitive interactions and regression analyses were performed to find significant correlations between these features. Mean values are reported with the corresponding standard error (mean ± standard error of the mean). Wherever possible, statistical tests are reported in the corresponding figure legend rather than in the text.
RESULTS
This study describes the response properties of 143 inhibitory combination-sensitive units, 41% of units that we tested for combination sensitivity in the IC of the mustached bat (n = 346). Facilitated combination-sensitive neurons among this population (23% of 346 units) were described previously (Nataraj and Wenstrup, 2005). The remainder (36%) showed neither combination-sensitive facilitation nor inhibition, but could have either single- or multi-peaked tuning. For units in this study, the response to BF tones was inhibited by a second, lower frequency tone presented in a specific temporal relationship. BFs ranged from 57.8-101.9 kHz because we sampled within these tonotopic representations in the IC. The lower frequency sound (inhibitory sound) was tuned to frequencies within the sonar fundamental (23-30 kHz, n = 82), below it (12-22 kHz, n = 59), or above it (39-41 kHz, n = 2). The frequency combinations occur in pulse-echo combinations of biosonar signals as well as in social vocalizations.
The inhibitory combination-sensitive units could be segregated into three main groups based on the presence and timing of excitation evoked by the low frequency tone. The results describe the temporal and spectral response features of these groups. Further, in 71 of these units, we studied effects of blocking glycinergic and/or GABAergic inhibition by local iontophoretic application of strychnine (STRY) or bicuculline (BIC), respectively, to examine underlying neural mechanisms.
Three types of inhibitory combination-sensitive units
The most common type of response to the lower frequency signal, type I, was exclusively inhibitory. For the unit in Figure 1A, we observed a good response to the BF tone (69.6 kHz), but no response to a low frequency tone at 27.8 kHz. Inhibition by the lower frequency tone was revealed in two-tone tests that varied the timing of the two signals. The lower frequency tone strongly inhibited the BF response when the two tones were presented simultaneously, at 0 ms delay. The delay function suggests that the low frequency signal evoked only inhibition, unlike facilitated combination-sensitive neurons described elsewhere (Nataraj and Wenstrup, 2005). Seventy-one percent (n = 101) of all inhibitory combinatorial units belonged to this I group.
Fig. 1.

Types of inhibitory combination-sensitive units. For each type, we show the delay sensitivity curve and a series of peristimulus time histograms (PSTHs). The magnitude of responses to individual sounds is shown to the right of the delay curve. The higher frequency tone is the unit’s BF and the lower frequency (LF) tone is the unit’s best inhibitory tone. In PSTHs, the timing and duration of the BF and LF tones are indicated by filled and unfilled bars, respectively. Gray boxes in PSTHs indicate the time window within which response magnitude was evaluated. Spike counts and the delay curves are based on the time-windowed responses. The response functions with unfilled circles are based on spike counts within the entire 100 ms window. A: Type I unit shows best inhibitory interaction at 0 ms delay. [BF, 69.6 kHz, 48 dB SPL; LF, 27.8 kHz, 64 dB SPL] B: Type E/I unit shows excitatory responses to both low and high frequency tones, with the low frequency sound strongly inhibiting the high frequency response at 6 ms delay. [BF, 59.3 kHz, 25 dB SPL; LF, 16.8 kHz, 67 dB SPL] C: Type I/E unit shows inhibition at delays between -6 and 6 ms. [BF, 77.9 kHz, 41 dB SPL; LF, 27.6 kHz, 42 dB SPL] D: Type I/E unit with inhibition at short delays (-4 to 0 ms) and at long delays (14 to 26 ms). [BF, 86.8 kHz, 49 dB SPL; LF, 26.4 kHz, 50 dB SPL]
A second group of units (E/I) displayed an excitatory response to the lower frequency signal that preceded its inhibitory effect. For the unit in Figure 1B, we observed robust responses to both the BF tone and the lower frequency tone at similar latencies (BF, 10.6 ms; Lower frequency (LF), 9.9 ms). The delay function revealed a broad range of delays over which the response to the combination of sounds was less the sum of responses to individual tones (Fig. 1B, unwindowed delay function and total response in PSTHs). In part, this resulted from a direct occlusion of one excitatory response by the other: when the two excitatory responses were expected to overlap at 0 ms delay, the response was no greater than the larger of the two responses to the individual tones (Fig. 1B, ▵t = 0 ms). However, the low frequency signal also suppressed the high frequency response even after the low frequency excitatory response had ended (Fig. 1B, ▵t = 6 ms). To examine quantitatively how the lower frequency signal inhibited the excitatory response to the BF signal, we analyzed spikes within a short-duration time-window centered on the BF response (Fig 1B; windowed curve in delay function, gray boxes in PSTHs). This windowed delay curve shows that the BF response was strongly inhibited when the BF signal was delayed by 4-8 ms. Thus, the delay function suggests that the low frequency signal evoked an inhibition that followed excitation. Sixteen percent (n = 23) of all inhibitory combinatorial units belonged to this E/I group.
The third group of units (I/E) displayed an excitatory response to the lower frequency signal that followed the inhibitory effect (n = 19, 13%). For the unit in Figure 1C, there was a strong response to the BF tone and a weaker response to a low frequency tone, with a large difference between response latencies (BF, 12.1 ms; LF, 28.4 ms). In Figure 1C, the windowed delay function and PSTHs revealed complete inhibition of the BF response by the lower frequency signal over a range of delays from -4 ms to +4 ms. Note that the strong response in the windowed curve at delays of 12-18 ms is not a facilitated response, but rather a summation of excitatory responses to the BF and lower frequency signal that fall within the time window. This contrasts with the occlusion observed in the E/I unit in Figure 1B. The delay function and low frequency response suggest that the low frequency signal evoked an excitation preceded by inhibition. Thirteen percent (n = 19) of all inhibitory combinatorial units belonged to this group.
In several type I/E units, delay curves suggested the presence of a low frequency inhibitory effect at latencies longer than the excitatory response, in addition to inhibition preceding the excitation (n = 13, 68% of I/E units). We included these in the type I/E category since they share some distinctive response features. For the unit in Figure 1D, excitatory responses were obtained to sounds at the BF and at a lower frequency. The windowed delay function and PSTHs revealed strong suppression of the BF response by the low frequency tone at two delay ranges, -4-0 ms and 14-26 ms. These suppressive regions of the delay curve are caused by inhibition that precedes and follows, respectively, the excitatory response to the lower frequency signal. The result is a tuned delay sensitivity function, with inhibitory delays flanking the best excitatory delays of 4-10 ms that show summation of excitatory responses to the low and high frequency signals. This delay tuning is similar to the delay sensitive response of some facilitated combination-sensitive units described elsewhere (Olsen and Suga, 1991; Edamatsu and Suga, 1993; Nataraj and Wenstrup, 2005). However, in the unit in Figure 1D, the strong response is created not by facilitation but rather by a summation of the low and high frequency excitatory responses.
Functional properties of inhibitory combinatorial neurons
In this section we consider the functional properties of the lower frequency response among inhibitory combination-sensitive units.
Frequency tuning. Low frequency inhibition was almost always tuned to the 15-30 kHz range (97%, Fig. 2A). This includes two behaviorally relevant bands: frequencies below 23 kHz used in social vocalizations but not in biosonar, and the 23-30 kHz band used in both acoustic behaviors.
Fig. 2.
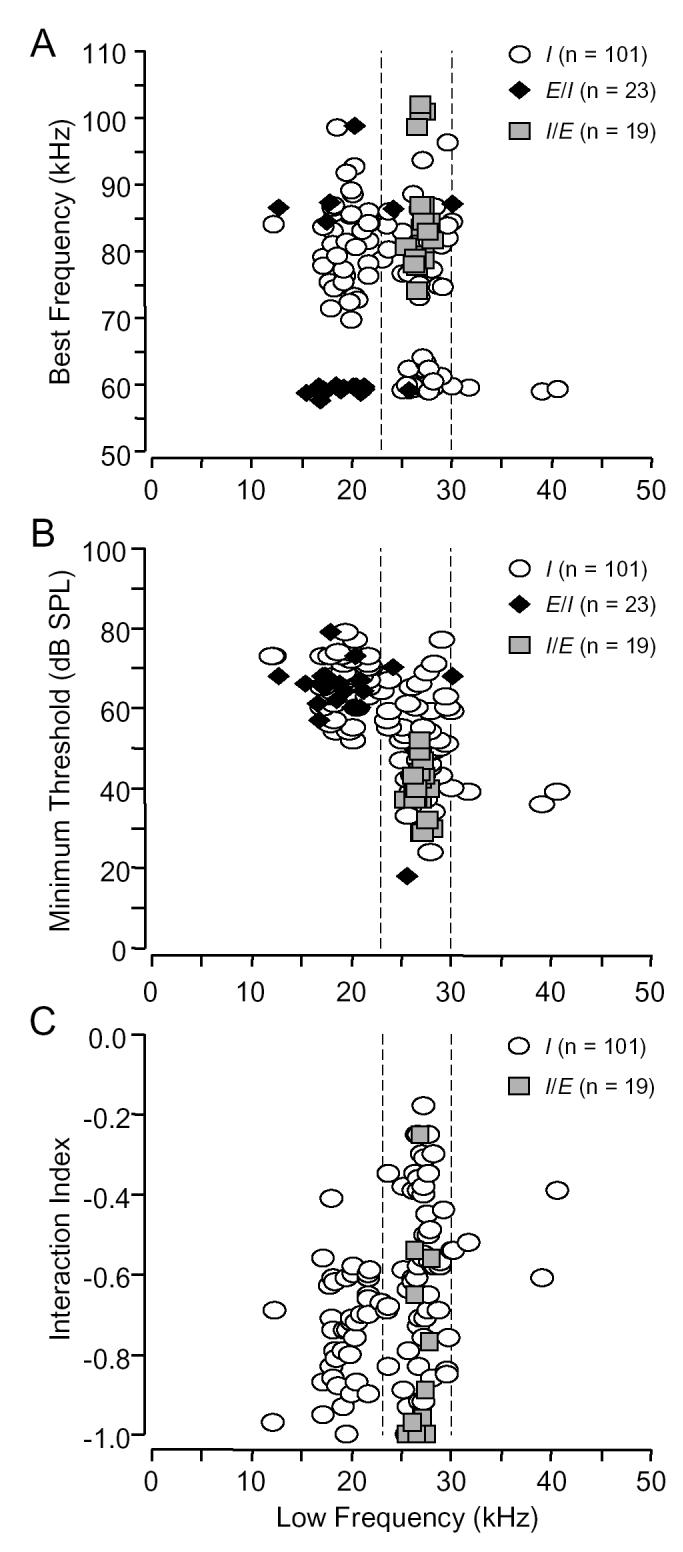
Frequency (A), threshold (B), and strength of inhibition (C) for different types of inhibitory combination-sensitive units. The dashed vertical lines indicate the frequency range associated with the first harmonic (23-30 kHz) of the biosonar call. A: Different inhibitory types had different distributions of best excitatory (high) and best inhibitory (low) frequencies. B: Inhibition tuned below 23 kHz had significantly higher thresholds than inhibition tuned to ⩾23 kHz (ANOVA, p <0.001). Type I/E units had significantly lower thresholds than similarly tuned type I units (ANOVA, p <0.001). C: In type I units, inhibition tuned <23 kHz (average: -0.74, 71% inhibition) was stronger than inhibition tuned ⩾23 kHz (average: -0.59, 54% inhibition)., but inhibition in type I/E units (average: -0.87, 93% inhibition) was strongest (t-tests, p <0.05).
There was no harmonic relationship between the lower frequency sensitivity, either excitatory or inhibitory, and the unit’s BF (Fig. 2A). Type I units were the most diverse in their tuning; they had both the broadest range of BFs and the broadest range of lower frequency tuning. However, there were no type I units in which the BF was tuned near 60 kHz and the lower frequency was tuned below 23 kHz. In contrast, nearly all E/I units had BFs tuned near 60 or 90 kHz and lower frequency responses below 23 kHz. For all I/E units, the BF was tuned to frequencies within a higher harmonic of the frequency modulated (FM) component of the sonar signal while the lower frequency response was tuned in the range 25.5-28.1 kHz, corresponding to frequencies within the fundamental FM component of the sonar signal.
Threshold of low frequency inhibition. Lower frequency inhibition had thresholds ranging from 18-79 dB SPL. The frequency tuning of the inhibitory input explained most differences in threshold (Fig. 2B). Thus, inhibition tuned below 23 kHz had significantly higher thresholds than did inhibition tuned to frequencies ⩾23 kHz. These frequency-dependant differences in the threshold of inhibition correspond closely to frequency-dependant differences in excitatory thresholds of low frequency neurons in the cochlear nucleus (Marsh et al., 2006). In one instance inhibitory threshold could not be explained by frequency tuning. Thus, for inhibition tuned ⩾23 kHz, I/E units had significantly lower thresholds than I units (Fig 2B). This is one of several functional differences between comparably tuned type I and I/E units.
Strength of inhibitory interactions. The strength of inhibitory interactions varied with the frequency tuning and type of inhibitory input (Fig. 2C). For type I units, low frequency inhibition tuned below 23 kHz was significantly stronger than the inhibition tuned to 23 kHz and above. However, the strongest inhibition was observed among I/E units. In I/E units that showed inhibition at later delays, the inhibition at later delays was significantly weaker than the inhibition occurring at early delays (short: -0.89 ± 0.05, long: -0.51 ± 0.04, ANOVA, p <0.001). We excluded type E/I units from this analysis because data presented later suggests that the strongest inhibition in E/I units may occur when BF and inhibitory signals were presented simultaneously. The strength of this inhibition is obscured by the excitatory response to the lower frequency signal.
Best delay and delay width of inhibitory interactions. In most units, the timing and duration of the low frequency inhibition were best assessed using the delay function. In this function, the best delay of inhibition describes the delay at which inhibition is maximal. Among 120 units of types I and I/E, 85% had best inhibitory delays of 0 ms, ranging from -4 to 4 ms (Fig. 3A). This suggests that the low frequency inhibitory effect has a latency that is usually the same or slightly shorter than the excitatory response to the BF signal. In I/E units showing inhibition at later delays, the average best delay of later inhibition was 23.0 ± 2.3 ms (range: 14-36 ms). The delay of the maximal inhibition in E/I units may be obscured by the excitatory low frequency response.
Fig. 3.
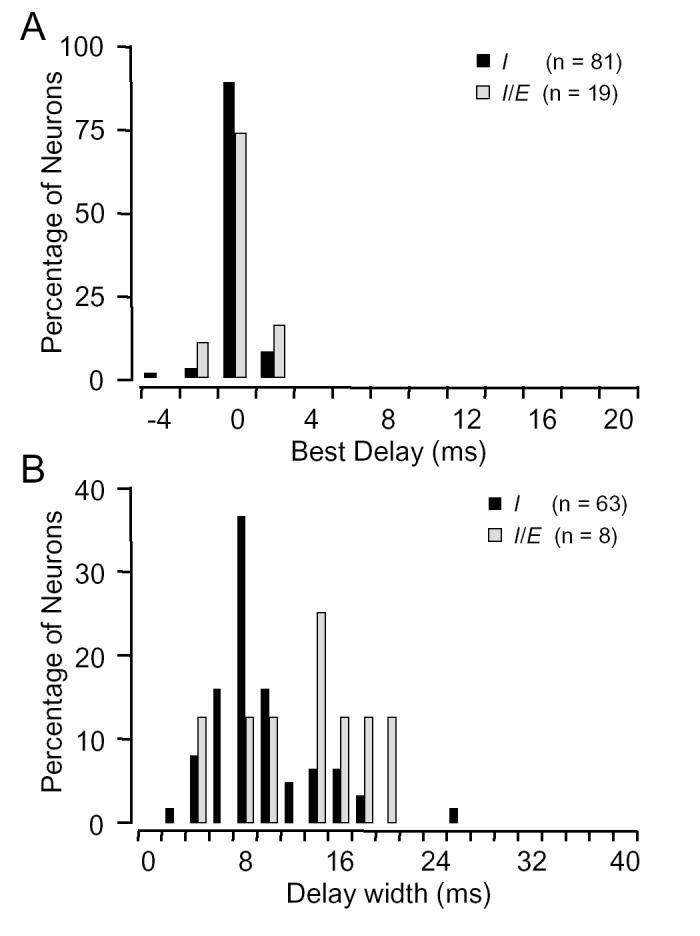
Temporal properties of low frequency inhibitory input. A: Best delay of inhibition for types I and I/E units almost always occurred at 0 ms delay (simultaneous BF and low frequency signals). Corresponding data for E/I units and for inhibition at longer delays in I/E units have been excluded (see text for explanation). B: The average duration of inhibition at early delays for I/E units (13.0±1.9 ms) was significantly longer than in I units (9.2.± 0.5 ms) (ANOVA, p <0.05).
The range of delays over which the BF response was suppressed, termed the “delay width”, provided a measure of the duration of the low frequency inhibition (Fig. 3B). Among 63 type I units tested with 4 ms signals, delay width averaged 9.2 ± 0.5 ms (range: 2.3 to 26.2 ms, Fig. 3B). The average delay width for units with inhibition tuned below 23 kHz was not significantly different from the inhibition tuned ⩾23 kHz. For I/E units, however, the average delay width was significantly longer than type I units as a whole or comparably tuned type I units (see Fig. 3B legend). These data show that the low frequency inhibition usually lasted over twice as long as the 4 ms signal that evoked the inhibition. In type I/E units, inhibition averaged over three times as long as the 4 ms inhibitory signal. A corresponding value for delay width could not be obtained for type E/I units.
Features of excitatory responses. As expected, low frequency excitatory latencies in E/I units were much shorter than in I/E inhibitory units, with no overlap between the two populations (Fig. 4A). The timing of low frequency excitation relative to the BF response also differed for the two types of units. As background, latencies of responses to the BF sound averaged 8.6 ± 0.2 ms and did not differ significantly among the types of inhibitory combination-sensitive units. Figure 4A compares the BF and lower frequency latencies for E/I and I/E units. Among I/E units, the latencies of responses to the low frequency sound were much longer than to the BF sound. In contrast, for E/I units, the latency of response to the lower frequency signal was only slightly but significantly less than to the BF signal (see Figure 4A legend).
Fig. 4.

Low frequency excitation relates to BF responses differently in E/I and I/E units. A: Latencies of low frequency excitatory responses in E/I units (8.9 ± 0.5 ms) were always shorter than in I/E units (23.1 ± 1.2 ms). In E/I units, the latencies of responses to low frequency were slightly less than to BF signals (mean difference: 0.9 ms, p <0.01, paired t test). However, in I/E units, latencies of responses to low frequency signals were significantly longer than the latencies of responses to BF signals (mean difference: 14.8 ms, p <0.01, paired t test). Dashed line indicates unity slope. Latency values were obtained at 10 dB above minimum threshold. B: Comparison between response to best combination stimulus (BF and low frequency stimuli combined) and the sum of separate responses to BF and low frequency stimuli, plotted for E/I and I/E units. Dashed line indicates unity slope, where the response to the combination stimulus matched the sum of separate responses to the two signals. Slope of regression line (m) and correlation coefficient (r) are indicated for each population. Across I/E units, the response to the combination stimulus closely matched the sum of separate responses, while in E/I units there was a poor match. This indicates that I/E units sum the effects of low frequency and BF excitation. C: Comparison between response to best combination stimulus (BF and low frequency stimuli combined) and the response to low frequency stimuli, plotted for E/I and I/E units. Dashed line indicates unity slope, where the response to the combination stimulus matched the response to the low frequency signal. In most E/I units, the response to the combination closely matched the low frequency response, suggesting that the low frequency response occluded the response to the BF signal. D,E: Occlusion in two E/I units. Dot raster displays of responses to BF, low frequency, and combination stimuli at two delays. At 0 ms delay, the pattern, latency, and magnitude of the combination response was similar to the low frequency response. When the BF signal preceded the low frequency signal by 2-4 ms, the combination response better matched the BF response. Note the inhibition of low frequency response by the earlier BF signal in the rasters at bottom. D: [BF, 59.53 kHz, 24 dB SPL; LF, 18.9 kHz, 76 dB SPL] E: [BF, 59.02 kHz, 24 dB SPL; LF, 17.5 kHz, 78 dB SPL]
The contribution of low frequency excitation to the magnitude of the response to tone combinations was different for E/I and I/E units. To assess this, we examined the response of each unit at tone delays for which the excitatory responses should overlap maximally. The response to that combination stimulus is compared to the sum of low and BF response (Fig. 4B) and to the low frequency response alone (Fig. 4C). For I/E units, the maximum combination response was closely related to the sum of the low frequency and BF responses. There was much less agreement with BF responses (not shown) and low frequency responses. Thus, for I/E units, the best discharge to the combination stimulus appeared to result from a summation of the excitation to the low frequency and BF signals.
For E/I units, the response to the combination stimulus did not show summation. At 0 delay—when the low frequency excitatory response begins slightly before the BF response—the observed response was always less than that predicted by the sum of the individual low frequency and BF responses (Fig. 4B). Instead, the response was usually a close match to the low frequency response (Fig. 4C). This is documented for two units in Figure 4D,E. In each, the response to the simultaneous combination of low frequency and BF signals evokes an excitatory response that better matches the response to the lower frequency signal in latency, magnitude, and temporal response pattern. Moreover, it is clear that there is no summation of the excitatory responses to the two signals. Thus, when it arrives earlier, the low frequency response occluded the response to the BF signal, suggesting that the low frequency inhibition observed in E/I units begins simultaneously with the unit’s excitatory responses to the low frequency signal. However, the extent of this suppression is masked by the low frequency excitatory response. When the lower frequency signal is delayed by a small amount, the response appears to match better the response to the BF signal, but again no summation occurs.
Effect of drugs on inhibitory combination-sensitive responses
Using microiontophoretic application of strychnine (STRY) and bicuculline (BIC), we examined the contribution of glycine and GABAA receptors in the IC to inhibitory combinatorial interactions. Responses of these units were examined before and during the application of STRY (n = 20), BIC (n = 54), or BIC and STRY combined (BIC+STRY, n = 20). The major result is that application of STRY, BIC or BIC+STRY failed to eliminate combination-sensitive inhibition in nearly all units (Table 1).
| Response | STRY | BIC | BIC+STRY |
|---|---|---|---|
| Type I | 1 of 14 (8%) | 3 of 40 (7%) | 2 of 15 (13%) |
| Type E/I | 0 of 4 (0%) | 0 of 7 (0%) | 0 of 1(0%) |
| Type I/E (early inhibition) | 0 of 4 (0%) | 0 of 7 (0%) | 1 of 4 (25%) |
| Type I/E (later inhibition) | 2 of 3 (67%) | 0 of 4 (0%) | 3 of 3 (100%) |
Figure 5 displays effects of BIC, STRY, or BIC+STRY application on type I inhibitory units. For the unit in Figure 5A, the inhibition occurring at 0 ms delay was not eliminated by BIC alone or combined with STRY. The strength of inhibition was increased with application of BIC, and addition of STRY did not alter the strength dramatically (control interaction index: -0.41, BIC: -0.66, BIC+STRY: -0.53). In a second unit (Fig. 5B), under control conditions, the response to the 85.7 kHz BF tone was strongly inhibited by a 26.3 kHz signal at a best delay of 0 ms (interaction index = -0.62). Application of STRY, by itself or with BIC, did not eliminate this inhibitory interaction, although both appear to have reduced the inhibition at later delays (2-6 ms). Across all type I units, application of STRY, BIC, or BIC+STRY failed to eliminate the inhibition at the best inhibitory delay in 11 of 12 (92%), 37 of 40 (93%), and 13 of 15 (87%) units, respectively (Table 1).
Fig. 5.

Type I inhibitory combination-sensitive interactions are not eliminated by application of strychnine (STRY), bicuculline (BIC), or by combination of STRY and BIC (BIC+STRY). A: Type I unit tested with BIC (35 nA), then BIC+STRY (STRY: 19 nA). Although the drugs increased the magnitude of response to the 83.9 kHz signal, combinatorial inhibition at 0 ms delay remained strong. [BF, 83.9 kHz, 55 dB SPL; LF, 18.1 kHz, 74 dB SPL] B: Type I unit tested with STRY (15 nA), then BIC+STRY (BIC: 15 nA). Drug application did not reduce inhibition at 0 ms delay, but did eliminate inhibition at longer delays. [BF, 85.7 kHz, 45 dB SPL; LF, 26.3 kHz, 53 dB SPL] See Figure 1 for explanation of graphs.
Figure 6 shows that application of STRY or BIC failed to eliminate combinatorial inhibition in E/I units. In both units illustrated, the BF and lower frequency signal showed excitatory responses. Inhibition was observed at delays as short as 2 ms, but extended up to delays of 36 ms (Fig. 6A) and 27 ms (Fig. 6B), respectively. At delays of 8 ms (Fig. 6A) and 6 ms (Fig. 6B), the low frequency sound completely suppressed the response to the BF sound. Although application of the drugs increased the excitatory responses of the units to both the BF and 19 kHz signals, neither BIC (Fig. 6A) nor STRY (Fig. 6B) eliminated the strong inhibitory interactions. Among E/I units, neither STRY (n = 4) nor BIC (n = 6) eliminated the inhibition in any unit (Table 1).
Fig. 6.

Type E/I inhibitory combination-sensitive interactions are not eliminated by application of STRY or BIC. A: Type E/I unit tested with BIC (15 nA). Although BIC increased the magnitude of responses to both tones, inhibition at delays between 4 and 8 ms remained strong. [BF, 59.53 kHz, 24 dB SPL; LF, 18.9 kHz, 76 dB SPL] B: Type E/I unit tested with STRY (20 nA). Drug application reduced the combination-sensitive inhibition at delays between 4 and 6 ms, but did not eliminate it. [BF, 59.08 kHz, 28 dB SPL; LF, 19.3 kHz, 74 dB SPL] See Figure 1 for explanation of graphs.
For type I/E units, BIC did not eliminate the low frequency inhibitory effect. The unit in Figure 7A showed low frequency inhibition both at early delays centered at -2 ms and at later delays centered at 18 ms. Application of BIC had no effect on the inhibition at early delays and reduced the inhibition at later delays by only a small amount (from -0.46 to -0.34). Similar to other units displayed, BIC increased the discharge rate to both BF and lower frequency signals. Across the seven type I/E units tested, BIC failed to eliminate inhibition at early and later delays (Table 1).
Fig. 7.

Inhibition at early and later delays in type I/E inhibitory units is more sensitive to application of STRY than BIC. A: Type I/E inhibitory unit showed inhibition at both short and long delays. Although BIC increased the magnitude of the response to both tones, the inhibition at shorter delays (-2 ms) and longer delays (18 ms) remained. [BF, 79.5 kHz, 35 dB SPL; LF, 27.4 kHz, 53 dB SPL] B: Type I/E inhibitory unit showing inhibition at short and long delays. STRY (15 nA) severely reduced the combination-sensitive inhibition at early delays (centered at 3 ms) and later delays (centered at 39 ms). [BF, 83.4 kHz, 41 dB SPL; LF, 27.1 kHz, 52 dB SPL] See Figure 1 for explanation of graphs.
Application of STRY usually had a major effect on the low frequency inhibition of type I/E units. For the unit in Figure 7B, strong inhibition of the response to the BF signal by a lower frequency signal was observed at delays from 0 to 6 ms, and moderate inhibition observed at longer delays of 30-36 ms. Application of STRY substantially reduced the strength of inhibition at short delays and eliminated the later inhibition. Across the small sample of I/E units, application of STRY failed to eliminate inhibition at early delays in 100% (n = 4), but inhibition was substantially reduced in three of four units. Application of BIC and STRY together (not shown) failed to eliminate inhibition in three of four units, but substantially reduced inhibition in all four units (Table 1).
For type I/E units with later inhibition, STRY eliminated inhibition in two of three units, and BIC+STRY eliminated inhibition in three of three units. In contrast, BIC failed to eliminate later inhibition in each of the four units tested (Table 1).
Quantitative effects of drugs on response properties
Strength of combinatorial inhibition. Although drug application rarely eliminated combination-sensitive inhibition, there were clear effects on the strength of combinatorial interactions. Thus, STRY eliminated combination-sensitive inhibition at early delays in only one of 20 units tested, but there was a significant decrease in the strength of the inhibition across the population, from -0.68 to -0.43 (p <0.001, paired t test). This corresponds to a change from 81% inhibition to 60% inhibition. The effect was observed across each type of inhibitory unit (Fig. 8A-C, top row). Similarly, BIC application significantly decreased the strength of inhibition across the test population from -0.65 to -0.47 (p <0.001, paired t test), although inhibition was eliminated in only 3 of 52 units. All three types of units were similarly affected by BIC application (Fig. 8A-C, middle row). When STRY and BIC were applied together, inhibition at short delays was eliminated in only 3 of 19 units tested (Fig. 8, bottom row), but the strength of inhibition at short delays was reduced from -0.67 to -0.39 (p <0.001, paired t test).
Fig. 8.

Quantitative effects of drugs on inhibitory interactions and duration of inhibition. Inhibition at longer delays in some I/E units is not included in this analysis. A-C: Comparison of the strength of inhibition (interaction index) before and during application drugs in different types of inhibitory combination-sensitive units. Drug application failed to eliminate combinatorial inhibition in most units, although application of each drug significantly reduced inhibition across the population. D: Comparison of the duration of inhibition (delay width) before and during drug application. Effects of drugs varied widely; only BIC had a significant effect across the population to reduce delay width (Control mean: 10.1 ms, BIC mean: 8.0 ms). Dashed lines in A-C indicate index values corresponding to thresholds for facilitation (0.09) and inhibition (-0.11). Separate dots and error bars indicate the mean and standard error of the mean for the sample. Asterisks indicate significant differences between control and drug tests using paired t-tests (* p <0.05, ** p <0.01).
In extensive statistical tests using analyses of variance, we examined whether the effects of drug application on the strength of inhibition were related to the particular drug, the type of inhibitory combination sensitive unit, or the frequency tuning of inhibition. These analyses revealed no significant differences, except that the effect of BIC+STRY was significantly greater than BIC in type I/E units (Fig. 8C, bottom). In part, this was due to the high variability in drug effect across units (e.g., Fig. 8A). In addition, the small sample sizes for type E/I and I/E precluded a robust analysis.
There are nonetheless three noteworthy observations regarding drug effects that suggest further distinctions within the population. First, in all units for which drug application eliminated inhibition (n = 7), the inhibition was tuned in the 23-30 kHz range. Second, among I/E units, the effect of STRY and BIC+STRY was very strong and greater than BIC in every case but one unusual unit tested with STRY (Fig. 8C). Third, STRY appeared to have the dominant effect on later inhibition in type I/E units.
Duration of inhibition. Data from units shown in Figures 5B and 6A suggest that inhibition within the IC may extend the duration of low frequency inhibition to longer delays, since drug application reduced the delay width in these units. To evaluate changes in the duration of inhibition (delay width) due to application of the drugs, we pooled data from both type I units and type I/E units (early inhibition only). Application of BIC significantly reduced the delay width for the population (Fig. 8D). However, application of STRY alone or together with BIC did not alter the duration of inhibition at short delays (Fig. 8D). Units displayed substantial individual differences in whether inhibitory input at the IC could affect the duration of low frequency inhibition.
Best delay of inhibition. There was no significant drug-related change in the best delay of inhibition across the different types of units. In the few units for which the best delay changed, the change was 2 or 3 ms, i.e., the minimum step size used in our delay tests.
Excitatory Responses. Drug application increased the response rate to BF signals but had very small effects on BF response latency. Thus, For STRY and BIC+STRY, there were no significant changes in BF latency. For BIC, there was only a very small but significant decrease in latency to the BF signal (n = 51, control: 8.7 ± 0.3 ms, BIC: 8.3 ± 0.3 ms, p <0.01, paired t test).
For E/I units, application of BIC uniformly increased low frequency response rates while STRY did so in three of four units (Fig. 9A). Neither BIC nor STRY significantly changed the latency of low frequency responses across the sample. For I/E units, BIC significantly increased low frequency response rates, but STRY and BIC+STRY had more varied effects (Fig. 9B). Nonetheless, low frequency responsiveness was not eliminated by drug application. The latency of the low frequency response was not altered significantly by BIC or STRY, but was reduced by BIC+STRY (Fig. 9C,D). Although the small samples sizes limit our conclusions, it is noteworthy that drug application failed to eliminate the low frequency excitation in I/E units. While many features of these I/E responses are consistent with an excitatory rebound from inhibition, our results indicate that these interactions do not occur in the IC through glycine or GABAA receptors.
Fig. 9.

Effect of drugs on low frequency excitatory responses. Only BIC significantly increased response rates. Only BIC+STRY significantly reduced response latency (in I/E units). See Fig. 8 legend for description of symbols.
Transformation of types. We examined whether application of STRY, BIC or BIC+STRY changed the inhibitory interaction from one type to another. In two units, application of BIC transformed type I inhibitory interactions to type E/I, but no other changes were observed.
DISCUSSION
Responses to spectrally complex acoustic signals can be influenced by signal energy well outside the excitatory frequency-tuning curve of a neuron, providing the basis for analyses of the spectral content of sounds. In this study, we found that about 40% of tested units in the mustached bat’s IC showed a particular form of spectral integration that we have termed inhibitory combination sensitivity: the response to BF tones was inhibited by a second, much lower frequency tone presented in a specific temporal relationship. Based on the presence and timing of excitatory responses to the low frequency sound, inhibitory combinatorial neurons were of three types: I, E/I, and I/E. Some of the types differed in the tuning of the low frequency sounds (<23 kHz vs. >23 kHz), the strength of interactions, the threshold of interactions, and the timing of interactions. These diverse features of combination-sensitive inhibition provide a flexible strategy for the analysis of spectrally and temporally complex sounds.
We further showed that low frequency inhibition was only rarely eliminated by pharmacological blockade of glycine and GABAA receptors, across all types of inhibitory combinatorial interactions. This suggests that most IC neurons display low frequency-tuned inhibitory interactions that originate below the IC. However, since the strength of inhibition in many neurons was reduced by application of the receptor antagonists, there is probably additional low frequency inhibitory input onto high frequency neurons in the IC. The results suggest that integration of widely separated spectral components begins in the auditory brainstem and may continue in the IC, apparently depending on multiple interactions throughout the ascending auditory pathway.
Functional properties of inhibitory combination-sensitive neurons
Previous studies of the mustached bat’s IC emphasized inhibitory combination-sensitive neurons in which inhibition was tuned to frequencies corresponding to the first sonar harmonic (O’Neill, 1985; Mittmann and Wenstrup, 1995; Portfors and Wenstrup, 1999). Although some reports had described additional neurons with inhibition tuned outside of sonar bands (Mittmann and Wenstrup, 1995; Portfors and Wenstrup, 1999, Leroy and Wenstrup, 2000), the present study shows extensive low frequency inhibition among high BF neurons, tuned to a broad range of frequencies in the lower part of the animal’s audible range. In addition, the present study shows that low frequency inhibition is accompanied by excitation in nearly a third of combination-sensitive inhibitory neurons. The relative timing of the excitation and inhibition is characteristic for neurons tuned to particular frequency ranges and should have important functional consequences for these populations.
Type I responses, characterized by tuned low frequency suppression of a higher BF response and by the lack of low frequency excitation, are the most common in the mustached bat’s IC. The best inhibition is tuned to frequencies from 12-41 kHz, a fairly broad range that encompasses the dominant formants in mustached bat social vocalizations (Kanwal et al., 1994) as well as the first harmonic of the biosonar call (23-30 kHz). There are some differences within this population based on frequency tuning. Thus, neurons with inhibition tuned below 23 kHz have stronger inhibition but higher thresholds. The higher thresholds are a direct reflection of the sharply elevated thresholds observed in cochlear nucleus neurons tuned below 23 kHz (Marsh et al., 2006). However, the present study reveals no differences in the timing of inhibition. Independent of frequency tuning, the inhibition is strongest when the BF and inhibitory signals are presented simultaneously, i.e., when the latencies of low frequency inhibition and BF excitation are the same.
In general terms, these type I inhibitory interactions contribute to analyses of complex signals by limiting responsiveness in the presence of particular spectro-temporal elements in sounds. In the population studied here, the inhibitory vocal element should occur simultaneously with other elements in order to maximally suppress a response. However, differences in the duration of the inhibition for a sustained signal may further enhance response selectivity. Although this study identified no other temporal properties that distinguish these neural populations on the basis of frequency tuning, preliminary work suggests that type I units tuned below 23 kHz generally display sustained inhibition, while those tuned in the 23-30 kHz range generally show phasic inhibition (Gans et al., 2004). Sustained inhibition would appear to be more appropriate for the longer signals used in social vocalizations.
The inhibitory properties of type I neurons tuned to 23-30 kHz are virtually identical to some features of many facilitated combination-sensitive neurons in the mustached bat’s IC. These facilitated neurons show “early inhibition”, in which a low frequency signal in the 23-30 kHz range suppresses the BF response at delays near 0 ms, but then facilitates it as the BF signal is delayed further (Portfors and Wenstrup, 1999; Nataraj and Wenstrup, 2005). Between these two populations, we found no significant differences in the strength, duration, or best delay of the inhibition. This suggests that neurons with type I responses, either in the IC or auditory brainstem (see next section), may provide a dominant excitatory input to facilitated combination-sensitive IC neurons that display low frequency inhibition at 0 ms delay (Nataraj and Wenstrup, 2005).
For type I inhibitory neurons and the facilitated neurons with early inhibition, the 23-30 kHz inhibition may have a specific role in the analysis of sonar echoes: suppression of responses to the emitted signal. In emitted sonar signals, the first harmonic (23-30 kHz) is sufficiently intense to activate this inhibition, thus suppressing the response to simultaneously occurring higher harmonic elements of the emitted sound. In echoes, however, the attenuated first harmonic would be less effective in activating the inhibition, allowing the neuron to respond to the higher harmonic elements to which its excitatory response is tuned. Type I units should respond well at all echo delays greater than a few milliseconds (Fig 10A), permitting an analysis of echo features throughout a bat’s approach to or avoidance of the echo source. In contrast, for delay-tuned units showing facilitated combination sensitivity (Fig. 10C), the facilitation creates responsiveness that is limited to particular delays between the emitted pulse and echo (O’Neill and Suga, 1982; Kawasaki et al., 1988).
Fig. 10.

Comparison of delay sensitivity for type I (A) and I/E (B) inhibitory combination-sensitive neurons and type I/F (C) facilitatory combination-sensitive neurons. Top: delay curves showing response as function of delay of BF signal after low frequency signal. Bottom: Responses to sounds are represented as inhibitory influences (below baseline), excitatory influences (above baseline), and spikes. These influences may originate below the IC and are thus not necessarily inhibitory and excitatory postsynaptic potentials in IC neurons. The temporal features of inhibition, excitation and facilitation create different delay sensitivity functions.
Type I/E neurons show inhibitory low frequency interactions that are similar to type I neurons, particularly in the timing of the onset of inhibition relative to the BF response. In other features, however, they form a more specific group that appears closely related to the analysis of the frequency modulated (FM) elements of sonar echoes that convey target distance information. Thus, the low frequency inhibition was always tuned to the fundamental FM (FM1) component (23-28 kHz), while the BF response was always tuned to a higher harmonic of the FM sonar component (FMn, n = 2, 3, 4). Among type I/E neurons, the inhibition has lower thresholds, is stronger, and lasts longer than comparably tuned type I neurons. Their low frequency excitation has a latency much longer than the BF latency, but the two excitatory responses add together when they coincide (at BF delays up to 26 ms). At even longer delays, the low frequency signal usually evokes further inhibition. The pattern of inhibition, summation, and inhibition activated by the low frequency FM1 signal (in emitted sonar signals) creates a delay-tuned response to the FMn echo that in some respects mimics what is observed in facilitated combination-sensitive neurons that show early inhibition (cf Figs. 10B, 10C).
Type E/I neurons are distinct from I/E neurons in almost every feature, but show similarity to some type I neurons. The low frequency inhibition is almost always tuned below 23 kHz and has a relatively high threshold. As in type I units tuned below 23 kHz, the thresholds of inhibition in type E/I units appear to result from sharply higher thresholds to these frequencies in the cochlear nucleus or cochlea (Marsh et al., 2006). For all type E/I units, the BF response is tuned near 60 kHz and 90 kHz, frequencies to which the cochlea displays sharp tuning (Pollak et al., 1979; Frank and Kössl, 1995). It is possible that the low frequency excitation and suppression are related to cochlear mechanisms that create the sharp tuning near 60 and 90 kHz. Whatever the origin, the mechanism is clearly different from type I/E responses since these never occlude the BF response.
In E/I units, low frequency excitation occurs at slightly shorter latencies than high frequency responses and it occludes or blocks the excitatory BF response. As a result, when the low and high frequency spectral elements occur simultaneously, the unit discharges preferentially to the low frequency spectral element only. When the higher frequency element is delayed, occurring after the low frequency signal has ended, low frequency inhibition continues to suppress the response to the higher frequency signal. In this way, some neurons in the greatly expanded ∼60 kHz representation of the IC may analyze social vocalizations with energy in the frequency range below 23 kHz, the dominant range in social vocalizations (Sheykholeslami et al. 2004). However, they would also be expected to perform fine frequency analysis of ∼60 kHz echoes of the second harmonic constant frequency element of sonar echoes. The presence of energy below 23 kHz, energy that can evoke suppression of the ∼60 kHz response, will determine which type of analysis they will perform. Such IC neurons are truly “multi-functional” or “context dependant” in their analysis of complex acoustic signals, similar to neurons in auditory cortex (Ohlemiller et al., 1996; Razak et al., 1999).
Origin of inhibitory combination sensitivity
In the vast majority of tested units, inhibitory interactions were not eliminated by application of GABAA and/or glycine receptor blockers. One concern is that we may not have applied sufficiently high currents in order to block low frequency inhibition completely. While this is possible in some cases, our methods involved increasing both current and duration of drug application until effects stabilized. Moreover, even the combined application of BIC and STRY only rarely eliminated the inhibitory low frequency interaction. Other observations also suggest that drug application procedures were not responsible for the failure to eliminate combination-sensitive inhibition. Thus, drug application always had some effect on unit responses, even though it did not usually eliminate the low frequency inhibition. Further, the results agree closely with our study of facilitatory combination-sensitive IC neurons, many of which also show inhibitory combinatorial interactions (Nataraj and Wenstrup, 2005). In that study, we found that neither GABAA nor glycine receptor blockade eliminated combination-sensitive inhibition near 0 ms delay, even though glycine receptor blockade almost always removed facilitatory interactions. Across both of these studies, the same strychnine application currents that eliminated facilitatory interactions only rarely eliminated inhibitory interactions. These combined results suggest that inhibitory combination-sensitive properties of IC neurons in the mustached bat depend at least partly on interactions that arise in brainstem auditory nuclei. Many IC neurons, in turn, inherit the inhibitory combination-sensitive response property from the excitatory projections of these brainstem nuclei.
Evidence from recordings in auditory brainstem nuclei support this conclusion, and further provide evidence that the differences in response properties identified here are related to distinct origins within the auditory brainstem. In the cochlear nucleus (CN), about 20% of neurons showed type I responses, with some additional type E/I units (Marsh et al., 2006). Nearly all of these inhibitory responses were tuned to 10-22 kHz. This suggests that the CN, or possibly the cochlea, is the source of low frequency inhibition/suppression tuned below 23 kHz. In contrast, combination-sensitive inhibition tuned to 23-30 kHz occurs in lateral lemniscal nuclei but is rare in CN. In our initial report on NLL (Portfors and Wenstrup, 2001), only inhibition tuned to 23-30 kHz was described in NLL, and limited to the intermediate nucleus (INLL). About 17% of INLL neurons displayed such responses. In subsequent studies that are preliminary, we find more inhibitory units of all types, but have been able to eliminate the inhibition only in type I or I/E units tuned in the range 23-30 kHz (Nataraj and Wenstrup, 2004). This suggests that inhibition tuned in the range 23-30 originates in NLL. However, since some NLL neurons show inhibition tuned below 23 kHz, the excitatory projections from NLL to IC provide a broad range of inhibitory combinatorial properties to IC neurons that receive their excitatory inputs. This interpretation and our current results do not exclude that other regions, such as the superior olivary complex, may contribute to these integrative responses.
The loss of combination-sensitive inhibition in some type I and I/E neurons, during drug application, suggests that low-frequency tuned inhibition terminates on some high-frequency tuned IC neurons. Moreover, even though the drugs did not eliminate combinatorial inhibition in most IC neurons, the inhibition was reduced by a substantial amount (⩾20%) in over half the units. One explanation is that a low-frequency tuned inhibitory input synapses onto IC inhibitory combination-sensitive neurons to either create or enhance the IC neuron’s combination-sensitive inhibitory response. If so, the combination-sensitive inhibition in the IC is the result of multiple spectral integrative events in the auditory brainstem and IC. A second possibility is that the inhibitory combination-sensitive response features of the IC neuron are inherited from one dominant excitatory brainstem input, while other excitatory inputs do not show the inhibitory interaction. In this scenario, blockade of glycine and GABAA receptors on the IC neurons may alter the relative effectiveness of these inputs, resulting in stronger dominance by brainstem inputs not showing the combination-sensitive inhibition. If so, the expression of combination-sensitive inhibition among IC neurons depends on the balance of multiple excitatory inputs with different response properties. In either case, the combination-sensitive inhibition displayed by IC neurons depends on integration of multiple inputs at the level of the IC.
Inhibitory spectral interactions and the analysis of complex sounds in the ascending auditory system
The present work shows that many neurons in the mustached bat’s IC display inhibition tuned to frequencies distant from the neurons’ best excitatory frequencies. These inhibitory interactions are of different types, and are often specific for particular, behaviorally relevant, frequency bands. Their origins appear to be mostly in regions below the IC, and these origins may be different for particular spectral interactions. The integration that occurs at the IC is clearly significant, but there are likely to be further integrative events as information ascends to auditory cortex. One may relate to increasing complexity of spectral inhibition. For instance, Kanwal et al. (1999) describe multiple inhibitory areas for neurons in AI of the mustached bat auditory cortex. Since our focus was on the temporal effects of the best inhibitory frequency, we did not describe all the inhibitory frequency bands that occur in IC neurons, and so cannot assess whether there is further elaboration of these areas between IC and auditory cortex. However, we would expect that more detailed study of the spectral features of inhibition in IC neurons would show inhibitory effects approaching the cortical response, since sideband inhibition (Yang et al., 1992) and multi-peaked distant inhibition (Sheykholeslami et al., 2005) are features of the mustached bat IC. Studies in other species have suggested that distant spectral inhibition may show little increase in complexity beyond the IC (Poirier et al., 2003), become more complex throughout the ascending auditory pathway (Sutter et al., 1999), or arise primarily in AI (Kadia and Wang, 2003).
While evidence showing increasing complexity in spectral inhibition beyond the IC is not well established in mustached bats, there is better evidence that other types of spectral integrative events occur beyond the IC. Thus, only some IC neurons display both facilitative and inhibitory spectral interactions (Portfors and Wenstrup, 1999; Nataraj and Wenstrup, 2005). At levels above the IC (MGB and auditory cortex), purely inhibitory interactions such as type I responses are uncommon (Fitzpatrick et al., 1998; Wenstrup, 1999). Instead, these seem mostly to be incorporated into more complex responses that include both inhibitory and facilitatory spectral interactions (Olsen and Suga, 1991, Edamatsu and Suga, 1993; Kanwal et al., 1999). In other species, distant spectral inhibition is common in AI, but it is often accompanied by either multipeaked excitatory tuning or distant spectral facilitation (Sutter and Schreiner, 1991; Brosch et al., 1999; Brosch and Schreiner, 2000; Sutter et al., 1999; Kadia and Wang, 2003). Across species, these results are consistent with the view that spectrally complex auditory responses are an important feature of processing in the primary auditory pathway and that this spectral complexity arises through specific integrative events mediated by specific auditory nuclei in the ascending pathway. Functionally, the inhibitory interactions described here may contribute to a broad range of analyses, contributing to sound localization (Imig et al., 1997), biosonar (Olsen and Suga, 1991; Portfors and Wenstrup, 1999; this study) and social communication (Rauschecker et al., 1995; Portfors 2004).
Acknowledgement
We thank Don Gans for software, Carol Grose for technical assistance, and Alex Galazyuk for comments on the manuscript. We are grateful to the Wildlife Section of the Ministry of Agriculture, Land and Marine Resources of Trinidad and Tobago for permission to export bats. This work was supported by research grant RO1 DC 00937 (J.J.W.) from the National Institute on Deafness and Other Communication Disorders of the U.S. Public Health Service.
Address for reprints and correspondence: J Wenstrup, Dept. of Neurobiology, Northeastern Ohio Universities College of Medicine, 4209 State Route 44, P.O. Box 95, Rootstown, OH 44272-0095. E-mail: jjw@neoucom.edu. Current address of K. Nataraj: Department of Biology, Brandeis University, 415 South St., Waltham, MA 02454.
REFERENCES
- Brosch M, Schreiner CE. Sequence sensitivity of neurons in cat primary auditory cortex. Cereb Cortex. 2000;10:1155–1167. doi: 10.1093/cercor/10.12.1155. [DOI] [PubMed] [Google Scholar]
- Brosch M, Schulz A, Scheich H. Processing of sound sequences in macaque auditory cortex: response enhancement. J Neurophysiol. 1999;82:1542–1559. doi: 10.1152/jn.1999.82.3.1542. [DOI] [PubMed] [Google Scholar]
- Edamatsu H, Suga N. Differences in response properties of neurons between two delay-tuned areas in the auditory cortex of the mustached bat. J Neurophysiol. 1993;69:1700–1712. doi: 10.1152/jn.1993.69.5.1700. [DOI] [PubMed] [Google Scholar]
- Fitzpatrick DC, Suga N, Olsen JF. Distribution of response types across entire hemispheres of the mustached bat’s auditory cortex. J Comp Neurol. 1998;391:353–365. [PubMed] [Google Scholar]
- Frank G, Kössl M. The shape of 2f1-f2 suppression tuning curves reflects basilar membrane specializations in the mustached bat, Pteronotus parnellii. Hear Res. 1995;83:151–160. doi: 10.1016/0378-5955(94)00197-x. [DOI] [PubMed] [Google Scholar]
- Fuzessery ZM, Feng AS. Mating call selectivity in the thalamus and midbrain of the leopard frog (Rana p. pipiens): Single and multiunit analyses. J Comp Physiol A. 1983;150:333–344. [Google Scholar]
- Gans D, Sheykholeslami K, Wenstrup JJ. Duration dependence of low frequency inhibition among neurons in the inferior colliculus of the mustached bat. Twenty-seventh Midwinter Meeting of the Association for Research in Otolaryngology; 2004. [Google Scholar]
- Havey DC, Caspary DM. A simple technique for constructing ’piggy-back’ multibarrel microelectrodes. Electroencephalogr Clin Neurophysiol. 1980;48:249–251. doi: 10.1016/0013-4694(80)90313-2. [DOI] [PubMed] [Google Scholar]
- Imig TJ, Poirier P, Irons WA, Samson FK. Monaural spectral contrast mechanism for neural sensitivity to sound direction in the medial geniculate body of the cat. J Neurophysiol. 1997;78:2754–2771. doi: 10.1152/jn.1997.78.5.2754. [DOI] [PubMed] [Google Scholar]
- Kadia SC, Wang X. Spectral integration in A1 of awake primates: neurons with single- and multipeaked tuning characteristics. J Neurophysiol. 2003;89:1603–1622. doi: 10.1152/jn.00271.2001. [DOI] [PubMed] [Google Scholar]
- Kanwal JS, Fitzpatrick DC, Suga N. Facilitatory and inhibitory frequency tuning of combination-sensitive neurons in the primary auditory cortex of mustached bats. J Neurophysiol. 1999;82:2327–2345. doi: 10.1152/jn.1999.82.5.2327. [DOI] [PubMed] [Google Scholar]
- Kanwal JS, Matsumura S, Ohlemiller K, Suga N. Analysis of acoustic elements and syntax in communication sounds emitted by mustached bats. J Acoust Soc Am. 1994;96:1229–1254. doi: 10.1121/1.410273. [DOI] [PubMed] [Google Scholar]
- Kawasaki M, Margoliash D, Suga N. Delay-tuned combination-sensitive neurons in the auditory cortex of the vocalizing mustached bat. J Neurophysiol. 1988;59:623–635. doi: 10.1152/jn.1988.59.2.623. [DOI] [PubMed] [Google Scholar]
- Leroy SA, Wenstrup JJ. Spectral integration in the inferior colliculus of the mustached bat. J Neurosci. 2000;20:8533–8541. doi: 10.1523/JNEUROSCI.20-22-08533.2000. [DOI] [PMC free article] [PubMed] [Google Scholar]
- Margoliash D, Fortune ES. Temporal and harmonic combination-sensitive neurons in the zebra finch’s HVc. J Neurosci. 1992;12:4309–4326. doi: 10.1523/JNEUROSCI.12-11-04309.1992. [DOI] [PMC free article] [PubMed] [Google Scholar]
- Marsh RA, Nataraj K, Gans D, Portfors CV, Wenstrup JJ. Auditory responses in the cochlear nucleus of awake mustached bats: Precursors to spectral integration in the auditory midbrain. J Neurophysiol. 2006;95:88–105. doi: 10.1152/jn.00634.2005. [DOI] [PMC free article] [PubMed] [Google Scholar]
- Mittmann DH, Wenstrup JJ. Combination-sensitive neurons in the inferior colliculus. Hear Res. 1995;90:185–191. doi: 10.1016/0378-5955(95)00164-x. [DOI] [PubMed] [Google Scholar]
- Nataraj K, Wenstrup JJ. Inhibitory combinatorial interactions in nuclei of the lateral lemniscus: Physiological response features and roles of glycinergic and GABAergic inhibition. Soc Neurosci. 2004;30:304–314. [Google Scholar]
- Nataraj K, Wenstrup JJ. Roles of inhibition in creating complex auditory responses in the inferior colliculus: facilitated combination-sensitive neurons. J Neurophysiol. 2005;93:3294–3312. doi: 10.1152/jn.01152.2004. [DOI] [PubMed] [Google Scholar]
- Ohlemiller KK, Kanwal JS, Suga N. Facilitative responses to species-specific calls in cortical FM-FM neurons of the mustached bat. Neuroreport. 1996;7:1749–1755. doi: 10.1097/00001756-199607290-00011. [DOI] [PubMed] [Google Scholar]
- O’Neill WE. Responses to pure tones and linear FM components of the CF-FM biosonar signal by single units in the inferior colliculus of the mustached bat. J Comp Physiol A. 1985;157:797–815. doi: 10.1007/BF01350077. [DOI] [PubMed] [Google Scholar]
- O’Neill WE, Suga N. Encoding of target range and its representation in the auditory cortex of the mustached bat. J. Neurosci. 1982;2:17–31. doi: 10.1523/JNEUROSCI.02-01-00017.1982. [DOI] [PMC free article] [PubMed] [Google Scholar]
- Olsen JF, Suga N. Combination-sensitive neurons in the medial geniculate body of the mustached bat: Encoding of target range information. J Neurophysiol. 1991;65:1275–1296. doi: 10.1152/jn.1991.65.6.1275. [DOI] [PubMed] [Google Scholar]
- Poirier P, Samson FK, Imig TJ. Spectral shape sensitivity contributes to the azimuth tuning of neurons in the cat’s inferior colliculus. J Neurophysiol. 2003;89:2760–2777. doi: 10.1152/jn.00640.2002. [DOI] [PubMed] [Google Scholar]
- Pollak GD, Henson OW, Jr., Johnson R. Multiple specializations in the peripheral auditory system of the CF-FM bat, Pteronotus parnellii. J Comp Physiol. 1979;131:255–266. [Google Scholar]
- Portfors CV. Combination sensitivity and processing of communication calls in the inferior colliculus of the Moustached Bat Pteronotus parnellii. An Acad Bras Cienc. 2004;76:253–257. doi: 10.1590/s0001-37652004000200010. [DOI] [PubMed] [Google Scholar]
- Portfors CV, Wenstrup JJ. Delay-tuned neurons in the inferior colliculus of the mustached bat: implications for analyses of target distance. J Neurophysiol. 1999;82:1326–1338. doi: 10.1152/jn.1999.82.3.1326. [DOI] [PubMed] [Google Scholar]
- Portfors CV, Wenstrup JJ. Responses to combinations of tones in the nuclei of the lateral lemniscus. J Assoc Res Otolaryngol. 2001;2:104–117. doi: 10.1007/s101620010057. [DOI] [PMC free article] [PubMed] [Google Scholar]
- Rauschecker JP, Tian B, Hauser M. Processing of complex sounds in the macaque nonprimary auditory cortex. Science. 1995;268:111–114. doi: 10.1126/science.7701330. [DOI] [PubMed] [Google Scholar]
- Razak KA, Fuzessery ZM, Lohuis TD. Single cortical neurons serve both echolocation and passive sound localization. J Neurophysiol. 1999;81:1438–1442. doi: 10.1152/jn.1999.81.3.1438. [DOI] [PubMed] [Google Scholar]
- Sheykholeslami K, Gans D, Portfors C, Wenstrup J. Representation of species-specific vocalizations in the inferior colliculus of the mustached bat. Soc Neuroscience Abstr. 2004;30 Program No. 305.12. [Google Scholar]
- Sheykholeslami K, Gans D, Wenstrup JJ. Multiple low-frequency inputs to combination-sensitive neurons as recorded by single- and multiple-channel electrodes from the mustached bat inferior colliculus. Twenty-eighth Midwinter Meeting of the Association for Research in Otolaryngology; 2005. [Google Scholar]
- Suga N, O’Neill WE, Manabe T. Cortical neurons sensitive to combinations of information-bearing elements of biosonar signals in the mustache bat; Science; 1978. pp. 778–781. [DOI] [PubMed] [Google Scholar]
- Sutter ML, Schreiner CE. Physiology and topography of neurons with multipeaked tuning curves in cat primary auditory cortex. J Neurophysiol. 1991;65:1207–1226. doi: 10.1152/jn.1991.65.5.1207. [DOI] [PubMed] [Google Scholar]
- Sutter ML, Schreiner CE, McLean M, O’Connor KN, Loftus WC. Organization of inhibitory frequency receptive fields in cat primary auditory cortex. J Neurophysiol. 1999;82:2358–2371. doi: 10.1152/jn.1999.82.5.2358. [DOI] [PubMed] [Google Scholar]
- Wenstrup JJ. Frequency organization and responses to complex sounds in the medial geniculate body of the mustached bat. J Neurophysiol. 1999;82:2528–2544. doi: 10.1152/jn.1999.82.5.2528. [DOI] [PubMed] [Google Scholar]
- Yang L, Pollak GD, Resler C. GABAergic circuits sharpen tuning curves and modify response properties in the mustache bat inferior colliculus. J Neurophysiol. 1992;68:1760–1774. doi: 10.1152/jn.1992.68.5.1760. [DOI] [PubMed] [Google Scholar]