Abstract
Intersubject variability in perception is a prominent characteristic of people with cochlear implants. This study characterized intersubject differences using simple metrics based on psychophysical measures: maximum comfortable loudness levels (C levels) and dynamic ranges (DRs). In a group of 17 subjects, we assessed across-site variation (ASV) and across-site mean (ASM) values of C levels and DRs for bipolar (BP) and monopolar (MP) stimulation, and examined the relation of these metrics to speech recognition across subjects. Significant negative correlations with speech recognition were found for ASVs of C levels for BP stimulation; i.e., subjects with high ASVs of BP C levels had poor speech recognition. Positive correlations with speech recognition were found for ASMs of C levels and ASMs of DRs for both BP and MP stimulation; i.e., subjects with high mean C levels and large mean DRs had better speech recognition. Thus, these psychophysical metrics are effective for diagnosis of individual differences in performance of subjects with cochlear implants. Furthermore, they point to some potentially useful treatment procedures.
Keywords: Auditory prosthesis, Cochlear implant, Speech recognition, Across-site variation, C level, T level, Dynamic range
Introduction
Intersubject variability in speech recognition performance is a persistent characteristic of cochlear implant users, despite significant improvements in average performance over the last two decades. This study is one of a series of studies assessing simple psychophysical measures that may help with diagnosis of conditions in the implanted subjects that contribute to this intersubject variability. Such measures are needed for guiding treatment of individual problems in performance of cochlear implants. In a previous study [Pfingst et al., 2004], we found that variances of psychophysical detection thresholds (T levels) across all sites in a subject’s scala tympani electrode array were moderately, but significantly correlated with speech recognition performance. In the study reported here, we examined suprathreshold measures: maximum comfortable loudness levels (C levels) and dynamic ranges (DRs). Because most speech information delivered by cochlear implants is at suprathreshold levels and speech recognition generally improves as a function of level [Franck et al., 2002], we reasoned that psychophysical responses to suprathreshold stimuli might be more strongly correlated with speech recognition than measures taken just at the threshold level.
T level and C level data are commonly obtained in the clinic in order to program a speech processor to operate within the DR of the subject’s hearing with electrical stimulation. Variability of these measures across all available stimulation sites in the implant (across-site variation, abbreviated ASV) and mean levels of these measures averaged over all available stimulation sites in the implant (across-site mean, abbreviated ASM) are two potentially useful metrics that are easily derived from these data. In the previous study mentioned above [Pfingst et al., 2004], we found that ASV of T levels was significantly correlated with speech recognition performance but that ASM of T levels was not. In the current experiment, these two metrics (ASV and ASM) were applied to C level and DR data. We also examined two stimulation modes: monopolar (MP) and narrowly spaced longitudinal bipolar (BP) stimulation. These modes represent two extremes of the range of electrode configurations available in most current commercially available cochlear implants. Although ASV of T levels for MP stimulation is typically much smaller than that for BP stimulation [Pfingst and Xu, 2004], we previously found that ASVs of T levels for both configurations were significantly correlated with speech recognition [Pfingst et al., 2004].
The working model guiding the studies of ASV is that ASV of T and C levels is due in part to variation from one stimulation site to another in the lengths of the current paths from the electrodes to the sites of action potential initiation, and that large variation in the lengths of these current paths reflects conditions that are not compatible with good speech recognition. Variation in the electrode-to-neuron distances can result from variation in nerve survival, variation in the presence of new bone or other obstructions in the current paths from electrodes to neurons, and/or variation in the medial-lateral location of electrodes within the scala tympani. Longer current paths result in higher thresholds because current potential decreases as a function of distance from the electrodes. Conditions of nerve survival or physical conditions that lead to long electrode-to-neuron distances and relatively high T levels would be expected to result in distortions in the place-pitch map because currents would excite neurons that were distant from the intended targets. If sufficiently large, such distortions could degrade speech recognition [Shannon et al., 1998, 2002]. In addition, variation in the distances between electrodes and neurons could lead to variation in the number of neurons activated by a given stimulation site [Frijns et al., 1995] and the resulting variation in bandwidth from channel to channel might degrade speech recognition. Finally, the temporal pattern of neural responses to electrical stimulation can be affected by electrode-to-neuron distances [Mino et al., 2004]. Variation in the timing of neural responses across stimulation sites could result in abnormal variation in envelope information from site to site along the electrode array, which could be disruptive to processes that require comparison of envelope information across channels.
Sites of action potential initiation for cochlear implants are expected to vary as a function of stimulus level [van den Honert and Stypulkowski, 1984] and as a function of electrode configuration [Miller et al., 2003]. Thus, while we would expect variability in biophysical and physiological conditions in the implanted cochlea to be reflected in ASV of both T and C levels for both MP and BP electrode configurations, the pattern of variation across stimulation sites might not be the same from condition to condition because of differences in the sites of action potential initiation. Thus, the effectiveness of psychophysical metrics for reflecting the condition of the implanted cochlea might vary as a function of stimulus parameters. This possibility was assessed in the current experiment by comparing correlations of speech recognition and ASVs of C levels with those of T levels and by comparing data obtained with BP and MP electrode configurations.
In addition to variation in T and C levels across stimulation sites within subjects, we have noted considerable variation across subjects in ASMs of T and C levels for the entire electrode array [Pfingst and Xu, 2004]. We assume that these ASMs of T and C values reflect the overall condition of the entire region of the cochlea that is stimulated by the full electrode array. In our previous study, we found that ASMs of T levels for BP or MP stimulation did not correlate with speech recognition. On the other hand, a few investigators have found that ASMs of DRs do correlate with speech recognition across subjects [Blamey et al., 1992; Donaldson and Nelson, 2000; Kuk et al., 1990]. In this study, we examined within- and across-subject variation in DR and the individual contributions of T levels and C levels to that variation.
This study used 17 of the subjects who participated in the previous study of ASV of T levels [Pfingst et al., 2004]. This allowed us to test the consistency of the ASV data for T levels over a relatively long interval (averaging 8.9 months).
Methods
Subjects
This report is based on data from the 17 postlingually deaf adult subjects with Nucleus® CI24R(CS) (Contour™) implants or Nucleus CI24M (straight array) implants. All subjects spoke American English as their native language and all were experienced with the T level and C level testing procedures. In a related previous study on the relation between speech recognition and ASV of T levels [Pfingst et al., 2004], we tested 21 subjects which included the 17 tested in the study reported here. For the study reported here, we obtained estimates of C levels and new estimates of T levels, but we used the speech recognition data that had been collected for the previous study. Details for the subjects are reported in table 1 of Pfingst et al. [2004]. The 4 subjects from that study who did not participate in the current experiment were subjects S10, S11, S14 and S20. The use of human subjects in this research was reviewed and approved by the University of Michigan Medical School Institutional Review Board.
Table 1.
Correlations of ASV for C levels and T levels with three measures of speech recognition
| Speech test | Psychophysical measure | BP configuration | MP configuration |
|---|---|---|---|
| Consonants | ASV of C levels | −0.60 | −0.47 |
| ASV of T levels | −0.57 | −0.82 | |
| Vowels | ASV of C levels | −0.60 | −0.15 |
| ASV of T levels | −0.57 | −0.81 | |
| HINT sentences (+10 dB S/N) | ASV of C levels | −0.56 | −0.42 |
| ASV of T levels | −0.56 | −0.72 |
The r values in italics indicate that the correlations are statistically significant (z test; p < 0.05).
Measurements of T and C Levels
For measurements of T and C levels, a laboratory-owned SPrint processor (serial number 408594, Cochlear Corporation, Englewood, Colo., USA) was used. The stimuli were controlled by custom software that generated sequences of frames and sent instructions to the SPrint processor utilizing Nucleus Implant Communicator® (version 3.27) software libraries. The software communicated with the SPrint processor using an IF5 ISA card and a processor control interface (Cochlear Corporation). The custom software also provided an interface that was used to collect the psychophysical responses from the subjects, as detailed below.
The stimuli were symmetric-biphasic pulses with a phase duration of 200 μs presented at a rate of 250 pulses/s. The polarity of the initial phase of each pulse to the scalar electrode in the MP mode or the more basal electrode in the BP mode was negative. The interphase gap was 45 μs. The stimulus burst duration was 500 ms with silent intervals of 500 ms in between bursts. The relatively long pulse duration used in these experiments was chosen to allow us to assess the full DR in the BP configuration, given the compliance limits of the implanted stimulators. In a previous study [Pfingst et al., 2004], we examined effects of pulse duration on across-site threshold variation using phase durations ranging from 25 μs to 1600 μs. We found that in the majority of cases, ASV showed little change as a function of phase duration and that a 200-μs/phase pulse duration gave a reasonable estimate of ASV at other pulse durations.
T and C levels were measured using both BP and MP electrode configurations from all available stimulation sites in the 22-electrode arrays. A stimulation site was defined as the physical location of the intracochlear electrodes. For MP stimulation, there were 22 possible sites and for BP stimulation, there were 21. A few sites in a few subjects were not tested because the sites were not functional or because stimulation at those sites produced uncomfortable sensations. In the MP configuration, stimulation was between an electrode in the scala tympani array and two extracochlear electrodes in parallel (i.e., MP1 + 2). The two extracochlear electrodes comprised a ball electrode buried underneath the temporalis muscle and a plate electrode located on the casing of the implanted receiver/stimulator. In the BP configuration, stimulation was between pairs of adjacent electrodes in the intracochlear array. Spacing between electrodes (center to center) averaged 0.75 mm for CI24M implants and about 0.64 mm for CI24R(CS) implants.
The method of adjustment was used to measure T and C levels. The procedure was similar to that used in fitting implants clinically. In this procedure, the stimuli were presented repeatedly with a 500-ms on/off duty cycle. Arrow keys on the computer screen, controlled by the computer mouse, were used to adjust the level of the current. For these measurements, manufacturer-defined current level programming units (CL units) were used and the subject could increase or decrease the CL in steps of 1 or 5 units by clicking on the appropriate arrow. An increase of 1 CL unit was equivalent to a 0.176-dB increase in current. For measurement of T levels, the subject was instructed to adjust the level of the signal until it was ‘barely audible’. For measurement of C levels, the subject was instructed to adjust the level of the signal until it was ‘at the maximum loudness level that is still comfortable’. The order of T and C level testing for the various stimulation sites and electrode configurations was randomized.
The T and C levels that we measured were initially obtained in CL units. There were 256 steps of CL with CL = 0 corresponding to approximately 10 μA peak and CL = 255 corresponding to approximately 1,750 μA peak. Output of the implanted receiver/stimulators at a given CL varied from stimulator to stimulator over a range of about ±10%. A calibration for each of the subjects’ implanted receiver/stimulators was obtained from Cochlear Corporation. These calibrations were used to calculate stimulation levels in microamperes, as described previously [Pfingst and Xu, 2004]. The stimulation levels in microamperes were then converted to decibel re 1 mA using the formula I (dB) = 20 log[I (μA)/1000 μA].
Two metrics, ASV and ASM, were calculated for C levels, T levels, and DRs for each subject. T and C levels were calculated in decibels re 1 mA peak and DRs (C minus T) were calculated in decibels. ASVs of T levels, C levels and DRs were the variances across all tested stimulation sites in the subject’s electrode array (normally 21 or 22 sites). ASMs of T levels, C levels and DRs were calculated by averaging the T levels, C levels, or DRs across all of the tested stimulation sites in the subject’s electrode array.
Speech Recognition Testing
For speech recognition testing, subjects used their own processors, which were programmed with their normal everyday processing strategies and electrode configurations. The subjects sat in a double-walled sound-attenuating chamber (Acoustic Systems Model RE 242S). Speech recognition test materials were presented from sound files in a desktop computer. The signals were passed through a Rane ME-60 graphic equalizer and a Crown D-75 amplifier and presented through a Tannoy TDC 4A loudspeaker positioned about 1 m away from the subject at about 0° azimuth. The level of presentation was 64 dB(A).
Three tests were used for speech recognition assessment: consonant recognition, vowel recognition, and sentence recognition in background noise. For consonant recognition tests, recordings made by Shannon et al. [1999] of 20 naturally spoken American English consonants in a consonant-/a/context were used: ba, cha, da, fa, ga, ja, ka, la, ma, na, pa, ra, sa, sha, ta, tha, va, wa, ya, and za. Two talkers were used (male No. 3 and female No. 3) for a total of 40 stimuli. For vowel recognition tests, recordings made by Hillenbrand et al. [1995] of 12 naturally spoken American English vowels in an /h/-vowel-/d/context were used: had, hayed, hawed, head, heard, heed, hid, hod, hoed, hood, hud, and who’d. Two male (No. 48 and No. 49) and 2 female (No. 39 and No. 44) talkers were selected from the recordings, giving a total of four sets of natural /h/-vowel-/d/tokens for a total of 48 stimuli. For sentence-in-noise testing, the HINT sentence test created by Nilsson et al. [1994] was used. Lists of 10 sentences each were drawn at random from the 25 lists in the test set. Sentences were presented in speech-shaped noise that matched the spectra of the sentences. The signal-to-noise ratio was +10 dB.
During the tests, subjects were first given a preview of the sounds and then a practice session to familiarize themselves with the tests. Then, each speech recognition test was administered three times. The results of the three tests were averaged to yield speech recognition scores. For the consonant and vowel recognition tests, the stimuli were presented respectively in 20- or 12-alternative forced-choice paradigms. Tokens were presented in random order without replacement. The listeners viewed a screen with the choices listed alphabetically and used a computer mouse to select their responses. For the HINT sentence tests, a different list was used for each of the three administrations of the test. Subjects reported their responses verbally. The sentences were scored based on the percentage of correct words.
Results
ASV of C and T Levels
Figure 1 shows the relationship between ASV of C levels and speech recognition. Subjects with larger ASV of C levels tended to have poorer speech recognition performance. For BP stimulation, there were significant negative correlations between ASV of C levels and consonant, vowel and sentence recognition (z test; p < 0.05). For MP stimulation, the relationships between ASV of C levels and speech recognition showed a tendency toward a negative correlation. However, these correlations were not statistically significant.
Fig. 1.
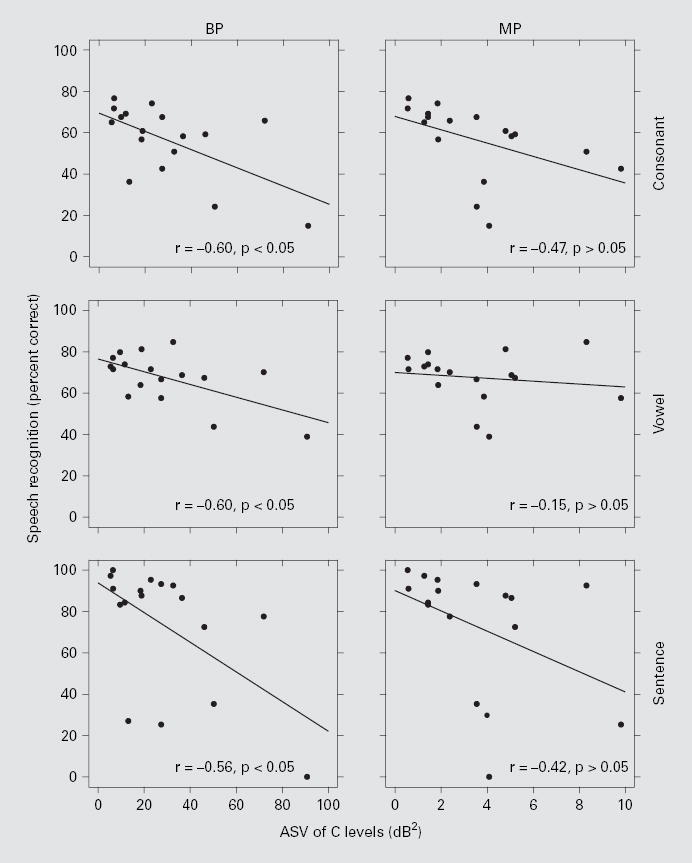
Speech recognition scores as a function of ASV of C levels. Each data point represents 1 of the 17 subjects. ASV is the variance of C levels across all tested stimulation sites in the implant. The left column is for BP stimulation and the right column is for MP stimulation. The three rows, top to bottom, represent the data from consonant, vowel, and HINT sentence (+10 dB S/N) tests, respectively. Linear regression lines are shown with the correlation coefficients (r) indicated at the lower right corner of each panel followed by the results of the z tests. The correlations for BP stimulation were statistically significant (p < 0.05), whereas those for MP stimulation were not (p > 0.05).
A negative correlation between ASV of T levels and speech recognition was reported in our previous study [Pfingst et al., 2004]. In the current study, this analysis was repeated using newly obtained T levels for the 17 subjects. These results are reported in table 1 along with the results for C levels that are illustrated in figure 1. For T levels, ASV was significantly correlated with speech recognition for both BP and MP stimulation, in agreement with the conclusions for the larger population, including these subjects, as reported in the previous paper [Pfingst et al., 2004]. Consistent with the observations reported above, we found a strong significant correlation between ASV of T levels and ASV of C levels for BP stimulation (r = 0.95), but not for MP stimulation (r = 0.35) (see also figure 4 in Pfingst and Xu [2004]).
Fig. 4.
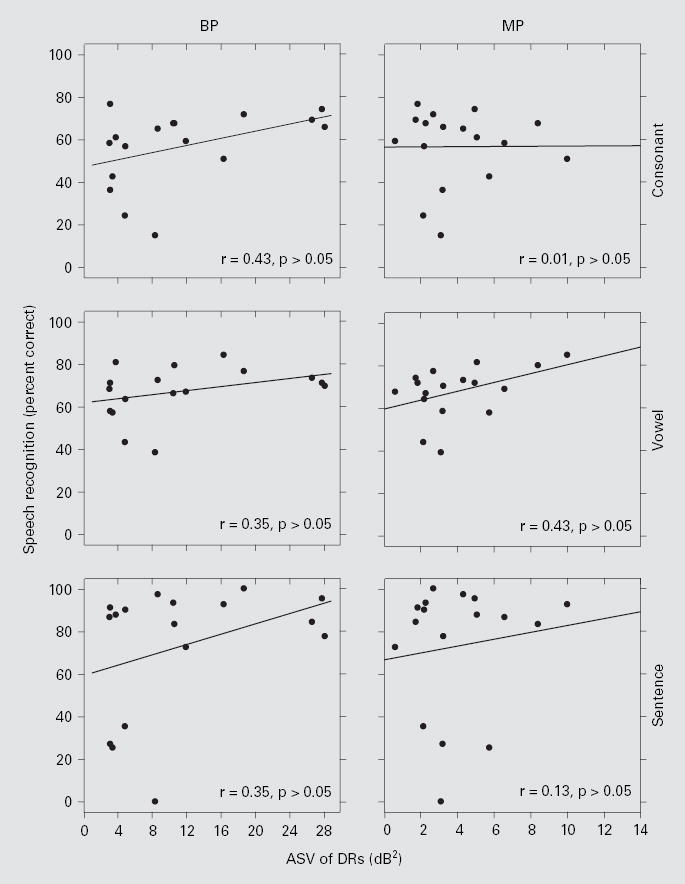
Speech recognition scores as a function of ASV of DR. Each data point represents 1 of the 17 subjects. The left column is for BP stimulation and the right column is for MP stimulation. The three rows, top to bottom, represent the data from consonant, vowel, and HINT sentence (+10 dB S/N) tests, respectively. Linear regression lines are shown with the correlation coefficients (r) indicated at the lower right corner of each panel. None of the r values were statistically significant (z test; p > 0.05).
Consistency over time of ASV of T levels was checked by comparing data obtained in the present study with those obtained in the previously published study. The intervals between data collection for these two studies averaged 8.9 months (SD = 2.5 months) across all subjects. The T level ASV data for these two studies (fig. 2) were highly correlated for BP stimulation (r = 0.95; p < 0.05), suggesting that this measure is quite reliable. For MP stimulation, the correlation was weaker but still statistically significant (r = 0.68; p < 0.05).
Fig. 2.
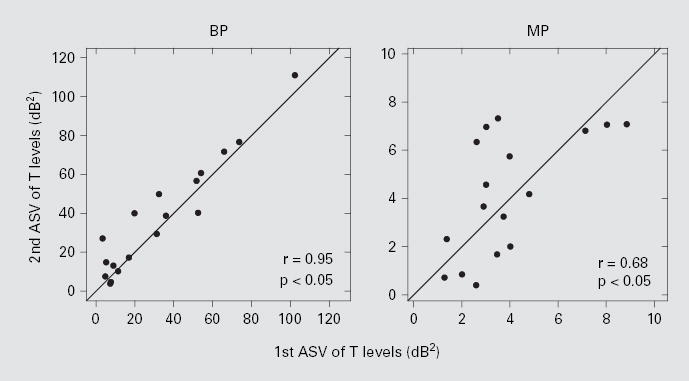
Relationship of the ASV of T levels between the first and the second measurements that spanned an average of 8.9 months. The left and right panels are for BP and MP stimulations, respectively. Both correlation coefficients (r) were statistically significant (z test; p < 0.05).
ASMs of C Levels
ASMs of C levels were significantly correlated across subjects with speech recognition under both BP and MP stimulation (fig. 3). The highest r value was for the correlation between ASMs of C levels for BP stimulation and consonant recognition. This contrasts with our previous finding that ASMs of T levels were not significantly correlated across subjects with speech recognition (figure 5 in Pfingst et al. [2004]), which was confirmed for the 17 subjects in this study.
Fig. 3.
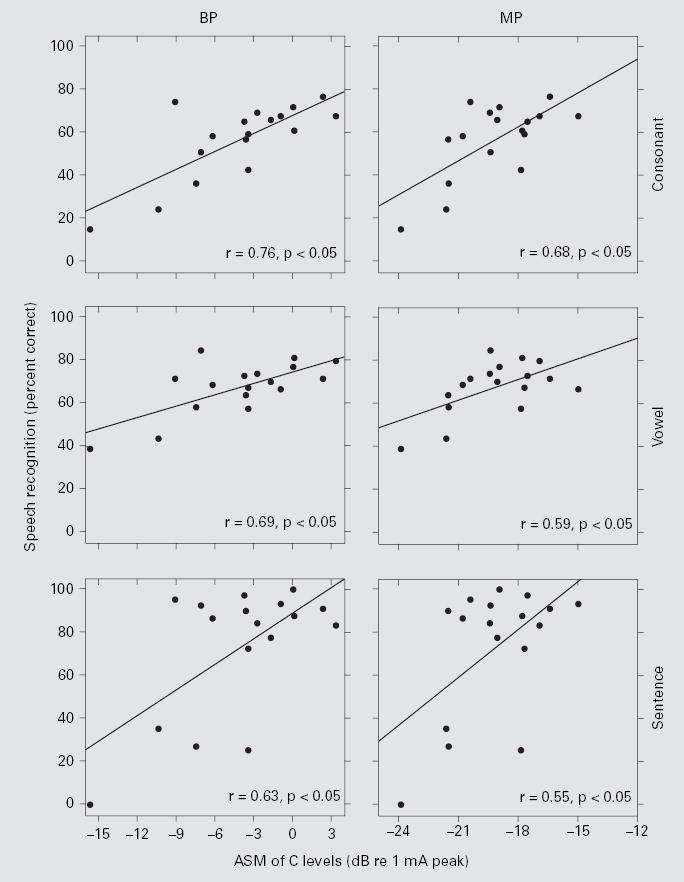
Speech recognition scores as a function of ASM C levels. Each data point represents 1 of the 17 subjects. The left column is for BP stimulation and the right column is for MP stimulation. The three rows, top to bottom, represent the data from consonant, vowel, and HINT sentence (+10 dB S/N) tests, respectively. Linear regression lines are shown with the correlation coefficients (r) indicated at the lower right corner of each panel. All correlations were statistically significant (z test; p < 0.05).
Fig. 5.
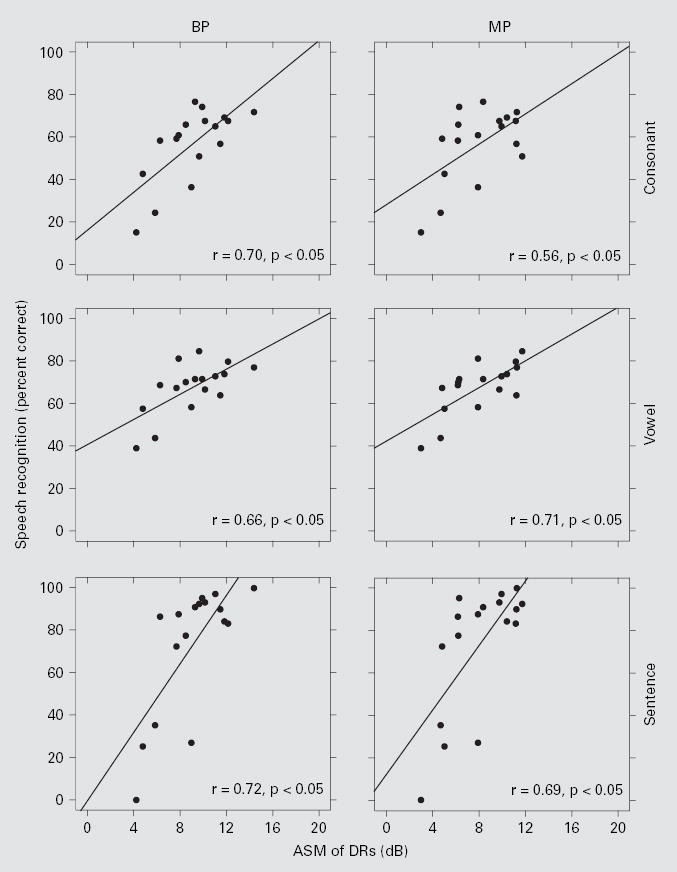
Speech recognition scores as a function of ASM of DR. Each data point represents 1 of the 17 subjects. The left column is for BP stimulation and the right column is for MP stimulation. The three rows, top to bottom, represent the data from consonant, vowel, and HINT sentence (+10 dB S/N) tests, respectively. Linear regression lines are shown with the correlation coefficients (r) indicated at the lower right corner of each panel. All r values were statistically significant (z test; p < 0.05).
Dynamic Ranges
ASV of DRs was not correlated across subjects with speech recognition (fig. 4). However, ASMs of DRs were positively correlated across subjects with speech recognition for both BP and MP stimulation (fig. 5). ASMs of DRs for stimulation with these two electrode configurations were strongly correlated with each other (r = 0.87; p < 0.05), suggesting that both metrics might reflect a common underlying mechanism. ASMs of DR for BP stimulation were a little larger than those for MP stimulation in most (14 out of 17) subjects (fig. 6). The overall mean of the ASMs of DRs across all 17 subjects was significantly larger for BP stimulation (9.1 dB) than for MP stimulation (8.1 dB) (paired t test, p < 0.01).
Fig. 6.
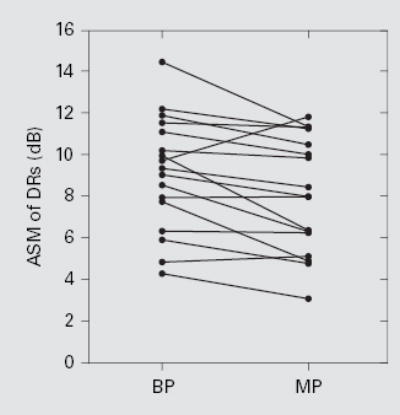
Relationship between ASM of DRs for BP and MP stimulation. Each line represents 1 subject. The overall mean of the ASMs of DRs was 9.1 dB for BP stimulation and 8.1 dB for MP stimulation. The difference was statistically significant (paired t test, p < 0.01).
To determine the relative contributions of ASM of T levels and ASM of C levels to this correlation between DRs and speech recognition, we examined the correlations between T and C levels and DRs across subjects (fig. 7). For MP stimulation, ASMs of T values were negatively correlated with ASMs of DRs, suggesting that subjects with larger DRs for MP stimulation had lower ASMs of T levels. For BP stimulation, there was a positive correlation between ASMs of C levels and DRs, suggesting that subjects with larger DRs for BP stimulation had higher C levels.
Fig. 7.
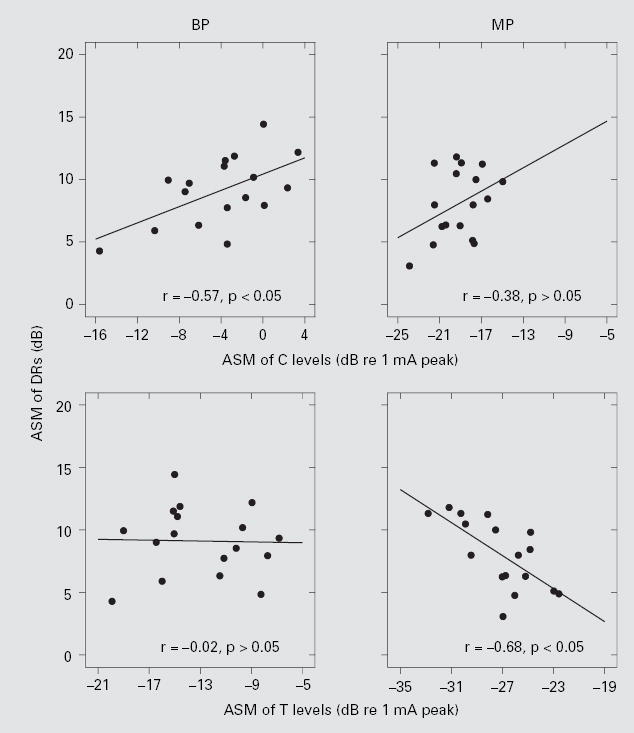
Relationship between ASMs of DRs and C levels (upper panels), and ASMs of DRs and T levels (lower panels). The left column is for BP stimulation and the right column is for MP stimulation. Linear regression lines are shown with the correlation coefficients (r) indicated at the upper right corner of each panel. Only the r values for BP C levels and MP T levels were statistically significant (z test; p < 0.05).
Discussion
This study demonstrated correlations of speech recognition with three metrics: ASV of C levels (negative correlation for BP stimulation), ASM of C levels (positive correlation for BP and MP stimulation) and ASM of DRs (positive correlation for BP and MP stimulation), and it confirmed the previous finding [Pfingst et al., 2004] that ASVs of T levels were correlated with speech recognition (negative correlation for BP and MP stimulation). Thus, subjects with poor speech recognition tended to have high ASVs of T levels for BP and MP stimulation, high ASVs of C levels for BP stimulation, low ASMs of C levels and/ or small ASMs of DRs.
As noted in the Introduction, we expected metrics based on suprathreshold measures to be more strongly correlated with speech recognition than those based on threshold measures. However, for ASV metrics, this prediction did not hold. For BP stimulation, the negative correlation of speech recognition with ASV for C levels was significant for all measures, but the correlation coefficients were very similar to those obtained for T level ASV for all three measures of speech recognition for this same group of subjects (table 1). For MP stimulation, the negative correlation coefficients for speech recognition with ASV for C levels were smaller than those obtained for T levels and they were not statistically significant (p > 0.05).
We considered whether the poorer correlations of speech recognition with ASV for MP C levels relative to those for MP T levels might be due to MP C levels being a noisier measure. In a previous study, we found that trial-to-trial variation in C levels (as assessed by standard deviations) was actually a little smaller than that for T levels, which suggests that C levels are not inherently less reliable than T levels (figure 5D ordinate in Pfingst and Xu [2004]). However, another possibility is that there are subject variables unrelated to speech recognition that affect C levels more than T levels. This argument can be considered in the context of our working model that ASV reflects, in part, the distances between electrodes and sites of action potential initiation and that variation in these distances is in part responsible for poor speech recognition. Both T levels and C levels would be affected by the electrode-to-neuron distances. However, if additional variables not related to speech recognition, such as adaptation to loud sounds, also affect C levels, this could weaken the correlation between speech recognition and ASV of C levels. With this consideration in mind, we revisited the trial-to-trial variation data that had been collected previously using 10 repeated measures of C and T levels at 4 stimulation sites each in 13 subjects. We found no significant correlation between mean trial-to-trial variation and ASV for either MP or BP stimulation. This suggests that across-subject differences in reliability of C level estimation were not a strong contributor to the ASV measure.
Mechanisms underlying the correlation of ASV with speech recognition are probably different from those underlying the correlations of ASM values with speech recognition. As noted in the Introduction, we believe that one mechanism underlying ASV of C and T levels is ASV in the distances between electrodes and neurons, which results in distortion of the place-pitchmap, making speech recognition more difficult. The consequences of distortions in the place-pitch map similar to those that would be produced under these conditions have been studied under a variety of similar conditions in both normal-hearing and implanted subjects [Moore, 1995]. Turner and colleagues have studied effects of amplifying sounds at specific frequencies corresponding to dead regions in the cochlea. Such amplification presumably results in spread of excitation to regions outside the dead zone. These investigators have found that speech recognition under this type of amplification can become worse than with no stimulation at all in the impaired frequency region [Hogan and Turner, 1998; Turner and Cummings, 1999; Turner et al., 1999]. Shannon et al. [2002] have shown similar negative effects when the outputs of certain channels of the cochlear prosthesis speech processor are re-mapped to electrodes that are apical or basal to the normal target electrodes.
If we assume that stimulation sites with abnormally high or low T and C levels are producing aberrant patterns of neural stimulation that are disruptive to speech recognition, then a reasonable experimental therapy would be to remove those stimulation sites from the patient’s processor map. Previous studies have shown that (a) a large number of sites can be removed from a 20-site map without incurring a reduction in speech recognition [Friesen et al., 2001] and (b) removal of a few sites that show poor performance based on psychophysical measures can result in increases in speech recognition [Zwolan et al., 1997]. Thus, it seems probable that removal of sites with extremely high or low T or C levels to reduce ASV could result in improved speech recognition.
One possible mechanism underlying the correlations of ASM suprathreshold values (ASMs of C levels and DRs) and speech recognition is saturation of neurons at high stimulus levels. This saturation probably occurs more frequently in subjects with smaller DRs. Such saturation could lead to distortion of place-pitch and temporal envelope representations. Consistent with the place-pitch distortion hypothesis, we and others have observed poorer electrode-place discrimination [Pfingst et al., 1999] and poorer place-pitch ranking [Donaldson and Nelson, 2000] in subjects with small DRs for electrical hearing. Smaller DRs would also allow fewer discriminable intensity steps within the DR assuming that the level difference limen remains constant, but this assumption remains to be tested. Stimulation parameters such as carrier pulse rate [Kreft et al., 2004] and the presence of background high-rate pulse trains [Hong and Rubinstein, 2003] affect the DR and could possibly improve performance for subjects with small mean DRs.
The metrics discussed in this study account for 30–60% of the variance in speech recognition across the subjects tested. Clearly, there are many variables that contribute to across-subject variation in speech recognition ranging from biophysical, to neural, to cognitive [Blamey et al., 1996; Kawano et al., 1998; Kileny et al., 1991; Knutson et al., 1991; Pisoni, 2000; Rubinstein et al., 1999]. Some of these variables, such as nerve survival pattern, are likely to affect the metrics that are based on the simple psychophysical measures studied in the experiments reported here, while others, such as cognitive ability, are less likely to affect these simple psychophysical metrics. Furthermore, as noted above, ASV metrics probably reflect different underlying variables than metrics based on ASM values. Thus, these psychophysical metrics should be clinically useful for segregating subjects into groups that can be aided by specific rehabilitation strategies. For example, subjects with high ASV of BP C levels, or BP or MP T levels might benefit from strategies that reduce this ASV by removal of aberrant sites. On the other hand, subjects with small ASMs of DR might require other strategies such as use of special stimulus waveforms and electrode configurations to reduce problems of neural saturation and improve speech recognition. More complex psychophysical tasks, such as complex pattern recognition, have been shown to correlate with speech recognition [Collins et al., 1994], and these might be useful for identifying differences in cognitive ability.
Various features of electrical stimulation can play important roles in determining the predictive and diagnostic power of psychophysical metrics. For ASV metrics, we suggest that BP stimulation has a slight advantage over MP stimulation because the ASV values for BP stimulation are much larger than those for MP stimulation, making them less susceptible to ‘noise’ created by other variables. For ASV of T levels, we found greater consistency over a period of approximately 8 months in the metrics based on BP stimulation as compared to those based on MP stimulation. On the other hand, ASV for MP T levels did correlate highly with speech recognition and MP configurations are the ones most commonly used in the clinic, so it could be more practical to use ASV of MP T levels for clinical diagnosis. ASV values of C levels for BP stimulation were significantly correlated with speech recognition, while those for MP stimulation were not, so in clinical practice, where MP data are obtained more frequently than BP data, T levels might be more useful for diagnosis.
For the ASM of DR metric, the situation with regard to electrode configuration is different. The difference in the ASM DR values for BP stimulation and those for MP stimulation were statistically significant, but they were not large, and ASM of DR metrics for both BP and MP configurations were significantly correlated with speech recognition. Thus, both should be useful for diagnostic purposes, though again, data for MP configurations are more likely to be readily available to the clinician.
Conclusions
Metrics based on simple psychophysical tests, similar to those that subjects perform routinely during clinic visits, have been found to correlate significantly across subjects with speech recognition. These metrics account for 30–60% of the variance in the speech recognition results obtained in this study. Thus, they may be useful in diagnosis of the source of problems that individual prosthesis users may have in recognizing speech. Furthermore, the measures point to some alterations in stimulation strategies that might lead to improvements in speech recognition in individual patients. These applications remain to be tested.
Acknowledgments
We express appreciation to our dedicated subjects and to Cathy Thompson for substantial help in conducting these studies. This work was supported by NIH/NIDCD grant number R01-DC03808 and the KHRI Electronics and Computing Core facilities (P30 DC05188).
References
- Blamey PJ, Arndt P, Bergeron F. Factors affecting auditory performance of postlingually deaf adults using cochlear implants. Audiol Neurootol. 1996;1:293–306. doi: 10.1159/000259212. [DOI] [PubMed] [Google Scholar]
- Blamey PJ, Pyman BC, Gordon M, Clark GM, Brown AM, Dowell RC, Hollow RD. Factors predicting postoperative sentence scores in postlinguistically deaf adult cochlear implant patients. Ann Otol Rhinol Laryngol. 1992;101:342–348. doi: 10.1177/000348949210100410. [DOI] [PubMed] [Google Scholar]
- Collins LM, Wakefield GH, Feinman GR. Temporal pattern discrimination and speech recognition under electrical stimulation. J Acoust Soc Am. 1994;96:2731–2737. doi: 10.1121/1.411279. [DOI] [PubMed] [Google Scholar]
- Donaldson GS, Nelson DA. Place-pitch sensitivity and its relation to consonant recognition by cochlear implant listeners using the MPEAK and SPEAK speech processing strategies. J Acoust Soc Am. 2000;107:1645–1658. doi: 10.1121/1.428449. [DOI] [PubMed] [Google Scholar]
- Franck KH, Xu L, Pfingst BE. Effects of stimulus level on speech perception with cochlear prostheses. J Assoc Res Otolaryngol. 2002;4:49–59. doi: 10.1007/s10162-002-2047-5. [DOI] [PMC free article] [PubMed] [Google Scholar]
- Friesen LM, Shannon RV, Baskent D, Wang X. Speech recognition in noise as a function of the number of spectral channels: comparison of acoustic hearing and cochlear implants. J Acoust Soc Am. 2001;110:1150–1163. doi: 10.1121/1.1381538. [DOI] [PubMed] [Google Scholar]
- Frijns JH, de Snoo SL, Schoonhoven R. Potential distributions and neural excitation patterns in a rotationally symmetric model of the electrically stimulated cochlea. Hear Res. 1995;87:170–186. doi: 10.1016/0378-5955(95)00090-q. [DOI] [PubMed] [Google Scholar]
- Hillenbrand J, Getty LA, Clark MJ, Wheeler K. Acoustic characteristics of American English vowels. J Acoust Soc Am. 1995;97:3099–3111. doi: 10.1121/1.411872. [DOI] [PubMed] [Google Scholar]
- Hogan CA, Turner CW. High-frequency audibility: benefits for hearing-impaired listeners. J Acoust Soc Am. 1998;104:432–441. doi: 10.1121/1.423247. [DOI] [PubMed] [Google Scholar]
- Hong RS, Rubinstein JT. High-rate conditioning pulse trains in cochlear implants: dynamic range measures with sinusoidal stimuli. J Acoust Soc Am. 2003;114:3327–3342. doi: 10.1121/1.1623785. [DOI] [PubMed] [Google Scholar]
- Kawano A, Seldon HL, Clark GM, Ramsden RT, Raine CH. Intracochlear factors contributing to psychophysical percepts following cochlear implantation. Acta Otolaryngol (Stockh) 1998;118:313–326. doi: 10.1080/00016489850183386. [DOI] [PubMed] [Google Scholar]
- Kileny PR, Zimmerman-Phillips S, Kemink JL, Schmaltz SP. Effects of preoperative electrical stimulability and historical factors on performance with multichannel cochlear implant. Ann Otol Rhinol Laryngol. 1991;100:563–568. doi: 10.1177/000348949110000708. [DOI] [PubMed] [Google Scholar]
- Knutson JF, Hinrichs JV, Tyler RS, Gantz BJ, Schartz HA, Woodworth G. Psychological predictors of audiological outcomes of multichannel cochlear implants: preliminary findings. Ann Otol Rhinol Laryngol. 1991;100:817–822. doi: 10.1177/000348949110001006. [DOI] [PubMed] [Google Scholar]
- Kreft HA, Donaldson GS, Nelson DA. Effects of pulse rate on threshold and dynamic range in Clarion cochlear implant users. J Acoust Soc Am. 2004;115:1885–1888. doi: 10.1121/1.1701895. [DOI] [PubMed] [Google Scholar]
- Kuk FK, Tyler RS, Gantz BJ, Bertschy M. Intensity operating range measures as predictors of word-recognition ability in cochlear implant subjects. Scand Audiol. 1990;19:139–145. doi: 10.3109/01050399009070765. [DOI] [PubMed] [Google Scholar]
- Miller CA, Abbas PJ, Nourski KV, Hu N, Robinson BK. Electrode configuration influences action potential initiation site and ensemble stochastic response properties. Hear Res. 2003;175:200–214. doi: 10.1016/s0378-5955(02)00739-6. [DOI] [PubMed] [Google Scholar]
- Mino H, Rubinstein JT, Miller CA, Abbas PJ. Effects of electrode-to-fiber distance on temporal neural response with electrical stimulation. IEEE Trans Biomed Eng. 2004;51:13–20. doi: 10.1109/TBME.2003.820383. [DOI] [PubMed] [Google Scholar]
- Moore BCJ: Perceptual Consequences of Cochlear Damage. New York, Oxford University Press, 1995.
- Nilsson M, Soli SD, Sullivan JA. Development of the Hearing in Noise Test for the measurement of speech reception thresholds in quiet and in noise. J Acoust Soc Am. 1994;95:1085–1099. doi: 10.1121/1.408469. [DOI] [PubMed] [Google Scholar]
- Pfingst BE, Holloway LA, Zwolan TA, Collins LM. Effects of stimulus level on electrode-place discrimination in human subjects with cochlear implants. Hear Res. 1999;134:105–115. doi: 10.1016/s0378-5955(99)00079-9. [DOI] [PubMed] [Google Scholar]
- Pfingst BE, Xu L. Across-site variation in detection thresholds and maximum comfortable loudness levels for cochlear implants. J Assoc Res Otolaryngol. 2004;5:11–24. doi: 10.1007/s10162-003-3051-0. [DOI] [PMC free article] [PubMed] [Google Scholar]
- Pfingst BE, Xu L, Thompson CS. Across-site threshold variation in cochlear implants: relation to speech recognition. Audiol Neurootol. 2004;9:341–352. doi: 10.1159/000081283. [DOI] [PMC free article] [PubMed] [Google Scholar]
- Pisoni DB. Cognitive factors and cochlear implants: some thoughts on perception, learning, and memory in speech perception. Ear Hear. 2000;21:70–78. doi: 10.1097/00003446-200002000-00010. [DOI] [PMC free article] [PubMed] [Google Scholar]
- Rubinstein JT, Parkinson WS, Tyler RS, Gantz BJ. Residual speech recognition and cochlear implant performance: effects of implantation criteria. Am J Otol. 1999;20:445–452. [PubMed] [Google Scholar]
- Shannon RV, Galvin JJ, 3rd, Baskent D. Holes in hearing. J Assoc Res Otolaryngol. 2002;3:185–199. doi: 10.1007/s101620020021. [DOI] [PMC free article] [PubMed] [Google Scholar]
- Shannon RV, Jensvold A, Padilla M, Robert ME, Wang X. Consonant recordings for speech testing (letter) J Acoust Soc Am. 1999;106:L71–L74. doi: 10.1121/1.428150. [DOI] [PubMed] [Google Scholar]
- Shannon RV, Zeng FG, Wygonski J. Speech recognition with altered spectral distribution of envelope cues. J Acoust Soc Am. 1998;104:2467–2476. doi: 10.1121/1.423774. [DOI] [PubMed] [Google Scholar]
- Turner CW, Cummings KJ. Speech audibility for listeners with high-frequency hearing loss. Am J Audiol. 1999;8:47–56. doi: 10.1044/1059-0889(1999/002). [DOI] [PubMed] [Google Scholar]
- Turner CW, Chi SL, Flock S. Limiting spectral resolution in speech for listeners with sensorineural hearing loss. J Speech Lang Hear Res. 1999;42:773–784. doi: 10.1044/jslhr.4204.773. [DOI] [PubMed] [Google Scholar]
- van den Honert C, Stypulkowski PH. Physiological properties of the electrically stimulated auditory nerve. 2 Single fiber recordings. Hear Res. 1984;14:225–243. doi: 10.1016/0378-5955(84)90052-2. [DOI] [PubMed] [Google Scholar]
- Zwolan TA, Collins LM, Wakefield GH. Electrode discrimination and speech recognition in postlingually deafened adult cochlear implant subjects. J Acoust Soc Am. 1997;102:3673–3685. doi: 10.1121/1.420401. [DOI] [PubMed] [Google Scholar]


