Abstract
Gellan gum production was carried out by Sphingomonas paucimobilis ATCC 31461 in a simplified medium with a short incubation time, and a kinetic model for understanding, controlling, and optimizing the fermentation process was proposed. The results revealed that glucose was the best carbon source and that the optimal concentration was 30 g liter−1. As for the fermenting parameters, considerably large amounts of gellan gum were yielded by an 8-h-old culture and a 4% inoculum at 200 rpm on a rotary shaker. Under the optimized conditions, the maximum level of gellan gum (14.75 g liter−1) and the highest conversion efficiency (49.17%) were obtained in a 30-liter fermentor in batch fermentation. Logistic and Luedeking-Piret models were confirmed to provide a good description of gellan gum fermentation, which gave some support for the study of gellan gum fermentation kinetics. Additionally, this study is the first demonstration that gellan gum production is largely growth associated by analysis of kinetics in its batch fermentation process. Based on model prediction, higher gellan gum production (17.71 g liter−1) and higher conversion efficiency (57.12%) were obtained in fed-batch fermentation at the same total glucose concentration (30 g liter−1).
Gellan gum is an important biopolymer produced by Sphingomonas paucimobilis ATCC 31461 (1, 15). This bacterial exopolysaccharide is a high-molecular-mass, anionic polysaccharide which consists of a tetrasaccharide structure with 20% glucuronic acid, 60% glucose, and 20% rhamnose (10, 27, 36). Native gellan gum can change from soft, elastic thermo-reversible gels to harder and more-brittle gels with higher thermal stability by deacylation (11, 21). Due to its good rheological characteristics, gellan gum is a bacterial polysaccharide with great commercial potential for food, pharmaceuticals, and particularly environmental bioremediation. There are reports that gellan gum can be used in the bioremediation of contaminated soils and aquifers (13, 23, 24, 25).
Gellan gum is a product with many attractive properties. Although it has been several years since it was first produced industrially, the process for the production of this biopolymer has not yet been thoroughly studied. It is particularly important that a simplified medium is developed for the production of gellan gum on an industrial scale. In order to optimize the production of gellan gum for industrial application, a fundamental understanding of the key fermentation parameters is necessary. According to previous studies, S. paucimobilis ATCC 31461 can utilize glucose as well as other carbon sources, including corn syrup, lactose, and cheese whey, to synthesize gellan gum (5, 14), while mutant strains of S. paucimobilis ATCC 31461 can utilize glucose, corn syrup, and soybean pomace to produce gellan gum (12, 30, 33). Organic nitrogen sources, such as urea, peptone, and soybean pomace, and inorganic nitrogen sources, such as NaNO3, NH4NO3, and NH4Cl, also support gellan gum production by S. paucimobilis (12, 26). In addition, a number of investigations exploring physiological conditions, such as pH, temperature, and inoculum, to improve gellan gum production were conducted with Erlenmeyer flasks (4, 22, 34). However, the cost of production of these studies was high due to the complex production medium composition with a salt solution and the long incubation time. Furthermore, fermentation is a very complex process, and it is often very difficult to obtain a complete picture of what is actually going on in a particular fermentation. The development of kinetic models is necessary for understanding, controlling, and optimizing fermentation processes. Nevertheless, no references to a kinetic model that describes gellan gum production exist in the literature.
The objectives of the present work were to determine the optimum carbon sources and environmental factors for the production of gellan gum by S. paucimobilis ATCC 31461 in a simplified medium. The batch cultivation kinetic models with a 30-liter fermentor were also proposed to evaluate the behavior of the fermentation systems more rapidly than with laboratory experiments only. According to the kinetic models, a higher production yield of gellan gum was obtained in fed-batch fermentation.
Kinetic model.
Kinetic studies are a vital part of the overall investigations of gellan gum fermentation. A useful analytical model for polysaccharide fermentation kinetics includes temporal variations of substrate (S), biomass (X), and polysaccharide products (P).
Microbial growth: the logistic equation.
Biopolymer fermentation processes are of particular interest. In certain cases, these microbial processes do not follow the classical kinetic model of substrate-limited biomass growth and product formation proposed by Monod in 1949 (7). Therefore, the logistic equation, a substrate-independent model, is used as an alternative empirical function (20). In many fermentation systems, especially polysaccharide fermentations by many types of microorganisms, cell growth has been characterized by the logistic equation (32). The logistic equation (equation 1) can be described as follows:
 |
(1) |
where μm is the maximum specific growth rate (h−1) and Xm is the maximum attainable biomass concentration (g cell [dry weight] liter−1). The integrated form of equation 1 using X = X0 (t = 0) gives a sigmoid variation of X as a function of t, which may represent both an exponential and a stationary phase (equation 2).
 |
(2) |
Product formation: the Luedeking-Piret equation.
The kinetics of product formation was based on the Luedeking-Piret equation (20). According to this model, the product formation rate (rP) depends on both the instantaneous biomass concentration and the growth rate in a linear manner.
 |
(3) |
where α and β are the product formation constants and may differ under different fermentation conditions. The integration of equation 3 (where P = P0 at t = 0) with equation 2 yields:
 |
(4) |
Glucose uptake: the modified Luedeking-Piret equation.
Glucose is used to form cell components and metabolic products as well as for the maintenance of cells. The glucose consumption equation (equation 5) is a modified Luedeking-Piret equation.
 |
(5) |
where YX/S is the cell yield coefficient for glucose, YP/S is the product yield coefficient for glucose, and mS is the maintenance coefficient (g substrate · g cell h−1).
Combining equations 3 and 5 gives:
 |
(6) |
To simplify equation 6, we used the following model to express glucose consumption:
 |
(7) |
where γ is the sum of 1/YX/S and α/YP/S and δ is the sum of β/YP/S and mS. Similarly, the integration of equation 7 with S = S0 at t = 0 yields:
 |
(8) |
MATERIALS AND METHODS
Microorganism and cultivation.
The strain used in this study was S. paucimobilis ATCC 31461. It was maintained on YPG slants containing (liter−1) 30 g glucose, 5 g peptone, 3 g yeast extract, 5 g NaCl, and 20 g agar (pH 7.0). The slants were incubated at 30°C for 24 h, and the fully grown slants were stored at 4°C. The medium used for inoculum was based on YPG medium. A loop of S. paucimobilis cells was inoculated into 50 ml of the above-described sterile medium in 300-ml Erlenmeyer flasks and incubated for the desired time at 30°C with shaking at 200 rpm on a rotary shaker.
The production medium contained (liter−1) 1 g Na2HPO4, 10 g K2SO4, 3 g KH2PO4, 1 g MgSO4 · 7H2O, and 1 g yeast extract (pH 7.0). For fermentation, the appropriate culture was inoculated into 100 ml of the production medium in 500-ml Erlenmeyer flasks. The inoculated flasks were kept on a rotary shaker at 200 rpm at 30°C.
Batch fermentations were performed in a 30-liter fermentor (Biotech-30BS; Shanghai Baoxing, Inc., China) with a total working volume of 20 liters. The temperature was controlled at 30°C, and the initial pH was 7.0 without control in the fermentation processes. Agitation at 100 to 500 rpm was performed with a constant aeration of 2.0 vol/vol/min. The fermentor was filled with the production medium without glucose and sterilized in situ at 121°C for 20 min. The carbon source was sterilized separately and then added to the fermentor. Two preculture stages were performed before the fermentor was inoculated: the first stage included the cultivation of S. paucimobilis ATCC 31461 in 300-ml flasks with 30 ml of nutrient broth at 30°C for the desired time on a rotary shaker at 200 rpm; at the second stage, an appropriate inoculum from the first stage was transferred to 5-liter flasks containing 1 liter of nutrient broth, and the incubation time was the same as in the first stage. The same inoculum ratio was used in the fermentor as well. At regular time intervals, samples were removed from the fermentor to determine the cell dry weight, gellan gum yield, viscosity, and glucose concentrations.
In the fed-batch cultivation, feeding was done according to the following formula (9, 35):
 |
(9) |
where μ is the specific growth rate, tf is the time when feeding started, F is the feeding rate, Sf,const is the substrate (glucose) concentration of feed, (XV)0 is the biomass at the start of feeding, and YX/S is the cell yield coefficient for glucose.
Analytical methods.
Cultures were diluted appropriately with distilled water due to the high viscosity of the broth and then centrifuged at 12,000 × g for 30 min at 25°C. The cell pellet was washed twice with distilled water, recentrifuged, and dried in a hot-air oven at 60°C for 24 h. One volume of the cell-free supernatant was added to 3 volumes of ethanol (95% [vol/vol]) to precipitate the gellan gum. The precipitate was recovered by centrifugation at 12,000 × g for 10 min at 25°C and dried in a hot-air oven (60°C, 24 h). The viscosity of the fermentation broth, which was expressed in centipoises (cP), was measured by a Brookfield viscometer (model LVDV-E; Brookfield Engineering Laboratories, Stoughton, Mass.) with disk spindle 4 at 20 rpm at 30°C. The concentration of glucose in the fermentation broth was assayed using a Biochemistry analyzer (model 2700 SelecT; YSI, Yellow Springs, Ohio) with the appropriate dilution. All experimental data given below were based on mean values obtained from three independent determinations.
Data processing. (i) Model fit.
Fits of the model to the data were performed by linear regression by using the least-squares method, which commonly involves the implicit assumption that the distribution of errors is normal. Estimates for parameters were obtained by minimizing the residual sum of squares (RSS):
 |
(10) |
where n is the number of data points, yi is the observed value, and ŷi is the fitted value.
The performance of the models was evaluated by using correlation coefficients (r):
 |
(11) |
where  is the mean value, and closeness to a value of 1 is an effective and practical measure of the validity of model prediction.
(ii) Parameter confidence intervals.
Confidence intervals (α = 0.05) for parameter values were defined by using t distributions. The formula is as follows:
 |
(12) |
where  is the sample mean, n is the sample size, SD is the sample standard deviation, and tα/2 is the t value with an area of α/2 to its right.
RESULTS
Effects of different carbon sources.
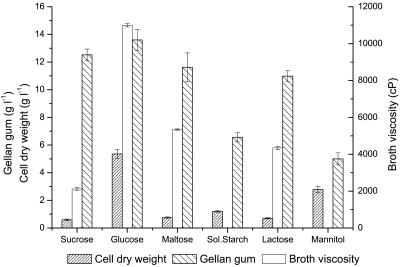
The growth of cells, the yield of gellan gum, and the viscosity of the fermentation broth were investigated using six different carbon sources: sucrose, glucose, maltose, soluble starch, lactose, and mannitol. Production medium containing 20 g liter−1 of the carbon source was used, and cultivation was carried out for 48 h. As shown in Fig. 1, the maximum broth viscosity (10,990 cP), the cell growth (5.35 g liter−1), and the synthesis of gellan gum (13.67 g liter−1) were observed when glucose served as the carbon source. Utilization of soluble starch and mannitol by S. paucimobilis was poor, and neither the production of polymer nor the viscosity of the fermentation broth was satisfactory.
FIG. 1.
Effects of carbon sources on cell growth and gellan gum production. Sol. Starch, soluble starch.
Effects of different glucose concentrations.
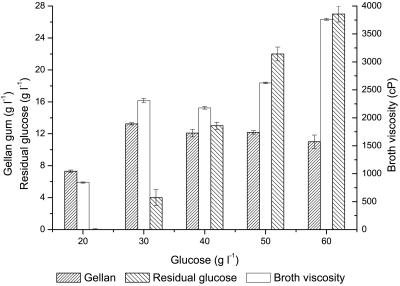
Different concentrations of glucose (20, 30, 40, 50, and 60 g liter−1) were used in the production medium to study the effect of glucose concentration on gellan gum formation. Figure 2 shows the amounts of gellan gum obtained, the broth viscosities, and the residual glucose levels at various concentrations of glucose. The maximum level of gellan gum (13.24 g liter−1) and the maximum broth viscosity (3,762 cP) were obtained at 30 g liter−1 and 60 g liter−1 of glucose, respectively. As far as conversion efficiency of glucose is concerned, the highest conversion efficiency, 44.3%, was obtained using 30 g liter−1 glucose. By contrast, lower conversion efficiencies (36.5%, 30.2%, 24.3%, and 18.3%) were observed using other concentrations of glucose. Therefore, the optimum concentration of initial glucose was 30 g liter−1.
FIG. 2.
Effects of glucose concentrations on gellan gum production.
Effects of inoculum age and volume.
A systematic investigation was conducted to determine the optimum age and volume of inoculum required for gellan gum production with glucose (30 g liter−1) as the carbon source. Production medium was inoculated with cultures of different ages ranging from 8 h to 18 h old. Similarly, different inoculum volumes (ranging from 2% to 10%) of 8-h-old culture were used to inoculate the production medium. The effects of inoculum age on cell growth, gellan gum production, and fermentation broth viscosity are shown in Table 1. The maximum amount of gellan gum (12.64 g liter−1), cell dry weight (2.30 g liter−1), and broth viscosity (7,860 cP) were obtained with 8-h-old inoculum. Reductions in gellan gum yield and fermentation broth viscosity were observed as the age of the inoculum increased.
TABLE 1.
Effects of inoculum age on gellan gum yield, cell dry weight, and broth viscositya
| Inoculum age (h) | Broth viscosity (cP) | Cell dry wt (g liter−1) | Gellan gum yield (g liter−1) |
|---|---|---|---|
| 6 | 5,857 ± 39 | 1.60 ± 0.05 | 9.12 ± 0.16 |
| 8 | 7,860 ± 24 | 2.30 ± 0.15 | 12.64 ± 0.18 |
| 10 | 6,840 ± 58 | 2.13 ± 0.07 | 11.93 ± 0.09 |
| 14 | 4,260 ± 8 | 1.74 ± 0.05 | 10.13 ± 0.51 |
| 16 | 4,560 ± 29 | 1.55 ± 0.27 | 10.06 ± 0.31 |
| 18 | 2,418 ± 32 | 1.59 ± 0.16 | 9.43 ± 0.17 |
Values are the means ± standard deviations of three separate determinations.
The effects of inoculum volume on gellan gum, cell dry weight, and broth viscosity are shown in Table 2. The maximum level of gellan gum (13.49 g liter−1) and the highest broth viscosity (9,919 cP) were obtained with a 4% (vol/vol) 8-h-old inoculum. Reductions in gellan gum yield and broth viscosity were observed as the volume of inoculum increased. The above results indicated that an enhanced gellan gum yield was achieved with an 8-h-old culture and a 4% inoculum volume.
TABLE 2.
Effects of inoculum volume on gellan gum yield, cell dry weight, and broth viscositya
| Inoculum concn (% [vol/vol]) | Broth viscosity (cP) | Cell dry wt (g liter−1) | Gellan gum yield (g liter−1) |
|---|---|---|---|
| 2 | 9,720 ± 62 | 2.49 ± 0.19 | 12.35 ± 0.34 |
| 4 | 9,919 ± 88 | 2.53 ± 0.35 | 13.49 ± 0.18 |
| 6 | 6,780 ± 34 | 2.33 ± 0.11 | 12.07 ± 0.09 |
| 8 | 6,735 ± 75 | 2.17 ± 0.07 | 12.41 ± 0.18 |
| 10 | 3,294 ± 4 | 1.33 ± 0.10 | 10.33 ± 0.13 |
Values are the means ± standard deviations of three separate determinations.
Batch fermentation in a 30-liter fermentor.
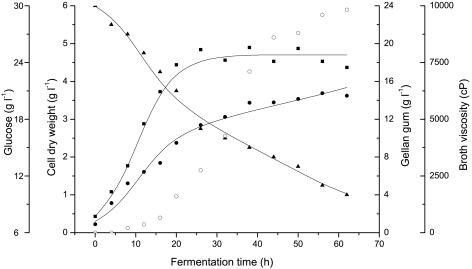
Under the optimized conditions, batch fermentation was conducted in a 30-liter reactor with 20 liters of the production medium. In batch fermentation, a 26-h exponential phase was observed, followed by a stationary phase lasting another 25 h approximately (Fig. 3). Gellan gum production appears to be growth dependent and increases rapidly during the exponential phase and slowly in the stationary phase. The maximum gellan gum concentration (14.75 g liter−1) and highest conversion efficiency (49.17%) were observed at 56 h, followed by a decrease in gellan gum production after 56 h. The residual glucose concentration of the fermentation broth decreased to 10 g liter−1 at 56 h, and the viscosity of the fermentation broth increased over time and reached stationary phase (maximum viscosity was 9,832 cP) at 56 h.
FIG. 3.
Time course of batch culture of S. paucimobilis ATCC 31461. Symbols: ○, broth viscosity; ▪, cell dry weight; •, gellan gum; ▴, glucose. The solid lines represent model predictions.
Kinetic analysis of microbial growth in batch cultivation.
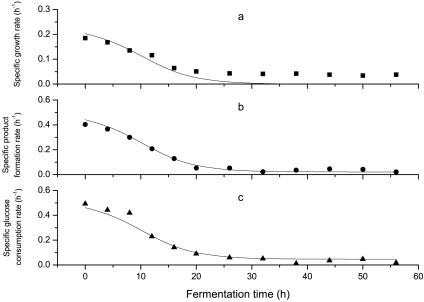
Using the optimized medium, batch fermentation by S. paucimobilis ATCC 31461 showed a classical growth trend. After the fermentor was inoculated, the cells entered exponential growth phase (about 26 h) without lag phase and then entered stationary phase at 26 h. Cell growth reached the maximum value (4.71 g liter−1) at 38 h. In contrast, the maximum value of specific growth rate was observed at the beginning of the process and then declined to zero at approximately 38 h. In this case, a logistic equation was used to express the cell growth as shown in Fig. 3 and 4a, taking Xm as 4.71 (g liter−1) and using the Mathematica software (version 4.0; Wolfram Research, Inc.) to analyze the model parameters. The results are as follows: X0 was 0.430 (g liter−1) and μm was 0.203 (h−1). The model predictions for cell growth and specific growth rate were basically consistent with the experimental results from the exponential phase to the stationary phase (the correlation coefficients were 0.994 and 0.835, respectively), which demonstrates that this model is applicable for predicting the experimental results.
FIG. 4.
Comparison between experimental results and the model prediction for specific growth rate (a), specific product formation rate (b), and specific substrate consumption rate (c) in batch fermentation. Symbols: ▪, specific growth rate; •, specific product formation rate; ▴, specific glucose consumption rate. The solid lines represent model predictions.
Kinetic analysis of product formation in batch cultivation.
Experimental results were analyzed using Mathematica software, and the values for the parameters provided by the model, α and β, were 2.067 g · g cell−1 and 0.022 g · g cell h−1, respectively. Comparisons between model predictions and the experimental data are given in Fig. 3 and 4b. It is obvious that this model is very suitable for describing gellan gum yield and specific product formation rate (the correlation coefficients were 0.993 and 0.991, respectively).
Kinetic analysis of substrate consumption in batch cultivation.
In gellan gum fermentation, the increase in biomass concentration was accompanied by a decrease in residual glucose concentration. The consumption of glucose was to supply cell growth, cell maintenance, and product formation.
Glucose consumption can be represented by equation 8. The initial glucose level was 30 g liter−1. Experimental results were optimized using Mathematica software, and the comparisons between model prediction data and experimental results are shown in Fig. 3 and 4c. It is clear that these models are very suitable for describing glucose consumption and specific glucose consumption rate (the correlation coefficients were 0.997 and 0.983, respectively). The parameters provided by the model, γ and δ, were 2.036 g · g cell−1 and 0.047 g · g cell h−1, respectively.
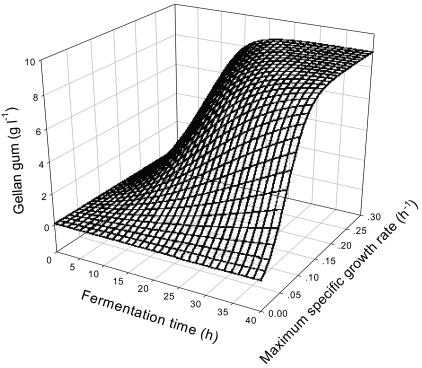
According to the Luedeking-Piret equation, the concentration of gellan gum in fermentation is a function of variables μm and t, and the three-dimensional plot of P(μmax, t) versus maximum specific growth rate and fermentation time was made by Sigmaplot software (version 6.0; Systat Software, Inc.), with parameters from the kinetic model (Table 3) as shown in Fig. 5. Prediction of the three-dimensional plot showed that the gellan gum concentration of each batch fermentation was positively correlated with μmax and t.
TABLE 3.
Estimation of the model parameters from experimental data
| Process | X0 (g liter−1)a | Xm (g liter−1)b | μm (h−1)a | α (g gellan · g cell−1)a | β (g gellan · g cell h−1)a | γ (g glucose · g cell−1)a | δ (g glucose · g cell h−1)a |
|---|---|---|---|---|---|---|---|
| Batch fermentation | 0.43 ± 0.052 | 4.71 ± 0.198 | 0.203 ± 0.042 | 2.067 ± 0.318 | 0.022 ± 0.006 | 2.036 ± 0.209 | 0.047 ± 0.004 |
| Fed-batch fermentation | 0.13 ± 0.009 | 3.30 ± 0.157 | 0.242 ± 0.023 | 3.003 ± 0.575 | 0.033 ± 0.018 | 3.602 ± 0.512 | 0.077 ± 0.009 |
Values are the estimated values ± 95% confidence intervals.
Values are the means ± standard deviations of three separate observed values.
FIG. 5.
Three-dimensional plot of gellan gum production by S. paucimobilis ATCC 31461 as a function of maximum specific growth rate and fermentation time.
Fed-batch fermentation in a 30-liter fermentor.
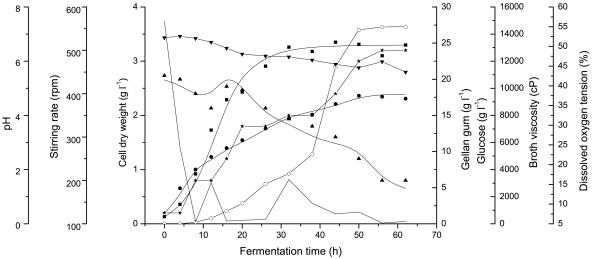
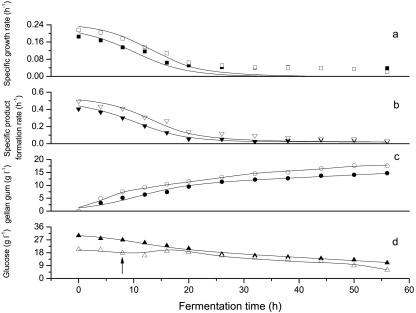
Fed-batch fermentation was carried out with an initial concentration of 20 g liter−1 glucose, and 1 liter glucose solution (Sf,const = 200 g liter−1) was added at 8 h by an exponential feeding as shown in equation 9 (9, 35). With the same total glucose concentration (30 g liter−1), higher gellan gum production (17.71 g liter−1) and higher final conversion efficiency (57.12%) were observed in fed-batch fermentation, as shown in Fig. 6. Additionally, the maximum viscosity of fed-batch fermentation broth was 14,500 cP, and the concentration of glucose in the fed-batch fermentation broth decreased to 6 g liter−1 at 56 h. The results were compared with those of batch fermentation, as shown in Fig. 7 and Table 3. In fed-batch fermentation, specific growth rate (r = 0.921) and specific product formation rate (r = 0.969) declined to zero at approximately 38 h, the same rates as those for batch fermentation (Fig. 7a and b). Furthermore, relatively higher specific growth rates had been obtained in fed-batch fermentation; as a result, specific product formation rates also increased compared with those for batch fermentation.
FIG. 6.
Time course of fed-batch culture of S. paucimobilis ATCC 31461. Symbols: ▪, cell dry weight; •, gellan gum yield; ▴, glucose; ○, viscosity; ★, stirring rate; ▾, pH; —, dissolved-oxygen tension. The solid lines (except for that of viscosity) represent model predictions.
FIG. 7.
Comparison of specific growth rates (a), specific product formation rates (b), gellan gum yields (c), and concentrations of glucose (d) between batch fermentation and fed-batch fermentation. The lines represent model predictions. Scattered solid symbols, representing specific growth rate (▪), specific product formation rate (▾), gellan gum production (•), and glucose concentration (▴), are for batch fermentation, and scattered open symbols, representing specific growth rate (□), specific product formation rate (▿), gellan gum production (○), and glucose concentration (▵), are for fed-batch fermentation. The arrow indicates the starting time of feeding.
DISCUSSION
In this study, gellan gum production was carried out successfully with a simplified production medium by S. paucimobilis ATCC 31461, and the maximum viscosity (10,990 cP), cell growth (5.35 g liter−1), and gellan gum production (13.67 g liter−1) were obtained using glucose (30 g liter−1) as the sole carbon source. These results are different from other researchers' reports which state that maximum gellan gum production was obtained with soluble starch as the sole carbon source (26) and that sucrose supports the maximum growth and synthesis of gellan gum (14). The production medium used in this work, which did not contain a complex salt solution, supported a higher gellan gum yield than those used by other researchers (5, 14, 15). As far as cost of production is concerned, this production medium has great potential for commercial use on an industrial scale.
The size and the physiological condition of the inoculum have a profound effect on gellan gum production by S. paucimobilis ATCC 31461. There exists variation in the use of inoculum age and inoculum volume for gellan gum production, as revealed in the literature. Lobas et al. have reported the use of a 24-h-old culture with a 10% inoculum volume for optimum gellan gum production (19), and use of an 18-h-old culture with an 8% inoculum volume has also been reported (14). Our results showed that the maximum amount of gellan gum was obtainable only with an 8-h-old culture and a 4% inoculum volume after 48 h of fermentation at 30°C (Tables 1 and 2). Compared with the results of Lobas et al. and Kanari et al., the period of the fermentation process was shortened, and higher gellan gum production (14.75 g liter−1) was obtained in a 30-liter fermentor under optimal conditions.
Various mathematical models have been proposed for the kinetics of microbial growth and product formation with other strains (2, 6, 31). For extracellular polysaccharide production, the logistic and Luedeking-Piret equations, developed originally for the formation of lactic acid (20), have been proposed to describe the time courses of product formation, substrate consumption, and cell growth (7, 18, 32), because those models are substantially more accurate and convenient than other models that have been reported. In gellan gum batch fermentation, the logistic and Luedeking-Piret equations provide a good description of cell growth, gellan gum formation, and substrate consumption versus batch fermentation time (Fig. 3 and 4). The correlation coefficient (r) is a criterion for evaluating the performance of the models, and closeness to a value of 1 is an effective and practical measure of the validity of model prediction. The correlation coefficients of cell growth, gellan gum formation, and substrate consumption were 0.994, 0.993, and 0.997, respectively, which revealed that there was good correspondence between the model predictions and observed results. Satisfactory agreement between the observed value and model prediction for the specific product formation rate, as well as for the specific glucose consumption rate, was also obtained, with correlation coefficients of 0.991 and 0.983, respectively. However, the correlation coefficient of the specific growth rate was 0.835, as shown in Fig. 4a, for the anaphase of the exponential phase, in which the experimental results did not accord with the model prediction. This may be attributed to the very high viscosity of the fermentation broth and the complex structure of gellan gum, which made it difficult to separate the cells from the fermentation broth. Furthermore, the maximum cell dry weight is one of the crucial limitations of the models since an accurate value of maximum cell dry weight is required to predict the parameter values of the models. In data analysis, it is also very important to have a realistic measure of the statistical confidence of the parameter estimates. This requires the calculation of the individual confidence intervals associated with the parameters. In this work, confidence intervals (α = 0.05) for parameter values were defined by using t distributions, and the confidence intervals at the 95% level (Table 3) for all of the parameters estimated showed that the statistical reliability of the parameters was suitable and that the models could be used in the further studies of gellan gum fermentation.
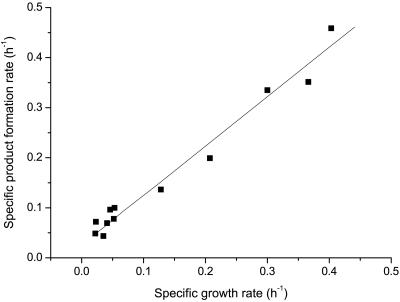
Figure 5 describes the kinetic relationships among maximum specific growth rate, fermentation time, and gellan gum production. During the exponential phase of the fermentation process, higher gellan gum production was obtained by increasing the value of specific growth rate at a given fermentation time, which is also supported by the linear relationship between specific growth rate and specific product formation rate, as shown in Fig. 8. In comparing the growth-associated constant α with the non-growth-associated constant β, α is about 100 times β. The growth-associated constant α is 2.067 g gellan · g cell−1, which showed that the rate of gellan gum formation is high throughout the exponential growth phase. In contrast, the non-growth-associated constant β is 0.022 g gellan · g cell−1, which indicated that gellan gum formation occurred throughout the stationary growth phase with a low rate after cell growth had ceased. If βX is neglected, equation 3 is represented in the following form: rP = dP/dt = α(dX/dt); this indicates that gellan gum production by S. paucimobilis ATCC 31461 appears to be growth associated, which confirms the forecast by Giavasis et al. (8). These results differ from the previous reports in that there was a nonlinear kinetic relationship between the specific growth rate and the specific xanthan formation rate (28) and that xanthan fermentation was largely non-growth associated (29). In the case of growth-associated production, biopolymer biosynthesis generally starts almost simultaneously with growth, showing a maximum rate when the culture is in its exponential growth phase (3, 16, 17). However, the specific product formation rate decreased rapidly during the fermentation process and approached zero at 38 h, the same result as for the specific growth rate and the specific glucose consumption rate. This may be due to the fermentation process in a fermentor without a lag phase using two preculture stages.
FIG. 8.
Specific product formation rate versus specific growth rate. ▪, experimental result. The solid line represents the model prediction.
Gellan gum production is a closely growth-associated process, and thus, any factor or process variable that stimulates cell growth, such as modest C/N ratio, should enhance its production. Fed-batch fermentation was carried out with an initial concentration of 20 g liter−1 glucose, and the rest of the glucose (Sf,const = 200 g liter−1) was fed by exponential feeding at 8 h after fermentation began, in order to obtain higher specific growth rates. It was clearly observed that the specific growth rate for fed-batch fermentation was higher than that for batch fermentation at the same time point, and higher specific product formation rate was also observed to be positively correlated with the specific growth rate and the specific product formation rate, as shown in Fig. 7. The maximum gellan gum production (17.71 g liter−1) in fed-batch fermentation was enhanced by 20% compared with that of batch fermentation (14.75 g liter−1), and the final conversion efficiency of fed-batch fermentation was enhanced from 49.17% to 57.12% at the same total glucose concentration (30 g liter−1). These results were consistent with the conclusion that gellan gum fermentation is a closely growth-associated process. Additionally, the broth viscosity of fed-batch fermentation was also enhanced, to 14,500 cP, compared with that of batch fermentation (9,832 cP) (Fig. 6). At the beginning of the fed-batch fermentation, the dissolved-oxygen tension decreased over time very quickly and increased slightly while the stirring rate increased (Fig. 6). However, after the exponential phase of fed-batch fermentation, the dissolved-oxygen tension remained constant at about 5% and did not zigzag any more, and simultaneously, gellan gum formation occurred very slowly (Fig. 6), which indicated that oxygen is vital for cell growth and gellan synthesis. In addition, at the end of fermentation, the glucose concentration of the fed-batch fermentation broth was still high (6 g liter−1), which was due to the fact that the accumulation of gellan gum increased the viscosity of the fermentation broth and caused limitations of nutrient and oxygen transfer, which, in turn, affected the culture. Therefore, gellan gum formation was limited by the mixing capacity of the fermentor, and the introduction of agitation systems with new impellers offering better mixing and aeration may attract more attention in future work.
In conclusion, a high level of gellan gum production (14.75 g liter−1) was obtained by S. paucimobilis ATCC 31461 in a simplified medium with a short incubation time in a 30-liter reactor. Logistic and Luedeking-Piret models provided a good description of the batch fermentation of gellan gum. So far, this study provides the only demonstration that gellan gum production is a closely growth-associated process. Based on the model prediction, a higher level of gellan gum production (17.71 g liter−1) was obtained in fed-batch fermentation by increasing the specific growth rate.
REFERENCES
- 1.Anson, A., P. J. Fisher, A. F. D. Kenned, and I. W. Sutherland. 1987. A bacterium yielding a polysaccharide with unusual properties. J. Appl. Bacteriol. 62:147-150. [Google Scholar]
- 2.Carlson, R., A. Wlaschin, and F. Srienc. 2005. Kinetic studies and biochemical pathway analysis of anaerobic poly-(R)-3-hydroxybutyric acid synthesis in Escherichia coli. Appl. Environ. Microbiol. 71:713-720. [DOI] [PMC free article] [PubMed] [Google Scholar]
- 3.De Vuyst, L., F. Vanderveken, S. Van de Ven, and B. Degeest. 1998. Production by and isolation of exopolysaccharides from Streptococcus thermophilus grown in a milk medium and evidence for their growth-associated biosynthesis. J. Appl. Microbiol. 84:1059-1068. [DOI] [PubMed] [Google Scholar]
- 4.Dreveton, E., F. Monot, D. Ballerini, J. Lecourtier, and L. Choplin. 1994. Effect of mixing and mass transfer conditions on gellan production by Auromonas elodea. J. Ferment. Bioeng. 77:642-649. [Google Scholar]
- 5.Fialho, A. M., L. O. Martins, M.-L. Donval, J. H. Leitão, M. J. Ridout, A. J. Jay, V. J. Morris, and I. Sá-Correia. 1999. Structures and properties of gellan polymers produced by Sphingomonas paucimobilis ATCC 31461 from lactose compared with those produced from glucose and from cheese whey. Appl. Environ. Microbiol. 65:2485-2491. [DOI] [PMC free article] [PubMed] [Google Scholar]
- 6.Gänzle, M. G., M. Ehmann, and W. P. Hammes. 1998. Modeling of growth of Lactobacillus sanfranciscensis and Candida milleri in response to process parameters of sourdough fermentation. Appl. Environ. Microbiol. 64:2616-2623. [DOI] [PMC free article] [PubMed] [Google Scholar]
- 7.García-Ochoa, F., V. Santos, and A. Alcon. 1995. Xanthan gum production: an unstructured kinetic model. Enzyme Microb. Technol. 17:206-217. [Google Scholar]
- 8.Giavasis, I., L. M. Harvey, and B. McNeil. 2000. Gellan gum. Crit. Rev. Biotechnol. 20:177-211. [DOI] [PubMed] [Google Scholar]
- 9.Hollmann, R., and W. D. Deckwer. 2004. Pyruvate formation and suppression in recombinant Bacillus megaterium cultivation. J. Biotechnol. 111:89-96. [DOI] [PubMed] [Google Scholar]
- 10.Jansson, P. E., B. Lindberg, and P. A. Sandford. 1983. Structural studies of gellan gum, an extracellular polysaccharide elaborated by Pseudomonas elodea. Carbohydr. Res. 124:135-139. [Google Scholar]
- 11.Jay, A. J., I. J. Colquhoun, M. J. Ridout, G. J. Brownsey, V. J. Morris, A. M. Fialho, J. H. Leitão, and I. Sá-Correia. 1998. Analysis of structure and function of gellans with different substitution patterns. Carbohydr. Polym. 35:179-188. [Google Scholar]
- 12.Jin, H., N. K. Lee, M. K. Shin, S. K. Kim, D. L. Kaplan, and J. W. Lee. 2003. Production of gellan by Sphingomonas paucimobilis NK2000 with soybean pomace. Biochem. Eng. J. 16:357-360. [Google Scholar]
- 13.Johnsen, A. R., and U. Karlson. 2004. Evaluation of bacterial strategies to promote the bioavailability of polycyclic aromatic hydrocarbons. Appl. Microbiol. Biotechnol. 63:452-459. [DOI] [PubMed] [Google Scholar]
- 14.Kanari, B., B. B. Banik, and S. N. Upadhyay. 2002. Effect of environmental factors and carbohydrate on gellan gum production. Appl. Biochem. Biotechnol. 102-103:129-139. [DOI] [PubMed] [Google Scholar]
- 15.Kang, K. S., G. T. Veeder, P. J. Mirrasoul, T. Kaneko, and I. W. Cottrell. 1982. Agar-like polysaccharide produced by a Pseudomonas species: production and basic properties. Appl. Environ. Microbiol. 43:1086-1091. [DOI] [PMC free article] [PubMed] [Google Scholar]
- 16.Kimmel, S. A., R. F. Roberts, and G. R. Ziegler. 1998. Optimization of exopolysaccharide production by Lactobacillus delbrueckii subsp. bulgaricus RR grown in a semidefiined medium. Appl. Environ. Microbiol. 64:659-664. [DOI] [PMC free article] [PubMed] [Google Scholar]
- 17.Knoshaug, E. P., J. A. Ahlgren, and J. E. Trempy. 2000. Growth associated exopolysaccharide expression in Lactococcus lactis subspecies cremoris Ropy352. J. Dairy Sci. 83:633-640. [DOI] [PubMed] [Google Scholar]
- 18.Liakopoulou-Kyriakides, M., E. S. Tzanakakis, C. Kiparissidis, L. V. Ekateriadou, and D. A. Kyriakidis. 1997. Kinetics of xanthan gum production from whey by constructed strains of Xanthomonas campestris in batch fermentations. Chem. Eng. Technol. 20:354-360. [Google Scholar]
- 19.Lobas, D., S. Schumpe, and W. D. Deckwer. 1992. The production of gellan exopolysaccharide with Sphingomonas paucimobilis E2 (DSM 6314). Appl. Microbiol. Biotechnol. 37:411-415. [Google Scholar]
- 20.Luedeking, R., and E. L. Piret. 1959. A kinetic study of the lactic acid fermentation: batch process at controlled pH. J. Biochem. Microbiol. Technol. Eng. 1:393-431. [DOI] [PubMed] [Google Scholar]
- 21.Manna, B., A. Gambhir, and P. Ghosh. 1996. Production and rheological characteristics of the microbial polysaccharide gellan. Lett. Appl. Microbiol. 23:141-145. [Google Scholar]
- 22.Martins, L. O., and I. Sá-Correia. 1993. Temperature profiles of gellan synthesis and activities of bio-synthetic enzymes. Biotechnol. Appl. Biochem. 20:385-395. [Google Scholar]
- 23.Moslemy, P., S. R. Guiot, and R. J. Neufeld. 2002. Production of size-controlled gellan gum microbeads encapsulating gasoline-degrading bacteria. Enzyme Microb. Technol. 30:10-18. [Google Scholar]
- 24.Moslemy, P., R. J. Neufeld, D. Millette, and S. R. Guiot. 2003. Transport of gellan gum microbeads through sand: an experimental evaluation for encapsulated cell bioaugmentation. J. Environ. Manag. 69:249-259. [DOI] [PubMed] [Google Scholar]
- 25.Moslemy, P., S. R. Guiot, and R. J. Neufeld. 2004. Activated sludge encapsulation in gellan gum microbeads for gasoline biodegradation. Bioprocess Biosyst. Eng. 26:197-204. [DOI] [PubMed] [Google Scholar]
- 26.Nampoothiri, K. M., R. R. Singhania, C. Sabarinath, and A. Pandey. 2003. Fermentative production of gellan using Sphingomonas paucimobilis. Process Biochem. 38:1512-1519. [Google Scholar]
- 27.O'Neil, M. A., R. R. Selvendran, and V. J. Morris. 1983. Structure of the acidic extracellular gelling polysaccharide produced by Pseudomonas elodea. Carbohydr. Res. 124:123-133. [DOI] [PubMed] [Google Scholar]
- 28.Papagianni, M., S. K. Psomas, L. Batsilas, S. V. Paras, D. A. Kyriakidis, and M. Liakopoulou-Kyriakides. 2001. Xanthan production by Xanthomonas campestris in batch cultures. Process Biochem. 37:73-80. [Google Scholar]
- 29.Richard, A., and A. Margaritis. 2004. Empirical modeling of batch fermentation kinetic for poly(glutamic acid) production and other microbial biopolymers. Biotechnol. Bioeng. 87:501-515. [DOI] [PubMed] [Google Scholar]
- 30.Richau, J. A., D. Choquenet, A. M. Fialho, L. M. Moreira, and I. Sá-Correia. 1997. The biosynthesis of the exopolysaccharide gellan result in the decrease of Sphingomonas paucimobilis tolerance to copper. Enzyme Microb. Technol. 20:510-515. [Google Scholar]
- 31.Verluyten, J., F. Leroy, and L. de Vuyst. 2004. Influence of complex nutrient source on growth of and curvacin A production by sausage isolate Lactobacillus curvatus LTH 1174. Appl. Environ. Microbiol. 70:5081-5088. [DOI] [PMC free article] [PubMed] [Google Scholar]
- 32.Weiss, R., and D. Ollis. 1980. Extracellular microbial polysaccharides. I. Substrate, biomass, and product kinetic equations for batch xanthan gum. Biotechnol. Bioeng. 22:859-873. [Google Scholar]
- 33.West, T. P. 2002. Isolation of a mutant strain of Pseudomonas sp. ATCC 31461 exhibiting elevated polysaccharide production. J. Ind. Microbiol. Biotechnol. 29:185-188. [DOI] [PubMed] [Google Scholar]
- 34.West, T. P. 2003. Effect of temperature on bacterial gellan production. World J. Microbiol. Biotechnol. 19:649-652. [Google Scholar]
- 35.Yamane, T., and S. Shimizu. 1984. Advance in biochemical engineering and biotechnology, vol. 30, p. 145-194. Springer Verlag, Berlin, Germany. [Google Scholar]
- 36.Yuguchi, Y., M. Mimura, S. Kitamura, H. Urakawa, and K. Kajiwara. 1993. Structural characteristics of gellan aqueous solutions. Food Hydrocoll. 7:373-385. [Google Scholar]


