Abstract
Torque is generated in the rotary motor at the base of the bacterial flagellum by ion translocating stator units anchored to the peptidoglycan cell wall. Stator units are composed of the proteins MotA and MotB in proton-driven motors, and they are composed of PomA and PomB in sodium-driven motors. Strains of Escherichia coli lacking functional stator proteins produce flagella that do not rotate, and induced expression of the missing proteins leads to restoration of motor rotation in discrete speed increments, a process known as “resurrection.” Early work suggested a maximum of eight units. More recent indications that WT motors may contain more than eight units, based on recovery of disrupted motors, are inconclusive. Here we demonstrate conclusively that the maximum number of units in a motor is at least 11. Using back-focal-plane interferometry of 1-μm polystyrene beads attached to flagella, we observed at least 11 distinct speed increments during resurrection with three different combinations of stator proteins in E. coli. The average torques generated by a single unit and a fully induced motor were lower than previous estimates. Speed increments at high numbers of units are smaller than those at low numbers, indicating that not all units in a fully induced motor are equivalent.
Keywords: molecular motors, single molecules, MotA, PomA, resurrection
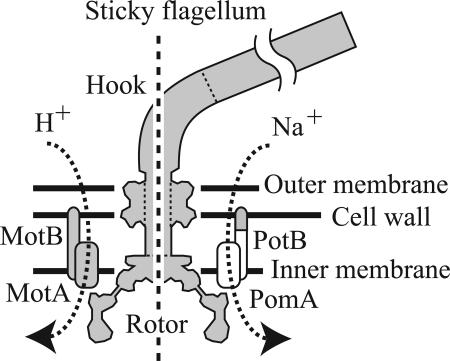
The flagellar motor is the mechanism of propulsion for most swimming bacteria (1–5). In Escherichia coli ≈40 gene products are required for motor assembly, with ≈20 of them being present in the final structure. Each motor drives a helical filament up to ≈10 μm long. The flagellar motor spans the inner and outer bacterial membranes (Fig. 1). Torque is generated by interactions between the rotor protein FliG, located at the intersection between the MS and C rings, and the stator units attached to the cell wall (5). Each unit is believed to contain two copies of MotB and four copies of MotA in proton-driven motors of E. coli, two copies of PomB and four copies of PomA in sodium-driven motors of Vibrio alginolyticus (6, 7), and function as an ion channel (8, 9). Ion flux through these channels powers the motor (10, 11). Functional chimeras have been engineered containing components of proton- and sodium-driven motors (12), indicating that the structure and mechanisms of both types of motor are very similar. The torque-speed relationship of the motor has been measured by using electrorotation of tethered cells (13) and attaching varying viscous loads (14–16). A notable feature is a regime between stall and a speed of ≈175 Hz in WT E. coli at room temperature, over which torque falls linearly with increasing speed to ≈90% of the value at stall. At higher speeds torque falls more steeply, eventually to zero at a speed of ≈350 Hz.
Fig. 1.
Schematic of the flagellar motor. Components derived from E. coli and V. alginolyticus are shown in gray and white, respectively. (Left) The proton-driven stator consisting of MotA and MotB. (Right) The chimeric sodium-driven stator consisting of PomA and PotB.
Successive incorporation of torque-generating units to restore rotation in paralyzed motors is known as resurrection (17). The maximum number of speed increments previously seen during resurrection of a single motor, using inducible plasmids to express missing stator proteins, was eight (18). However, in experiments where flagellar motors recovered after being disrupted either mechanically (19), electrically (20), or electro-chemically (21), equal speed increments have been observed that are less than one-eighth of the maximum speed seen for the same cell.
We used 1-μm beads to study in detail the incorporation of torque-generating units into the motor of E. coli in the linear torque-speed regime, at speeds up to ≈80 Hz. We varied the number of units in four different ways: (i) induced expression of MotA in a motA point mutation background; (ii) induced expression of MotA and MotB in a motAB deletion background; (iii) induced expression of PomA and the PomB/MotB chimeric protein, PotB, a combination that works as a sodium-driven stator (12) in a motAB deletion background; and (iv) measurement of WT cells in early exponential growth phase, when natural expression of motor proteins is lower than in the late exponential growth phase typically used to study the motor (22). At least 11 speed levels were seen in motors analyzed under conditions i–iii, and the lower speed levels were seen under condition iv. In addition, the size of speed increments decreased with increasing unit number more steeply than can be explained by the torque–speed relationship, indicating that units are not all equivalent. Estimates of single-unit torque and the maximum number of units per motor are discussed.
Results
For simplicity the strains of E. coli used in this work are referred to as MotA, MotAB, chimera, and WT (see Materials and Methods and Table 1).
Table 1.
Strains and plasmids
| Strain/plasmid | Relevant genotype/phenotype | Reference |
|---|---|---|
| Strains | ||
| MotA | HCB1271, pDFB36, pFD313Cm | 14 |
| MotAB | YS34, pDFB27, pFD313Cm | This work |
| Chimera | YS34, pYS11, pYS13 | 21 |
| WT | KAF95, pFD313 | 13 |
| HCB1271 | fliC::Tn10 pilA’-KnRmotA448 | 14 |
| KAF95 | ΔcheY fliC726 | 13 |
| YS34 | fliC::Tn10 ΔpilA ΔmotAmotB ΔcheY | 21 |
| Plasmids | ||
| pFD313 | fliCst, ApR | 23 |
| pFD313Cm | fliCst, CmR | 14 |
| pDFB27 | PARAmotAmotB, ApR | 18 |
| pDFB36 | PLACmotA, ApR | 18 |
| pYS11 | fliCst, ApR | 21 |
| pYS13 | PLACpomApotB, CmR | 21 |
Steady-State Induction During Cell Culture.
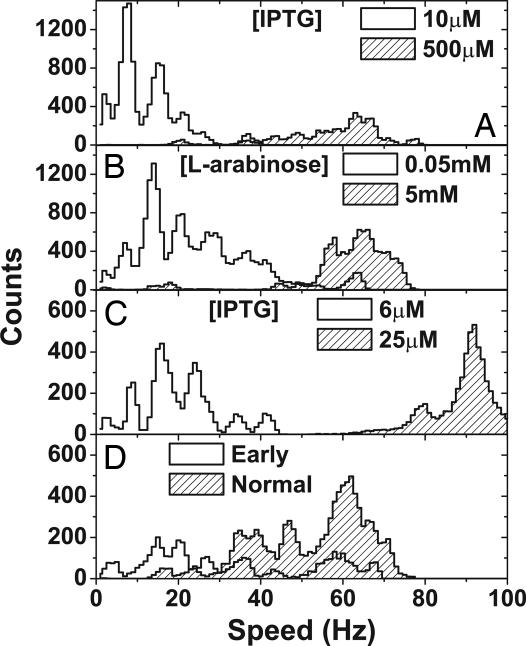
Fig. 2 A–C shows speed histograms for populations of cells of the MotA, MotAB, and chimera strains, respectively (between 24 and 107 cells per histogram), with low (white fill) and high (shaded fill) induction during cell culture. Each cell was observed for a total of 20.4 s, during which interval the speed was calculated 194 times. Low induction gave rotational speeds grouped at discrete levels separated by roughly equal intervals, corresponding to different numbers of torque-generating complexes in the motor. The speed levels, determined by fitting multiple Gaussian distributions to the histograms, are shown in Table 2. WT cells measured early in exponential growth gave speed levels similar to low induction peaks (Fig. 2D), whereas late exponential growth gave a broad distribution of speeds between 60 and 70 Hz, similar to high induction. Approximately half of the width of the low-speed peaks can be attributed to fluctuations in the speed of each cell, the remainder is probably caused by differences between cells in ion-motive force and the viscous drag coefficient of the bead (see Supporting Text, which is published as supporting information on the PNAS web site, and Materials and Methods). Average motor speed increased with inducer concentration in the MotA, MotAB, and chimera strains, saturating at 50 μM isopropyl β-d-thiogalactopyranoside (IPTG), 2 mM l-arabinose, and 20 μM IPTG, respectively. As with WT cells, cell populations showed a broad distribution of speeds, especially at intermediate inducer concentrations. Immunoblotting showed that the concentration of MotA in the MotAB strain increased with inducer concentration over the same range (0.25–2 mM l-arabinose) as average speed, with no detectable MotA in the absence of inducer (data not shown). MotA was detected in the MotA strain even without induction, confirming the presence of mutant MotA protein in this strain.
Fig. 2.
Steady-state induction of stator proteins. (A) Speed histograms for MotA strain populations at low (10 μM IPTG, 40 cells) and high (500 μM IPTG, 26 cells) induction. (B) Speed histograms for MotAB strain populations at low (0.05 mM l-arabinose, 107 cells) and high (5 mM l-arabinose, 52 cells) induction. (C) Chimera strain in 85 mM sodium chloride at low (5 μM ITPG, 30 cells) and high (25 μM IPTG, 30 cells) induction. (D) WT strain harvested early (2 h, 24 cells) or at the normal time (4 h, 52 cells). Each cell was measured for 20.4 s, producing 194 data points, with each one “count.” Speed bins correspond to the resolution of the power spectrum (1 Hz). At low induction, peaks occur because of discrete numbers of torque-generating units.
Table 2.
Low and full induction speeds (Hz) by Gaussian fit to histogram peaks
| Strain | Level |
Full | ||
|---|---|---|---|---|
| 1 | 2 | 3 | ||
| MotA | 7.5 ± 1.4 | 15.1 ± 1.9 | 21.4 ± 1.7 | 61.7 ± 7.8 |
| MotAB | 7.1 ± 1.7 | 13.8 ± 1.7 | 20.3 ± 1.7 | 64.0 ± 6.9 |
| Chimera | 8.7 ± 1.0 | 16.1 ± 1.9 | 24.1 ± 2.4 | 91.8 ± 3.7 |
| WT | 61.6 ± 5.7 | |||
Resurrection.
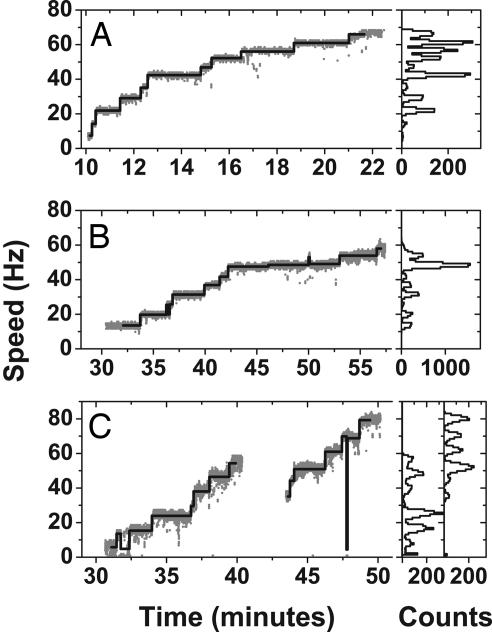
Experiments in which high concentrations of inducer were added while a single motor was under observation were performed on all three inducible strains. Cells were cultured with low-level induction (5 or 10 μM IPTG for the MotA strain, 10 μM l-arabinose for the MotAB strain, and 5 μM IPTG for the chimera strain) so that motors with one or two units and well aligned beads could be selected before further induction. Fig. 3 shows typical resurrection traces and the corresponding speed histograms for the MotA (Fig. 3A), MotAB (Fig. 3B), and chimera (Fig. 3C) strains. Speed increases in the MotA strain began 10–20 min after addition of inducer (typically 1 mM IPTG), with most cells reaching maximum speed after an additional 10–20 min. With the MotAB strain speed increases began 20–30 min after addition of inducer (typically 5 mM l-arabinose) with maximum speed attained after an additional 30–60 min. For MotA and MotAB strains 16 of 21 and 8 of 11 cells, respectively, reached level 10 or above. Chimera resurrections also reached level 9 or above.
Fig. 3.
Resurrection traces for the MotA strain (A), the MotAB strain (B), and the chimera strain (C). Levels found by the step-finding routine are superimposed, and speed histograms are shown on the right. The MotA strain shows levels 1–11 (possibly 12); the MotAB strain shows levels 2–10, and the chimera strain shows levels 1–7 and 5–10 (or possibly 4–9) in two different cells recorded consecutively in the same preparation.
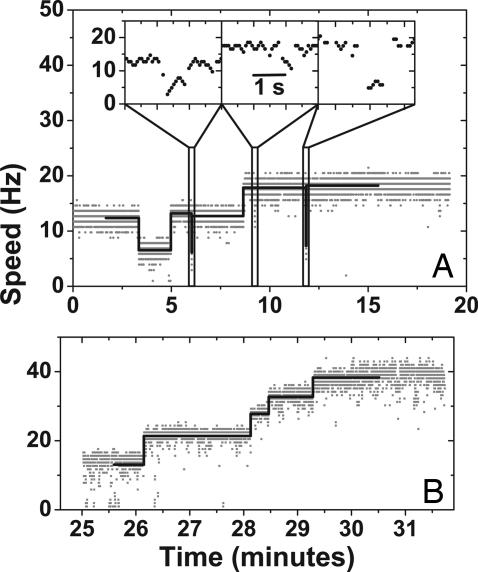
The data in Figs. 2 and 3 and Table 2 indicate that a single unit drives a 1-μm bead at ≈7.3 Hz in the proton motor and ≈8.7 Hz in the sodium motor in 85 mM sodium chloride, and that there can be at least 11 units in the motor. This finding was true for all three strains, demonstrating that the results do not depend on whether MotA and MotB are expressed together or whether natural proton-driven or chimeric sodium-driven stators are expressed. Fig. 4A shows an extended record of speed vs. time for a cell of the MotA strain grown with 20 μM IPTG and observed under the same conditions as in Fig. 2. Stepwise changes between speed levels similar to those of Table 2 and Figs. 2 and 3 were typical, demonstrating that speed levels do not depend on changing levels of expression in resurrection experiments. Speed changes were observed that occurred on a much faster time scale than resurrection steps, often missed by our step-finding algorithm (see Materials and Methods). In Fig. 4A, for example, slow changes in the number of units follow the sequence 2, 1, 2, 3, spending several minutes at each level; whereas fast transient decreases in speed (Fig. 4A Inset) appear to show removal of one or two units followed by recovery of the original speed within a couple of seconds. Similar fast transients were observed during resurrections in all three strains. Slow rotating WT cells harvested in early exponential growth also show stepwise speed changes similar to those in resurrection experiments (Fig. 4B). This finding demonstrates that resurrection steps represent the natural torque-generating unit and are not an artifact of induced expression from plasmids. Speed changes were consistent with the incorporation of torque generators between levels 2 and 6.
Fig. 4.
Speed changes during extended observations. (A) An extended measurement of a cell of the MotA strain grown in 20 μM IPTG. This trace shows slow removal and addition of torque-generating units and brief speed reductions consisting of one or two units (expanded in Insets). Levels found by the step-finding routine are superimposed. (B) An extended measurement of the WT strain harvested early (after 2 h of growth). Stepwise increases in speed consistent with those in resurrection experiments are seen in levels 2–6.
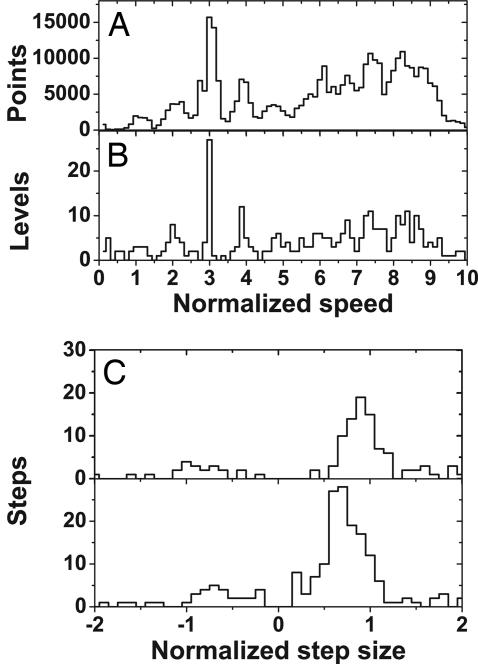
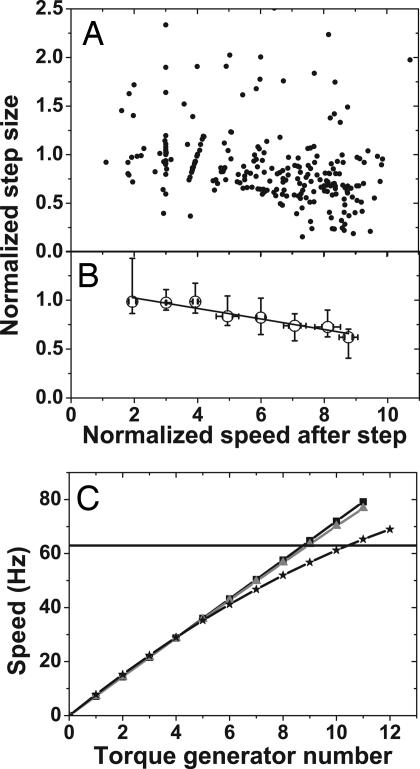
Further analysis was performed with a combined MotA and MotAB data set consisting of 32 resurrections. Speed vs. time traces were analyzed with the step-finding algorithm. To remove the effect of cell-to-cell variations, speeds were normalized as follows. The majority of resurrection traces (23 of 32) included a level with a speed between 18 and 23 Hz, identifiable as corresponding to three units. Only these traces were analyzed. Normalized speed was defined for each trace as 3 × (actual speed)/(mean speed at level 3). The average of all level-3 speeds was 20.8 ± 1.3 Hz, corresponding to a normalization constant of 6.9 ± 0.4 Hz per stator unit, consistent with the values determined in steady-state low-expression experiments (Table 2). Fig. 5 A and B shows histograms of all normalized speeds and the normalized speeds of levels found by the step-finding algorithm, respectively (in Fig. 5B level 1 is badly defined because cells spinning with one unit often paused, causing problems for the step finder, and because many resurrections began from level 2; the lack of scatter at level 3 is a consequence of using this level for normalization). Levels 1–5 are clearly identifiable in the pooled histograms of Fig. 5 A and B. Higher speed levels are not easily distinguishable, indicating that these levels varied from cell to cell. Fig. 5C shows separate histograms of normalized step size for steps in which the normalized speed level after the step was <5.5 (Upper) and >5.5 (Lower). Gaussian fits to the main peaks give average normalized step sizes of 0.90 ± 0.17 and 0.75 ± 0.20, corresponding to 6.2 ± 1.2 and 5.2 ± 1.4 Hz for lower and higher speed levels, respectively. Fig. 6 A and B shows normalized step size against normalized speed level after the step for all upwards steps found in normalized traces.
Fig. 5.
Results from the step-finder routine. (A) Histogram of combined normalized speeds for 23 resurrections of the MotA and MotAB strains. The average normalization constant is 6.9 Hz. (B) Normalized levels found by the step-finding algorithm. Level peaks coincide with speed peaks in A. (C) Histogram of found steps for speeds <5.5 normalized units (Upper) and >5.5 units (Lower). The split illustrates the decrease in step size at increasing speeds.
Fig. 6.
Step size during resurrection experiments. (A) Normalized step size vs. normalized speed. Only upwards steps are shown. (B) Median and interquartile range for the data in A, binned according to speed after the step, illustrating the decreasing trend. A linear fit to the median values is shown. (C) Models for speed vs. torque-generating unit number. Squares, each unit contributes 7.2 Hz; triangles, the average unit torque decreases according to the measured torque-speed curve (15); stars, step size depends on speed according to the linear fit in B. The horizontal line at 63 Hz marks the average speed of fully induced cells.
Earlier work using tethered cells (18) estimated a maximum of eight speed levels, based on a considerably smaller data set with few cells that showed resurrection to completion. Final speeds were eight or nine times higher than the lowest level, as in our experiments, and the estimate relied on the incorrect assumption that all speed increments were equal. In an attempt to repeat that work we found that tethered cells did not consistently resurrect to high levels, perhaps partly because of problems caused by cell growth, such as detachment from or sticking to the surface (data not shown). We believe the bead assay to be a much more powerful experimental method, in particular because of reproducible and reduced viscous load and reduced interactions with the surface, and that this may be the main reason that levels beyond eight were not seen previously. We tested a wide range of conditions, including variations in the concentration and duration of exposure to inducer and the nutrient concentration present during resurrection (data not shown) and resurrection in a medium containing sodium chloride, lactate, and methionine, as used in the earlier work (Fig. 7, which is published as supporting information on the PNAS web site). None of these factors affected the maximum number of speed levels, the speeds of the lowest levels, or the reduction of speed increments at higher levels.
Number of Torque-Generating Units.
The most conservative estimate of the number of torque-generating units in a fully induced motor, ignoring any effect of reduced torque per unit at high levels, is obtained from steady-state induction data by dividing the typical speed of a fully induced motor by the average speed per unit at low levels. The former can be estimated as 63 ± 7 Hz (fitting the largest high induction peaks in Fig. 2 A and B: similar estimates of the fully induced speed can be obtained from resurrection data, Supporting Text), the latter as 7.2 ± 0.3 Hz (an average based on the data in Table 2 for MotA and MotAB strains at levels 1, 2, and 3), giving an estimate of 8.8 ± 1.0 units. More accurate estimates taking account of the observed reduction of torque per unit at high levels can also be obtained from resurrection data. Using the linear fit of Fig. 6B and the average normalization constant to estimate the speed per unit gave 10.4 ± 1.3 units in a typical fully induced motor. These estimates are illustrated in Fig. 6C. We can count up to 11 distinct speed levels in some cases, indicating that the higher estimates above are more accurate than the lower. Our estimate of a maximum of at least 11 units per motor is consistent with the number of intramembrane particles (10 to 12) found by freeze fracture studies (24).
Discussion
This work removes the discrepancy between a maximum of eight resurrection steps and evidence for a larger number of torque generators by demonstrating that at least 11 resurrection steps can be observed. Our “steady-state” low induction experiments are best explained by a dynamic equilibrium between torque-generating units in motors and others circulating in the cell, as noted in previous work (17, 18). Thus low-level induction leads to a low steady-state concentration of units in circulation, which in turn leads to a low steady-state number of units in each motor. Further evidence for dynamic incorporation and removal of torque-generating units from the motor is provided by the observation of stepwise speed increases and decreases between discrete levels in nearly all extended observations of single motors.
Resurrection speed increments were found to decrease with speed despite the fact that a 1-μm bead should be well within the linear, almost flat region of the torque speed curve (15). The maximum decrease in step size caused by increasing speed alone, based on the torque speed curve, is <5% over the full speed range (Fig. 6C), but our results show a decrease of ≈40% (Fig. 6 A and B). To rule out the possibility that this result is an artifact caused by de-energization of cells expressing proteins in the low-nutrient motility buffer, we observed that resurrections in media containing lactate and methionine, used in previous experiments to prevent de-energization (15, 18), also showed smaller step sizes at higher levels (Supporting Text). Further evidence against de-energization as the cause of reduced step sizes came from extended observations of WT cells and cells grown with high levels of inducers, which consistently showed speed steps smaller than one- eighth of the speeds on either side of the step, consistent with more than eight units and a reduced step size at higher levels (Supporting Text and Fig. 8, which are published as supporting information on the PNAS web site). Furthermore, the speeds at the end of resurrection traces were similar to those of WT cells and those fully induced during growth. Bead orbits did not change significantly in size or shape during resurrection (Supporting Text and Fig. 9, which are published as supporting information on the PNAS web site), ruling out a change in viscous load as an alternative explanation of the reduction in step size.
The reduction in step sizes at higher levels indicates an interaction between torque-generating units that reduces the torque delivered at high numbers of units. Interactions may be via the rotor, directly because of close packing of stator units or some other unknown mechanism. Because of experimental difficulties, the chimera resurrection data set was smaller and less complete than the others, and we did not perform the extended step-size analysis on it. However, the chimera did not appear to show the reduction in step sizes at higher levels, which can be seen by comparing Fig. 2 C with A and B and Fig. 3 C with A and B. Comparisons between the torque-speed relations of single-unit and fully induced motors, and between WT and chimeric motors, may provide insight into interactions between torque-generating units in the flagellar motor.
We estimate the torque generated by a single unit rotating a 1-μm bead at 7.3 ± 1.6 Hz to be 146 ± 35 pN·nm (see Materials and Methods) and the torque generated by a fully induced motor at 63 ± 7 Hz to be 1,260 ± 190 pN·nm. Our single-unit torque was considerably lower than the value reported earlier with the same MotA strain (14). Viscous drag on long filament stubs (≈1–2 μm), ignored in our analysis, could possibly account for this difference. However, flagella were sheared in the same way in both experiments, and the lack of beads rotating at eccentricities more than ≈0.5 μm and the small variation in speeds from cell to cell are both evidence against long flagellar stubs. Our fully induced torque estimates were at the lower end of the range of previous measurements (17). Assuming a proton-motive force (pmf) of −150 ± 25 mV, we can estimate a lower limit of 38 ± 11 for the number of protons that flow through each unit per revolution (equal to the work done by a single-unit motor in one rotation, 2π × torque = 917 ± 220 × 10−21 J, divided by the free energy per proton, −e × pmf = 24 ± 4 × 10⁻²¹ J). Given the recent observation of 26 discrete angular steps per rotation of the motor (21), the above estimate is consistent with the hypothesis that the fundamental torque-generating process in the flagellar motor uses more than one ion (25), but does not absolutely rule out the possibility of a single-ion step. Torque in the chimeric motor in 85 mM Na+ was 20% higher, perhaps indicating that the sodium-motive force (smf) is greater than the pmf under these conditions. Direct measurements of the smf at different sodium concentrations in cells with chimeric motors (26) may resolve this question in the near future.
Materials and Methods
Strains and Cultures.
Details of strains and plasmids are shown in Table 1.
Experimental cultures were grown in 5 ml of T-broth (1% Bacto tryptone Difco/85 mM sodium chloride) at 30°C containing the appropriate antibiotics. Inducer, either IPTG or l-arabinose (added as dl-arabinose), was present at a range of concentrations (up to 500 μM IPTG and 5 mM arabinose). Flagellar rotation measurements were performed in motility buffer consisting of 10 mM potassium phosphate and 0.1 mM EDTA at pH 7.0 plus the appropriate concentration of inducer. Sodium chloride (85 mM) was present in motility buffer for chimera strain measurements.
Immunoblotting.
Motile cells were harvested at an OD600 of 0.5 (MotA strain) or 0.75 (MotAB strain) and resuspended in 100 μl of SDS/PAGE loading buffer (50 mM Tris·HCl/10% glycerol/1% SDS/50 mM DTT/0.01% bromophenol blue, pH 6.8). Ten microliters was subjected to SDS/PAGE (12% polyacrylamide) and electro-blotted by standard methods. The membrane was blocked in 5% (wt/vol) dried milk, incubated for 1 h in anti-MotA antibody diluted 1/1,000 in PBS containing 1% milk, and washed extensively with PBS. The membrane was then blocked in a 1/1,000-dilution horseradish peroxidase-conjugated anti-rabbit antibody in PBS (Dako) and washed, and bands were detected by enhanced chemiluminescence (Amersham Pharmacia Biosciences).
Speed and Torque Measurements.
Cells were attached to a glass coverslip, and 1.0-μm-diameter latex beads were attached as described (21). The position of the bead was measured by using back-focal-plane laser interferometry (27) as described (28), sampled at 2 kHz. In the case of extended measurements (lasting up to 2 h) a feedback system to a piezo-electric stage was used to compensate for drift. All experiments were performed at 23°C. Speeds were obtained from power spectra of combined (x, y) data as described (21), using data windows of length 1 s beginning at intervals of 0.1 s and multiplied by a “flat-top” window to provide weighting toward the center. This process gave a speed resolution of 1 Hz. Speeds where rotation was intermittent were removed by requiring the corresponding peak in the power spectrum to exceed a threshold value, which highly depended on the alignment of the rotating bead and was set individually for each motor to exclude not >40% and typically <20% of all data for a given cell.
Torque was estimated by calculating the viscous drag on the bead, neglecting the contribution of the filament stub. An eccentrically rotating bead has a drag coefficient, f = 8 πηrb3 + 6 πηrbre2, where η is viscosity, rb is bead radius, and re is eccentricity (16). An average eccentricity of 0.20 ± 0.03 μm was measured by using data from well aligned beads, giving f = 20 ± 2 pN·nm·Hz−1 for the 1-μm beads used. The estimated error of 10% in f is from a combination of uncertainties in temperature (and therefore viscosity), bead radius, and eccentricity.
Data Processing.
Speed histograms were constructed with 1-Hz bins; peak speeds in histograms were found by Gaussian fits with mean, SD, and amplitude as free parameters. Where more than one peak was clearly evident a multiple Gaussian model was applied.
An automated system was developed (21) to detect levels and step sizes in the extended speed vs. time measurements as follows: (i) The entire speed time trace was divided into two intervals at the point that gave the best least-squares fit to a single step function. (ii) This process was repeated for each interval until either the best position was at one end of the interval or the interval was less than three data points, producing an excess of steps within which all of the “true” steps were contained. (iii) A Student's t statistic was generated by comparing intervals immediately before and after each putative step (29). (iv) The step with the lowest t-value was discarded and the surrounding intervals were concatenated. (v) Step iv was repeated until all remaining steps had a t-value above a set threshold. The threshold was determined by testing the algorithm on simulated traces containing Poisson distributed steps, with size, number, interval between steps, and noise level similar to experimental traces. The threshold tailored the algorithm to detect resurrection steps at the expense of neglecting speed fluctuations on shorter time scales.
All errors are mean ± SD unless stated otherwise.
Supplementary Material
Acknowledgments
We thank David Blair (University of Utah, Salt Lake City) for the inducible plasmids and anti-MotA antibody, Howard Berg and Karen Fahrner (Harvard University, Cambridge, MA) for the MotA and WT strains HCB1271 and KAF95, Yoshiyuki Sowa (Nagoya University, Nagoya, Japan) for the chimera strain YS34 and sticky filament plasmid, and Alex Rowe for helpful discussions. C.-J.L. thanks Swire Group for financial support. S.W.R. was supported by the Life Sciences Interface Doctoral Training Centre, Oxford University (Engineering and Physical Sciences Research Council). M.C.L., J.H.C., J.P.A., and R.M.B. were supported by combined United Kingdom research councils through an Interdisciplinary Research Collaboration in Bionanotechnology.
Abbreviation
- IPTG
isopropyl β-d-thiogalactopyranoside
Footnotes
Conflict of interest statement: No conflicts declared.
This paper was submitted directly (Track II) to the PNAS office.
References
- 1.Berry R. M., Armitage J. P. Adv. Microb. Physiol. 1999;41:291–337. doi: 10.1016/s0065-2911(08)60169-1. [DOI] [PubMed] [Google Scholar]
- 2.Berry R. M. In: Molecular Motors. Schliwa M., editor. Berlin: Wiley; 2003. pp. 111–140. [Google Scholar]
- 3.Berg H. C. Annu. Rev. Biochem. 2003;72:19–54. doi: 10.1146/annurev.biochem.72.121801.161737. [DOI] [PubMed] [Google Scholar]
- 4.Macnab R. M. Annu. Rev. Microbiol. 2003;57:77–100. doi: 10.1146/annurev.micro.57.030502.090832. [DOI] [PubMed] [Google Scholar]
- 5.Blair D. F. FEBS Lett. 2003;543:86–95. doi: 10.1016/s0014-5793(03)00397-1. [DOI] [PubMed] [Google Scholar]
- 6.Sato K., Homma M. J. Biol. Chem. 2000;275:5718–5722. doi: 10.1074/jbc.275.8.5718. [DOI] [PubMed] [Google Scholar]
- 7.Braun T. F., Blair D. F. Biochemistry. 2001;40:13051–13059. doi: 10.1021/bi011264g. [DOI] [PubMed] [Google Scholar]
- 8.Blair D. F., Berg H. C. Cell. 1990;60:439–449. doi: 10.1016/0092-8674(90)90595-6. [DOI] [PubMed] [Google Scholar]
- 9.Stoltz B., Berg H. C. J. Bacteriol. 1991;173:7033–7037. doi: 10.1128/jb.173.21.7033-7037.1991. [DOI] [PMC free article] [PubMed] [Google Scholar]
- 10.Manson M. D., Tedesco P., Berg H. C., Harold F. M., van der Drift C. Proc. Natl. Acad. Sci. USA. 1977;74:3060–3064. doi: 10.1073/pnas.74.7.3060. [DOI] [PMC free article] [PubMed] [Google Scholar]
- 11.Shioi J., Matsuura S., Imae S. J. Bacteriol. 1980;144:891–897. doi: 10.1128/jb.144.3.891-897.1980. [DOI] [PMC free article] [PubMed] [Google Scholar]
- 12.Asai Y., Yakushi T., Kawagishi I., Homma M. J. Mol. Biol. 2003;327:453–463. doi: 10.1016/s0022-2836(03)00096-2. [DOI] [PubMed] [Google Scholar]
- 13.Berg H. C., Turner L. Biophys. J. 1993;65:2201–2216. doi: 10.1016/S0006-3495(93)81278-5. [DOI] [PMC free article] [PubMed] [Google Scholar]
- 14.Ryu W. S., Berry R. M., Berg H. C. Nature. 2000;403:444–447. doi: 10.1038/35000233. [DOI] [PubMed] [Google Scholar]
- 15.Chen X., Berg H. C. Biophys. J. 2000;78:1036–1041. doi: 10.1016/S0006-3495(00)76662-8. [DOI] [PMC free article] [PubMed] [Google Scholar]
- 16.Sowa Y., Hotta H., Homma M., Ishijima A. J. Mol. Biol. 2003;327:1043–1051. doi: 10.1016/s0022-2836(03)00176-1. [DOI] [PubMed] [Google Scholar]
- 17.Block S. M., Berg H. C. Nature. 1984;309:470–472. doi: 10.1038/309470a0. [DOI] [PubMed] [Google Scholar]
- 18.Blair D. F., Berg H. C. Science. 1988;242:1678–1681. doi: 10.1126/science.2849208. [DOI] [PubMed] [Google Scholar]
- 19.Berry R. M., Turner L., Berg H. C. Biophys. J. 1995;69:280–286. doi: 10.1016/S0006-3495(95)79900-3. [DOI] [PMC free article] [PubMed] [Google Scholar]
- 20.Fung D. C., Berg H. C. Nature. 1995;375:809–812. doi: 10.1038/375809a0. [DOI] [PubMed] [Google Scholar]
- 21.Sowa Y., Rowe A. D., Leake M. C., Yakushi T., Homma M., Ishijima A., Berry R. M. Nature. 2005;437:916–919. doi: 10.1038/nature04003. [DOI] [PubMed] [Google Scholar]
- 22.Kalir S., McClure J., Pabbaraju K., Southward C., Ronen M., Leibler S., Surette M. G., Alon U. Science. 2001;292:2080–2083. doi: 10.1126/science.1058758. [DOI] [PubMed] [Google Scholar]
- 23.Kuwajima G. J. Bacteriol. 1988;170:3305–3309. doi: 10.1128/jb.170.7.3305-3309.1988. [DOI] [PMC free article] [PubMed] [Google Scholar]
- 24.Khan S., Dapice M., Reece T. S. J. Mol. Biol. 1988;202:575–584. doi: 10.1016/0022-2836(88)90287-2. [DOI] [PubMed] [Google Scholar]
- 25.Berry R. M., Berg H. C. Biophys. J. 1999;76:580–587. doi: 10.1016/S0006-3495(99)77226-7. [DOI] [PMC free article] [PubMed] [Google Scholar]
- 26.Lo C.-J., Leake M. C., Berry R. M. Biophys. J. 2006;90:357–365. doi: 10.1529/biophysj.105.071332. [DOI] [PMC free article] [PubMed] [Google Scholar]
- 27.Gittes F., Schmidt C. F. Opt. Lett. 1998;23:7–9. doi: 10.1364/ol.23.000007. [DOI] [PubMed] [Google Scholar]
- 28.Rowe A. D., Leake M. C., Morgan H., Berry R. M. J. Mod. Opt. 2003;50:1539–1554. [Google Scholar]
- 29.Leake M. C., Wilson D., Gautel M., Simmons R. M. Biophys. J. 2004;87:1112–1135. doi: 10.1529/biophysj.103.033571. [DOI] [PMC free article] [PubMed] [Google Scholar]
Associated Data
This section collects any data citations, data availability statements, or supplementary materials included in this article.


