Abstract
Nitrogen monoxide (NO) plays a role in the cytotoxic mechanisms of activated macrophages against tumor cells by inducing iron (Fe) release. We have shown that NO-mediated Fe efflux from cells required glutathione (GSH), and we have hypothesized that a GS–Fe–NO complex was released. Hence, we studied the role of the GSH-conjugate transporter multidrug resistance-associated protein 1 (MRP1) in NO-mediated Fe efflux. MCF7-VP cells overexpressing MRP1 exhibited a 3- to 4-fold increase in NO-mediated 59Fe and GSH efflux compared with WT cells (MCF7-WT) over 4 h. Similar results were found for other MRP1-overexpressing cell types but not those expressing another drug efflux pump, P-glycoprotein. NO-mediated 59Fe and GSH efflux were temperature- and energy-dependent and were significantly decreased by the GSH-depleting agent and MRP1 transport inhibitor l-buthionine-[S,R]-sulfoximine. Other MRP1 inhibitors, MK571, probenecid, and difloxacin, significantly inhibited NO-mediated 59Fe release. EPR spectroscopy demonstrated the dinitrosyl-dithiol-Fe complex (DNIC) peak in NO-treated cells was increased by MRP1 inhibitors, indicating inhibited DNIC transport from cells. The extent of DNIC accumulation correlated with the ability of MRP1 inhibitors to prevent NO-mediated 59Fe efflux. MCF7-VP cells were more sensitive than MCF7-WT cells to growth inhibition by effects of NO, which was potentiated by l-buthionine-[S,R]-sulfoximine. These data indicate the importance of GSH in NO-mediated inhibition of proliferation. Collectively, NO stimulates Fe and GSH efflux from cells via MRP1. Active transport of NO by MRP1 overcomes diffusion that is inefficient and nontargeted, which has broad ramifications for understanding NO biology.
Keywords: iron metabolism, iron transport, dinitrosyl iron complexes
Nitrogen monoxide (NO) is an effector molecule with many roles, e.g., smooth muscle relaxation, blood clotting, and the cytotoxicity of activated macrophages (Mφs) against tumors (1–5). The nitric oxide synthase (NOS) family of enzymes generate NO, and many of its functions are mediated by its binding to Fe in heme and nonheme Fe-containing proteins (4–10).
NO cytotoxicity is partly caused by its interaction with the Fe-containing rate-limiting enzyme of DNA synthesis, ribonucleotide reductase (6), and [Fe-S] cluster enzymes, e.g., mitochondrial aconitase (8, 9). Tumor cells cocultured with Mφs exhibit decreased DNA synthesis and a pronounced loss of Fe (1, 2). The Fe released may be from [Fe-S]-containing proteins (2, 8, 11) and could be a complex of NO and thiol-containing ligands e.g., reduced glutathione (GSH) (12–14). Studies using EPR spectroscopy show that NO forms dinitrosyl-dithiol-Fe complexes (DNICs) in Mφs, tumor cells, and other tissues (11, 13, 15).
We investigated NO-mediated 59Fe release from cells and found it to be energy- and temperature-dependent (16, 17). We also reported that glucose metabolism by the hexose monophosphate shunt (HMPS) stimulated NO-mediated Fe efflux from cells (16, 17). Moreover, using the GSH synthesis inhibitor l-buthionine-[S,R]-sulfoximine (BSO), we showed that a product of the HMPS, namely GSH, was essential for NO-mediated Fe release (16–18). We proposed that NO-mediated Fe efflux occurred as a GS–Fe–NO complex, which is exported from cells by energy-dependent transport (17).
In this study, we focused on multidrug resistance-associated protein 1 (MRP1) as a possible transporter responsible for NO-mediated Fe release, as it is a GSH transporter (19). This molecule is ubiquitously expressed and transports other metal-GSH complexes, such as arsenic (As) and antimony (19, 20), and thus, MRP1 may transport DNICs. We show that NO induces Fe and GSH release from cells by active transport via MRP1. These results have broad ramifications for understanding NO biology.
Results
NO-Mediated Fe Efflux Is Greater in MRP1-Hyperexpressing Cells.
Based on our studies (16–18), we examined NO-mediated 59Fe release from several well characterized cell types expressing high MRP1 levels. MCF7-VP cells are well known to hyperexpress MRP1 but not other transporters, e.g., P-glycoprotein (MDR1; refs. 21 and 22). Hence, these cells were implemented to characterize 59Fe and GSH efflux via MRP1 after incubation with NO.
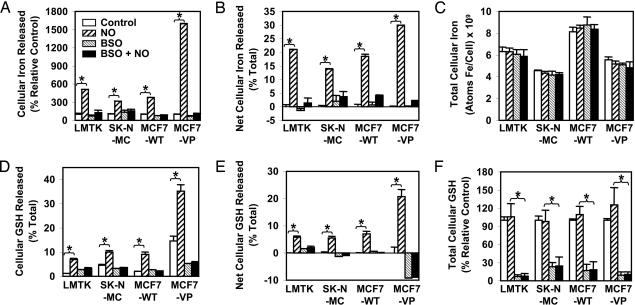
To study whether MRP1 affected NO-mediated 59Fe efflux, in Fig. 1A we compare MCF7-WT and MCF7-VP cells to the well characterized NO-mediated Fe release from LMTK− and SK-N-MC cells (10, 16–18). Cells were prelabeled with the physiological Fe donor 59Fe-transferrin (59Fe-Tf; 0.75 μM) for 3 h at 37°C before being subjected to a Fe efflux assay (Fig. 1A). In all cells, the NO generator spermine-NONOate (SperNO; 0.5 mM) markedly increased cellular 59Fe efflux. 59Fe release from MCF7-WT cells in the presence of NO was similar to that from LMTK− and SK-N-MC cells (Fig. 1A). However, incubation of the MRP1-hyperexpressing MCF7-VP cells with NO led to a significant 4-fold increase in 59Fe release compared with MCF7-WT cells (Fig. 1A).
Fig. 1.
Fe and GSH efflux increases concurrently after incubation with SperNO and is more marked in MRP1-hyperexpressing MCF7-VP cells than in MCF7-WT cells. NO-mediated 59Fe and GSH efflux is inhibited by BSO. NO-mediated 59Fe and GSH efflux was examined by incubating cells with or without 0.1 mM BSO for 20 h at 37°C followed by labeling with 59Fe-Tf (0.75 μM) for 3 h at 37°C. Cells were then washed and reincubated for 3 h at 37°C in the presence or absence of SperNO (0.5 mM). (A) NO-mediated 59Fe efflux results are expressed as a % control. (B) Results were calculated as a % total cell 59Fe. These data are expressed as net 59Fe efflux over that found for the control. (C) Total cellular 59Fe (i.e., cell 59Fe plus efflux 59Fe). (D) NO-mediated GSH efflux expressed as % total GSH. (E) GSH efflux data expressed as net GSH efflux over that found for the control. (F) Total GSH measured showing GSH levels in the presence or absence of BSO. Results are mean ± SD (four determinations) in a typical experiment of four. ∗, P < 0.0001.
Previously, we showed the GSH synthesis inhibitor BSO prevented NO-mediated 59Fe release from a variety of cells (16–18). Further, BSO is known to effectively prevent GSH-dependent MRP1 transport (19, 23). Preincubation of cells with BSO (0.1 mM) for 20 h prevents the NO-mediated increase in 59Fe release from all cells, including MCF7-VP (Fig. 1A). Hence, increased MRP1 expression results in marked NO-mediated 59Fe release, and GSH depletion prevents 59Fe efflux (Fig. 1A). We also analyzed the results as net Fe efflux expressed as a percentage of total 59Fe (i.e., total 59Fe = cell 59Fe + efflux 59Fe; Fig. 1B). This finding also shows that MCF7-VP cells had a significant increase in NO-mediated Fe efflux compared with MCF7-WT cells (Fig. 1B). For each cell type under all conditions, there was no change in total 59Fe compared with the control (Fig. 1C).
We previously showed cellular 59Fe release with a range of NO donors, e.g., SperNO, S-nitroso-N-acetylpenicillamine, and S-nitrosoglutathione, but not with their precursors that do not contain NO•, namely spermine, N-acetylpenicillamine, or GSH, respectively (10, 16, 17). These agents also did not affect cell viability (10, 16, 17).
Studies with another cell line that hyperexpresses MRP1 (i.e., MCF7-ADR) showed similar results to those for MCF7-VP. In contrast, there was no difference in NO-mediated 59Fe release comparing CCRF-CEM VLB-100 cells that hyperexpress MDR1 (24) to WT CCRF-CEM cells (unpublished data).
MRP1-Hyperexpressing Cells Show Increased GSH Efflux in the Presence of NO.
Because we showed that GSH depletion inhibits NO-mediated Fe release (16–18), we examined whether NO-mediated 59Fe release (Fig. 1A) was associated with GSH efflux (Fig. 1D). We found that GSH release from MCF7-VP cells was significantly greater than from MCF7-WT cells and was markedly increased by NO (Fig. 1D). Moreover, preincubation of cells with BSO prevents GSH release from cells incubated with NO (Fig. 1D). Similar to net 59Fe efflux (Fig. 1B), there was significantly increased net GSH release compared with the control for all cells after NO treatment (Fig. 1E). MRP1-hyperexpressing MCF7-VP cells released significantly greater GSH than MCF7-WT cells (Fig. 1E). BSO was shown to cause a pronounced decrease in total GSH to 10–30% of the control (Fig. 1F).
NO-Mediated 59Fe and GSH Efflux Is Greater in MCF7-VP Cells Compared with MCF7-WT Cells as a Function of Time and SperNO Concentration.
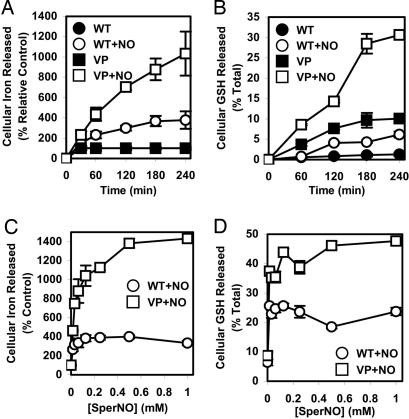
To further assess NO-mediated 59Fe and GSH efflux from MCF7-WT and MCF7-VP cells, time-course studies were done, reincubating 59Fe-prelabeled cells with SperNO (0.5 mM) at 37°C (Fig. 2A and B). For both cell lines, there was a significant increase in NO-mediated 59Fe efflux (Fig. 2A) and GSH release (Fig. 2B) with time compared with cells treated with control media. This release was markedly greater from MCF7-VP cells than MCF7-WT cells (Fig. 2 A and B).
Fig. 2.
Comparison of 59Fe and GSH efflux from MRP1-hyperexpressing MCF7-VP cells and parental MCF7-WT cells as a function of time (A and B) and SperNO concentration (C and D). (A and B) Cells were labeled for 3 h at 37°C with 59Fe-Tf (0.75 μM), washed, and reincubated in the presence or absence of SperNO (0.5 mM) for 30–240 min. The release of 59Fe (A) and GSH (B) from the cells was then assessed. (C and D) Cells were prelabeled and washed as above and reincubated with SperNO (0.016–1 mM) for 3 h at 37°C. 59Fe (C) and GSH (D) efflux was then assessed. Results are mean ± SD (four determinations) in a typical experiment of four.
59Fe and GSH release from MCF7-WT and MCF7-VP cells was also examined as a function of SperNO concentration (Fig. 2 C and D). Even at the lowest SperNO concentration (0.016 mM), NO-mediated 59Fe (Fig. 2C) and GSH release (Fig. 2D) was significantly greater in MCF7-VP cells than in MCF7-WT cells. The 59Fe and GSH efflux was significantly greater in MCF7-VP cells than MCF7-WT cells at all SperNO concentrations (Fig. 2 C and D).
NO-Mediated 59Fe and GSH Efflux Was Temperature- and ATP-Dependent.
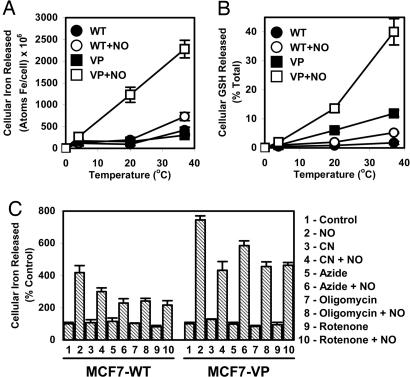
To assess whether 59Fe and GSH efflux was the result of metabolic processes, the NO-mediated release of 59Fe and GSH was determined as a function of temperature and in the presence of metabolic inhibitors. The MCF7-WT and MCF7-VP cells were prelabeled with 59Fe-Tf (0.75 μM) for 3 h at 37°C, washed, and reincubated at 4°C, 20°C, or 37°C for 3 h in the presence or absence of SperNO (0.5 mM). Efflux of 59Fe (Fig. 3A) and GSH (Fig. 3B) was temperature-dependent in the presence and absence of NO. This effect was most pronounced for MCF7-VP cells (Fig. 3 A and B). These results illustrate temperature dependence and suggest an active process. The metabolic inhibitors cyanide (5 mM), azide (30 mM), oligomycin (15 μM), and rotenone (20 μM) (16), which decrease ATP levels (data not shown), all significantly decrease NO-mediated 59Fe release compared with cells incubated with NO alone (Fig. 3C). This finding suggests NO-mediated 59Fe release was an active process.
Fig. 3.
NO-mediated 59Fe and GSH efflux from MCF7-WT cells and MRP1-hyperexpressing MCF7-VP cells is temperature-dependent (A and B), and NO-mediated 59Fe efflux is decreased by metabolic inhibitors (C). (A) Cells were prelabeled for 3 h at 37°C with 59Fe-Tf (0.75 μM), washed, and reincubated for 3 h with or without SperNO (0.5 mM) at 4°C, 20°C, or 37°C, and 59Fe release was assessed. (B) Cells were incubated as in A but assessed for GSH release. (C) Cells were prelabeled as in A, washed, and then incubated for 30 min at 37°C with or without cyanide (CN; 5 mM), azide (30 mM), oligomycin (15 μM), or rotenone (20 μM). Cells were then incubated for 3 h at 37°C with or without SperNO (0.5 mM) in the presence or absence of the inhibitors. Results are mean ± SD (four determinations) from a typical experiment of four.
MRP1 Inhibitors Decrease NO-Mediated 59Fe Efflux.
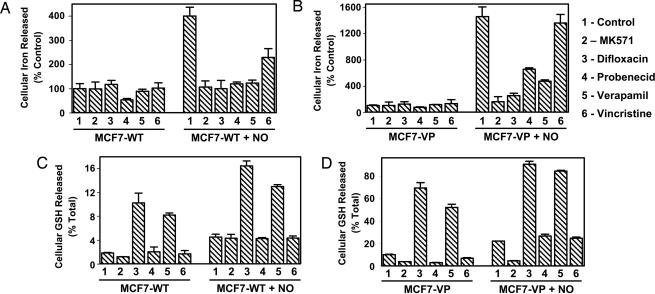
To further assess the role of MRP1 in NO-mediated 59Fe and GSH efflux, cells were preincubated with MRP1 inhibitors. These included MK571 (20 μM), difloxacin (20 μM), probenecid (500 μM), the substrate vincristine (VCR) (20 μM), which acts as a competitive inhibitor, and verapamil (20 μM), which inhibits MRP1 via GSH depletion (25–28). Incubation of MCF7-WT and MCF7-VP cells with MK571, difloxacin, probenecid, or verapamil significantly decreased NO-mediated 59Fe efflux (Fig. 4A and B). The VCR results differed, as a significant decrease in NO-mediated 59Fe efflux was observed only in MCF7-WT cells (Fig. 4A), whereas no decrease was seen in MCF7-VP cells (Fig. 4B). This difference could be because VCR is a weak competitive inhibitor and may not prevent transport activity in MCF7-VP cells because of their high MRP1 levels.
Fig. 4.
Effect of MRP1 inhibitors on NO-mediated 59Fe (A and B) and GSH release (C and D) from MCF7-WT cells and MRP1-hyperexpressing MCF7-VP cells. MRP1 inhibitors used were: MK571 (20 μM), difloxacin (20 μM), probenecid (0.5 mM), verapamil (20 μM), or VCR (20 μM). (A and B) Cells were labeled for 3 h at 37°C with 59Fe-Tf (0.75 μM), washed, and reincubated for 30 min at 37°C with the inhibitors. A further 3-h incubation at 37°C was performed with the inhibitors in the presence or absence of SperNO (0.5 mM), and 59Fe efflux was assessed. (C and D) Cells were incubated as in A and B, and GSH release was examined. The results are mean ± SD (four determinations) from a typical experiment of four.
Effect of MRP1 Inhibitors on GSH Efflux from MCF7-WT and MCF7-VP Cells.
We showed that MK571, probenecid, and VCR had little effect on GSH release compared with control cells (Fig. 4C). In contrast, verapamil and difloxacin significantly increased GSH efflux from MCF7-WT cells to 3- to 5-fold that of the control in the presence and absence of NO, respectively (Fig. 4C). The effect of verapamil at inhibiting MRP1 activity by inducing GSH efflux has been described (25), and here we report that difloxacin acts similarly.
GSH release from MCF7-VP control cells (Fig. 4D) was significantly greater than that from MCF7-WT control cells (Fig. 4C) in the presence and absence of NO, because of higher expression of MRP1 in MCF7-VP cells than MCF7-WT cells (21, 22). Incubation of MCF7-VP cells with MK571 significantly decreased GSH release compared with the control in the presence and absence of SperNO (0.5 mM) (Fig. 4D). In the absence of NO, probenecid and VCR significantly decreased GSH efflux from MCF7-VP cells (Fig. 4D). In contrast, in the presence of NO, probenecid and VCR had no significant effect on GSH efflux from VP cells when compared with the control (Fig. 4D). As found for MCF7-WT cells (Fig. 4C), incubation of MCF7-VP cells with difloxacin and verapamil resulted in a marked increase in GSH release over that found for the control in the presence and absence of NO (Fig. 4D). However, in the presence of NO, GSH efflux from MCF7-VP cells stimulated by verapamil and difloxacin was significantly greater than that found in the absence of NO (Fig. 4D). Despite the marked increase of GSH release compared with the control in the presence of verapamil and difloxacin in MCF7-VP cells (Fig. 4D), the NO-mediated 59Fe release in the presence of these inhibitors was significantly decreased compared with the control (Fig. 4B). These data suggest that in the presence of verapamil or difloxacin 59Fe and GSH can be separately transported by MRP1.
MRP1 Inhibitors Result in DNIC Accumulation in Cells.
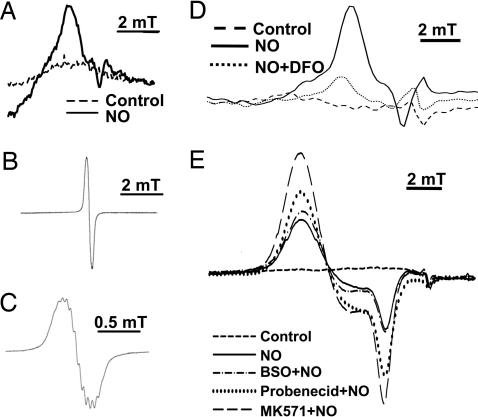
To determine the species formed by NO intracellularly, EPR spectroscopy was used. This method has been used to identify DNICs after exposure to NO (11–15). MCF7-VP cells were incubated for 3 h at 37°C with SperNO (0.5 mM), and then examined by EPR spectroscopy at room temperature (293 K; Fig. 5A–C) and liquid nitrogen temperature (77 K; Fig. 5 D and E). These studies were done to differentiate between protein-bound and low molecular weight (Mr) complexes that cannot be differentiated at 77 K alone (14). EPR analysis performed at 293 K resulted in the detection of low-intensity, broad, anisotropic signals, with no resolvable fine structure (Fig. 5A). These signals were observed only on addition of NO (Fig. 5A). The nature of these EPR signals suggests the nitrosyl–Fe complex observed is formed by the interaction with protein thiols (14, 29). We compared this spectrum with a synthetic low Mr DNIC, namely a dinitrosyl-diglutathionyl-Fe complex (30, 31), which gives much sharper, isotropic EPR signals at 293 K (Fig. 5B) that have resolvable fine structure (Fig. 5C) (14, 30, 31). Hence, in cells at least part of the NO is present as protein–nitrosyl complexes that may be in equilibrium with low Mr DNICs.
Fig. 5.
EPR spectroscopy shows that SperNO results in DNIC formation and incubation with MRP1 inhibitors increases intracellular DNICs. (A) Room- temperature (293 K) EPR spectra after incubation of MCF7-VP cells (1010 cells) with SperNO (0.5 mM) or control medium for 3 h at 37°C. (B) Room-temperature EPR spectra observed with a synthetic dinitrosyl-diglutathionyl-Fe complex (50 μM; refs. 30 and 31). (C) A demonstration of an expansion of B showing resolvable fine structure. (D) Low-temperature EPR (77 K) spectra of MCF7-VP cells (1010 cells) pretreated for 20 h at 37°C with or without desferrioxamine (DFO; 0.1 mM) and then incubated with SperNO (0.5 mM) for 3 h at 37°C. (E) Low-temperature EPR spectra (77 K) of MCF7-VP cells preincubated with media alone (control) or the GSH synthesis inhibitor BSO for 20 h at 37°C. The cells were then washed and incubated for 3 h at 37°C in the presence or absence of SperNO (0.5 mM). Alternatively, cells were incubated for 30 min with medium alone (control) or the MRP1 inhibitors probenecid (0.5 mM) or MK571 (20 μM), and then SperNO (0.5 mM) was added and the incubation continued for 3 h at 37°C. The signal obtained with cells in the absence of SperNO has been subtracted from the spectra in D and E. Results are typical spectra from six experiments.
Identical experiments using NO-treated cells and EPR at low temperature (77 K) gave similar broad, but more intense, signals (Fig. 5D). Thus, all further experiments were performed at low temperature (77 K). EPR signals in cells after NO treatment were markedly decreased by a 20-h pretreatment with the Fe chelator desferrioxamine (0.1 mM; Fig. 5D). These studies indicated that the complex contained Fe and was susceptible to chelation. Indeed, the EPR signal observed at 77 K can be assigned to an immobilized DNIC (11–14, 30, 31).
Pretreatment of MCF7-VP cells with MRP1 inhibitors resulted in the detection of more intense EPR signals relative to cells incubated with SperNO alone (Fig. 5E). The increase in signal intensity after incubation with MK571 and NO was significantly greater compared with NO alone (Fig. 5E). The lower efficacy of probenecid at increasing intracellular DNIC concentration (Fig. 5E) was consistent with its lower activity at inhibiting NO-mediated 59Fe efflux from MCF7-VP cells (Fig. 4B). These results indicate MRP1 inhibitors increased the intracellular DNIC concentration, which was in agreement with the decreased release of 59Fe complexes by MRP1. The GSH synthesis inhibitor BSO (0.1 mM) had less effect on DNIC signal intensity than MK571 or probenecid, indicating little DNIC accumulation in cells compared with those treated with SperNO alone (Fig. 5E). This finding may be caused by BSO markedly decreasing GSH (Fig. 1F), which is vital for mediating Fe release from protein-bound DNICs (32, 33).
Effect of NO on the Proliferation of the MCF7-WT and MCF7-VP Cells in the Presence and Absence of BSO.
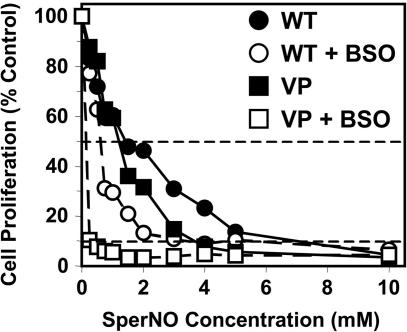
The unexpected relationship between GSH, NO, and 59Fe release, and the role of MRP1 in NO-mediated 59Fe and GSH transport, suggested modulation of GSH could affect the efficacy of NO at inhibiting proliferation. Hence, the effect of NO and GSH depletion with BSO on proliferation was assessed by using MCF7-WT and MCF7–VP cells. Cells were preincubated with or without BSO (0.1 mM) for 20 h at 37°C after which they were incubated with SperNO (0.25–10 mM) for 24 h at 37°C and proliferation was assessed (Fig. 6). In the absence of BSO, the ability of NO to inhibit proliferation was more marked in MCF7-VP cells than MCF7–WT cells (Fig. 6), with the concentrations that inhibit proliferation by 50% and 90% (IC50 and IC90) being 1.26 ± 0.48 mM and 3.68 ± 0.40 mM for MCF7-VP cells compared with 1.42 ± 0.53 mM and 7.05 ± 1.48 mM for MCF7–WT cells, respectively (Fig. 6). After BSO treatment, the IC50 and IC90 values decreased significantly in the MCF7–VP line to 0.15 ± 0.10 mM and 0.28 ± 0.10 mM, respectively. For MCF7-WT cells incubated with BSO, IC50 and IC90 decreased to 0.58 ± 0.07 mM and 3.68 ± 3.51 mM, respectively. Thus, MRP1 hyperexpression leads to greater sensitivity to NO. Moreover, GSH depletion increased NO antiproliferative efficacy, particularly in MCF7-VP cells with high MRP1 levels.
Fig. 6.
Cells hyperexpressing MRP1 (MCF7-VP) are more sensitive than MCF7-WT cells to the antiproliferative effects of SperNO and this effect is potentiated by GSH depletion with BSO. Cells were preincubated with media alone or media containing BSO (0.1 mM) for 20 h at 37°C. The cells were then incubated in the presence of SperNO (0.25–10 mM) for 24 h at 37°C. Horizontal dashed lines indicate concentrations that inhibit proliferation by 50% (IC50) and 90% (IC90). Results are the means of four experiments.
Discussion
NO is produced by Mφs and acts as a cytotoxic effector that mediates Fe release from tumor cells (1–5). Moreover, NO plays many roles, and understanding its mechanisms of transport and export from cells is vital for comprehending its effector functions. We previously showed that glucose metabolism by the hexose monophosphate shunt and the subsequent generation of GSH markedly enhanced NO-mediated Fe efflux from cells (16–18). We demonstrate herein that NO stimulates GSH and Fe efflux from cells by active transport via MRP1.
The finding that MRP1 plays roles in Fe and GSH release is important, because this transporter is ubiquitously expressed (19) and may act as a physiological NO-stimulated transport mechanism. Indeed, apart from the role of MRP1 in drug efflux, this transporter plays physiological roles in GSH export (19). Earlier studies showed MRP1 transports GSH coordinated to metals, such as As and antimony (19, 20), but a role in Fe transport has not been proposed.
We show MRP1 is involved in NO-mediated Fe and GSH efflux from studies demonstrating that: (i) NO-mediated 59Fe and GSH efflux is greater in cell types hyperexpressing MRP1 but not MDR1; (ii) 59Fe and GSH efflux occur by temperature- and metabolic energy-dependent mechanisms consistent with active transport; (iii) the GSH-depleting agent and MRP1 inhibitor BSO (16–19, 23) markedly prevent NO-mediated-59Fe and GSH efflux; (iv) MRP1 inhibitors prevent NO-mediated 59Fe efflux; (v) potent inhibitors of MRP1 transport cause intracellular build-up of EPR-detectable DNICs; (vi) the extent of DNIC accumulation correlates with the ability of MRP1 inhibitors to prevent NO-mediated 59Fe efflux from MRP1 hyperexpressing cells; and (vii) tumor cells hyperexpressing MRP1 are more sensitive to the antiproliferative effects of NO than WT cells.
“Free NO” has a short half-life (t1/2) of 2 ms–2 s, but DNICs increase NO t1/2 and are natural carriers of NO (30–36). In fact, glutatione S-transferase, an enzyme associated with MRP1, can increase the t1/2 of DNICs to 4.5–8 h (30, 31). DNICs can donate Fe to cells and transnitrosylate targets and increase the bioavailability and efficiency of NO transport (29, 34, 35).
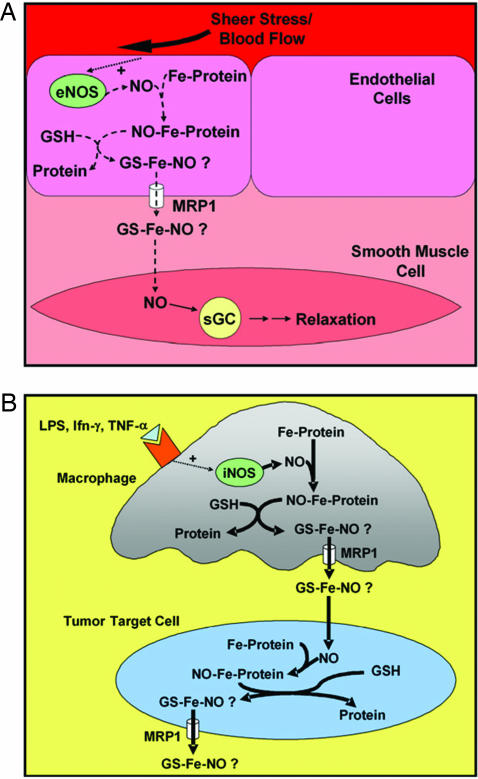
The efficient efflux of DNICs by active transport could be crucial at sites where NO is produced in minute amounts as a messenger, e.g., in blood vessels where small quantities of DNICs released from endothelial cells could be vital for regulating smooth muscle tone (refs. 7 and 33; Fig. 7). The ability of cells to actively transport NO overcomes diffusion that is inefficient and nontargeted. Conversely, where NO is used as a cytotoxic effector, the substantial quantities generated by inducible NOS of Mφs could lead to the efflux of large quantities of Fe and GSH from tumor cells (Fig. 7). Because Fe and GSH are critical for proliferation (5, 19), their release from tumor cells in large amounts would be cytotoxic. This hypothesis is supported by studies where Mφs induced marked Fe release from tumor targets (1), an effect mediated by NO (2). GSH efflux is a key signal mediating apoptosis (37), and it is well known that cell Fe mobilization by chelators results in antitumor activity (38). Hence, the dual action of NO leading to Fe and GSH release may play a role in cytotoxicity of Mφs against tumors. We show that under conditions leading to Fe and GSH efflux MCF7-VP cells hyperexpressing MRP1 were more sensitive to NO than WT cells. This finding supports the hypothesis that enhanced GSH and Fe efflux from cells hyperexpressing MRP1 leads to greater antiproliferative activity.
Fig. 7.
Schematic illustration of the interdependence of Fe, NO, GSH, and MRP1 and the hypothetical consequences of DNIC efflux. (A) The efficient efflux of DNICs by active transport by MRP1 may be crucial where NO is produced in small quantities, e.g., in blood vessels where endothelial NOS (eNOS) generates NO to effect smooth muscle relaxation. (B) When NO is generated in large amounts, e.g., by inducible NOS (iNOS) of Mφs, it could lead to substantial Fe and GSH efflux from tumor cells and induce cytotoxicity.
The role of GSH in NO-mediated Fe release may not only be critical for its transport out of the cell by the GSH transporter MRP1. In accordance with previous studies (32, 33), we also hypothesize that GSH is vital for NO and Fe release from proteins targeted by NO, e.g., those with [Fe-S] clusters (4). Thus, we suggest there is equilibrium between protein-bound DNICs and low Mr DNICs and that GSH is vital for the conversion to the low Mr form, which is transported out of the cell by MRP1. This idea is supported by our studies showing that incubation of cells with BSO prevented GSH and 59Fe release and MRP1 transport inhibitors caused DNIC accumulation. Our hypothesis is consistent with studies indicating GSH or cysteine are needed for DNIC release from [Fe-S] clusters (32, 39).
Transport of GSH and its substrates by MRP1 occurs via multiple mechanisms (19). We suggest a complex of Fe, GSH, and NO are effluxed together as found for the As(GS)3 complex (19, 20). Alternatively, Fe and GSH may be separately transported by MRP1, which does occur in the presence of verapamil and difloxacin (Fig. 4 B and D). However, under physiological conditions, we favor the transport of a complex, as we detected intracellular DNICs directly by EPR, which accumulate after incubation with MRP1 inhibitors.
In summary, NO mediates Fe and GSH efflux from cells by the GSH transporter MRP1. The ability of cells to actively transport NO overcomes the random process of diffusion that is inefficient and nontargeted. Our results are relevant to NO transport, intracellular and extracellular NO signaling, NO-mediated apoptosis, and the cytotoxicity of Mφs (3) that are caused, in part, by Fe release from tumor targets (1, 2).
Materials and Methods
Tissue Culture.
SK-N-MC neuroepithelioma cells and MCF-7 breast cancer cells were from the American Type Culture Collection. Mouse LMTK− fibroblasts were obtained from the European Collection of Animal Cell Cultures, Salisbury, U.K. The MRP1-hyperexpressing cell line, MCF7-VP, and MDR1-overexpressing cell line, CCRF-CEM VLB 100, and its parent cell type (CCRF-CEM) were from M. Kavallaris (Children's Cancer Institute for Medical Research). The MCF7-ADR cell line that also hyperexpresses MRP1 (22) was from K. Cowan (University of Nebraska, Lincoln).
Protein Labeling.
Apo-Tf was labeled with 59Fe (DuPont) or 56Fe (16).
Efflux of 59Fe and GSH: General Protocol.
Standard methods examined the effect of NO and other agents on 59Fe and GSH efflux (10, 16). Cells were labeled with 59Fe-Tf ([protein] = 0.75 μM; [Fe] = 1.5 μM) for 3 h at 37°C. The cells were then washed four times and reincubated in the treatment medium as indicated. The supernatants and cell pellets were collected for measurement of 59Fe and GSH.
Effect of Inhibitors on Fe Efflux.
Cells were prelabeled for 3 h with 59Fe-Tf as above, washed, and then preincubated for 30 min at 37°C with media containing the inhibitors by using established methods (16). The cells were then incubated for 3 h at 37°C with inhibitors in the presence or absence of NO. The concentrations of all inhibitors used were those that have been shown to be effective in previous studies and did not cause toxicity.
Cell Proliferation and GSH and ATP Assays.
Proliferation was assessed by the MTT method (38). GSH was assayed as described (40). ATP was measured by the Enliten ATP Assay (Promega).
EPR Spectroscopy.
Cells were treated with NO as per the 59Fe efflux protocol with 56Fe-Tf. Cells were transferred to an EPR tube, and spectra were recorded with a Bruker (Billerica, MA) EMX spectrometer with 100-kHz modulation.
Statistics.
Data were compared by using Student's t test. Results were considered statistically significant when P < 0.05. Statistical analyses to compare DNIC concentrations measured by EPR were done by repeated-measures one-way ANOVA with Dunnett's post hoc test.
Acknowledgments
This work was supported by the Australian Research Council and the Canadian Institutes of Health Research.
Abbreviations
- NO
nitrogen monoxide
- GSH
glutathione
- MRP1
multidrug resistance-associated protein 1
- DNIC
dinitrosyl-dithiol-Fe complex
- NOS
nitric oxide synthase
- Mφ
macrophage
- BSO
l-buthionine-[S,R]-sulfoximine
- Tf
transferrin
- SperNO
spermine-NONOate
- VCR
vincristine.
Footnotes
Conflict of interest statement: No conflicts declared.
References
- 1.Hibbs J. B., Jr., Taintor R. R., Vavrin Z. Biochem. Biophys. Res. Commun. 1984;123:716–723. doi: 10.1016/0006-291x(84)90288-2. [DOI] [PubMed] [Google Scholar]
- 2.Hibbs J. B., Jr., Taintor R. R., Vavrin Z., Rachlin E. M. Biochem. Biophys. Res. Commun. 1988;157:87–94. doi: 10.1016/s0006-291x(88)80015-9. [DOI] [PubMed] [Google Scholar]
- 3.Stuehr D. J., Nathan C. F. J. Exp. Med. 1989;169:1543–1555. doi: 10.1084/jem.169.5.1543. [DOI] [PMC free article] [PubMed] [Google Scholar]
- 4.Stamler J. S., Singel D. J., Loscalzo J. Science. 1992;258:1898–1902. doi: 10.1126/science.1281928. [DOI] [PubMed] [Google Scholar]
- 5.Richardson D. R., Ponka P. Biochim. Biophys. Acta. 1997;1331:1–40. doi: 10.1016/s0304-4157(96)00014-7. [DOI] [PubMed] [Google Scholar]
- 6.Lepoivre M., Fieschi F., Coves J., Thelander L., Fontecave M. Biochem. Biophys. Res. Commun. 1991;179:442–448. doi: 10.1016/0006-291x(91)91390-x. [DOI] [PubMed] [Google Scholar]
- 7.Ignarro L. J. Blood Vessels. 1991;28:67–73. doi: 10.1159/000158845. [DOI] [PubMed] [Google Scholar]
- 8.Drapier J.-C., Hibbs J. B., Jr. J. Clin. Invest. 1986;78:790–797. doi: 10.1172/JCI112642. [DOI] [PMC free article] [PubMed] [Google Scholar]
- 9.Drapier J.-C., Hibbs J. B., Jr. J. Immunol. 1988;140:2829–2838. [PubMed] [Google Scholar]
- 10.Wardrop S. L., Watts R. N., Richardson D. R. Biochemistry. 2000;39:2748–2758. doi: 10.1021/bi991099t. [DOI] [PubMed] [Google Scholar]
- 11.Pellat C., Henry Y., Drapier J.-C. Biochem. Biophys. Res. Commun. 1990;166:119–125. doi: 10.1016/0006-291x(90)91919-j. [DOI] [PubMed] [Google Scholar]
- 12.Vanin A. F., Bliumenfel'd L. A., Chetverikov A. G. Biofizika. 1967;12:829–841. [PubMed] [Google Scholar]
- 13.Vanin A. F., Men'shikov G. B., Moroz I. A., Mordvintcev P. I., Serezhenkov V. A., Burbaev D. S. Biochim. Biophys. Acta. 1992;1135:275–279. doi: 10.1016/0167-4889(92)90231-y. [DOI] [PubMed] [Google Scholar]
- 14.Woolum J. C., Tiezzi E., Commoner B. Biochim. Biophys. Acta. 1968;160:311–320. doi: 10.1016/0005-2795(68)90204-3. [DOI] [PubMed] [Google Scholar]
- 15.Bastian N. R., Yim C.-Y., Hibbs J. B., Jr., Samlovski W. E. J. Biol. Chem. 1994;269:5127–5131. [PubMed] [Google Scholar]
- 16.Watts R. N., Richardson D. R. J. Biol. Chem. 2001;276:4724–4732. doi: 10.1074/jbc.M006318200. [DOI] [PubMed] [Google Scholar]
- 17.Watts R. N., Richardson D. R. Eur. J. Biochem. 2002;269:3383–3392. doi: 10.1046/j.1432-1033.2002.02987.x. [DOI] [PubMed] [Google Scholar]
- 18.Watts R. N., Richardson D. R. Biochim. Biophys. Acta. 2004;1692:1–15. doi: 10.1016/j.bbamcr.2004.02.004. [DOI] [PubMed] [Google Scholar]
- 19.Ballatori N., Hammond C. L., Cunningham J. B., Krance S. M., Marchan R. Toxicol. Appl. Pharmacol. 2005;204:238–255. doi: 10.1016/j.taap.2004.09.008. [DOI] [PubMed] [Google Scholar]
- 20.Leslie E. M., Haimeur A., Waalkes M. P. J. Biol. Chem. 2004;279:32700–32708. doi: 10.1074/jbc.M404912200. [DOI] [PubMed] [Google Scholar]
- 21.Schneider E., Horton J. K., Yang C. H., Nakagawa M., Cowan K. H. Cancer Res. 1994;54:152–158. [PubMed] [Google Scholar]
- 22.Benderra Z., Trussardi A., Morjani H., Villa A. M., Doglia S. M., Manfait M. Eur. J. Cancer. 2000;36:428–434. doi: 10.1016/s0959-8049(99)00288-9. [DOI] [PubMed] [Google Scholar]
- 23.Versantvoort C. H., Broxterman H. J., Bagrij T., Scheper R. J., Twentyman P. R. Br. J. Cancer. 1995;72:82–89. doi: 10.1038/bjc.1995.281. [DOI] [PMC free article] [PubMed] [Google Scholar]
- 24.Davey R. A., Davey M. W., Cullen K. V., Wells X. E., Francis C. L., Williams H. M., Yang Q., Moghaddam M. J., Widmer F., Whittaker R. G. Br. J. Pharmacol. 2002;137:1280–1286. doi: 10.1038/sj.bjp.0704983. [DOI] [PMC free article] [PubMed] [Google Scholar]
- 25.Cullen K. V., Davey R. A., Davey M. W. Biochem. Pharmacol. 2001;62:417–424. doi: 10.1016/s0006-2952(01)00681-5. [DOI] [PubMed] [Google Scholar]
- 26.Leier I., Jedlitschky G., Buchholz U., Center M., Cole S. P., Deeley R. G., Keppler D. Biochem. J. 1996;314:433–437. doi: 10.1042/bj3140433. [DOI] [PMC free article] [PubMed] [Google Scholar]
- 27.Gollapudi S., Kim C. H., Tran B.-N., Sangha S., Gupta S. Cancer Chem. Pharmacol. 1997;40:150–158. doi: 10.1007/s002800050640. [DOI] [PubMed] [Google Scholar]
- 28.Norris M. D., Madafiglio J., Gilbert J., Marshall G. M., Haber M. Med. Ped. Oncol. 2001;36:177–180. doi: 10.1002/1096-911X(20010101)36:1<177::AID-MPO1042>3.0.CO;2-Q. [DOI] [PubMed] [Google Scholar]
- 29.Boese M., Mordvintcev P. I., Vanin A. F., Busse R., Mulsch A. J. Biol. Chem. 1995;270:29244–29249. doi: 10.1074/jbc.270.49.29244. [DOI] [PubMed] [Google Scholar]
- 30.de Maria F., Pedersen J. Z., Caccuri A. M., Antonini G., Turella P., Stella L., lo Bello M., Federici G., Ricci G. J. Biol. Chem. 2003;278:42283–42293. doi: 10.1074/jbc.M305568200. [DOI] [PubMed] [Google Scholar]
- 31.Turella P., Pedersen J. Z., Caccuri A. M., de Maria F., Mastroberardino P., lo Bello M., Federici G., Ricci G. J. Biol. Chem. 2003;278:42294–42299. doi: 10.1074/jbc.M305569200. [DOI] [PubMed] [Google Scholar]
- 32.Rogers P. A., Ding H. J. Biol. Chem. 2001;276:30980–30986. doi: 10.1074/jbc.M101037200. [DOI] [PubMed] [Google Scholar]
- 33.Mulsch A., Mordvintcev P., Vanin A. F., Busse R. FEBS Lett. 1991;294:252–256. doi: 10.1016/0014-5793(91)81441-a. [DOI] [PubMed] [Google Scholar]
- 34.Ueno T., Suzuki Y., Fujii S., Vanin A. F., Yoshimaru T. Biochem. Pharmacol. 2002;63:485–493. doi: 10.1016/s0006-2952(01)00869-3. [DOI] [PubMed] [Google Scholar]
- 35.Ueno T., Suzuki Y., Fujii S., Vanin A. F., Yoshimura T. Free Radical Res. 1999;31:525–534. doi: 10.1080/10715769900301101. [DOI] [PubMed] [Google Scholar]
- 36.Thomas D. D., Liu X., Kantrow S. P., Lancaster J. R., Jr. Proc. Natl. Acad. Sci. USA. 2001;98:355–360. doi: 10.1073/pnas.011379598. [DOI] [PMC free article] [PubMed] [Google Scholar]
- 37.He Y.-Y., Huang J. L., Ramirez D. C., Chignell C. F. J. Biol. Chem. 2003;278:8058–8064. doi: 10.1074/jbc.M207781200. [DOI] [PubMed] [Google Scholar]
- 38.Richardson D. R., Tran E., Ponka P. Blood. 1995;86:4295–4306. [PubMed] [Google Scholar]
- 39.Ding H., Demple B. Proc. Natl. Acad. Sci. USA. 1996;93:9449–9453. doi: 10.1073/pnas.93.18.9449. [DOI] [PMC free article] [PubMed] [Google Scholar]
- 40.Baker M. A., Cerniglia G. J., Zaman A. Anal. Biochem. 1990;190:360–365. doi: 10.1016/0003-2697(90)90208-q. [DOI] [PubMed] [Google Scholar]


