

Abstract
Silica-based lectin microcolumns are described in this study together with the chemical procedures necessary for their preparation. The analytical merits of Canavalia ensiformis and Sambucus nigra lectins, [immobilized on activated macroporous silica], such as binding capacity, trapping reproducibility, and substrate selectivity, have been evaluated using model glycoproteins. The described microcolumns are applicable to high-pressure analytical schemes utilizing microvalving procedures, washing steps, and quantitative desorption for LC/MS analysis. The described analytical systems are amenable to the applications aiming at fractionation of complex glycopeptide mixtures and determination of the sites of glycosylation.
High-performance affinity chromatography (HPAC) offers a number of advantages1-4 over the classical and commonly used chromatographic technique which utilizes various immobilized ligands to retain selectively an analyte or a group of analytes. These advantages primarily include speed, ease of automation, and the application versatility. During the past decade, HPAC has been employed in biomolecular purification and enrichment and chiral separations, as well as in the study of biological interactions.5-7 The success of any affinity chromatography, including HPAC, is largely dependent on chemical procedures employed in the attachment of a small-molecule ligand or an interacting biopolymer to a respective chromatographic support.8-10 Their immobilization should not interfere with the native state of a ligand, facilitating access of analyte molecules and proper interactions.
Lectins comprise a group of proteins with unique affinities toward carbohydrate structures. They have long been used in biomolecular isolation, carbohydrate chemistry, and histochemistry, and more recently as the mimicking agents in intercellular interaction studies. For a number of years, lectins have been utilized in various glycoprotein isolation efforts,11-14 albeit few addressed the quantitative aspects of this approach.15,16 Lectins with different specificities toward oligosaccharides have been immobilized to agarose and other conventional biochemical matrixes.11-14 Some of these column materials have been commercialized. In addition, lectins have been immobilized to magnetic beads,17 gold foils,18 silica materials,19-21 and to affinity membranes.22
The uses of lectins in contemporary glycoproteomics and glycomics are likely to grow due to the frequent needs for fractionation and preconcentration for high-sensitivity mass spectrometry (MS).23 Although glycoproteins and glycopeptides could be fractionated through lectins with different specificity, in most reported cases, lectin affinity procedures were employed to isolate the entire pools of glycoconjugates rather than specific structures.24,25 Consequently, wheat germ agglutinin and concanavalin A have been widely used because of their broad specificity. Although it is assumed that different glycoproteins produced by a certain cell type possess a similar type of glycans, typically observed microheterogeneities display slight differences in structure. This may not drastically alter glycoprotein affinity to a specific lectin.16,23
One of the aims of this laboratory has been to develop lectin-based chemistries for high-sensitivity glycomic/glycoproteomic structural analysis. This necessitates departure from the most commonly used technique involving a small column containing 1–5 mL of agarose-based material,11-14 whereby the sample is loaded on such sorbents by using gravity-flow mode or low-pressure pumps. A notable exception has been a nonanalytical frontal-chromatography study of interactions.26 In preparative uses, samples are commonly suspended in a high-ionic-strength loading buffer, which is also used to wash the column prior to elution. Such composition of a loading buffer is necessary to eliminate nonspecific binding. Finally, glycoproteins or glycopeptides are eluted by displacement from the column with an elution buffer which has the composition of the loading buffer plus a haptene saccharide. However, this procedure is not compatible with the on-line pressurized systems that are intented to minimize sample handling, contamination, and sample losses.
Compact silica-based materials provide a suitable alternative to compressible agarose materials,15,19,21 permitting on-line interfacing with different chromatographic schemes and MS analyzers. One objective of our study has been to demonstrate the merits of lectin microcolumns as an effective and reproducible means of on-line preconcentration of glycoproteins and glycopeptides from complex biological materials at trace levels. Using two different lectin preparations, we demonstrate here the analytical merits of the described surface attachment: coverage uniformity, binding capacity, trapping reproducibility, and enhanced measurement selectivity in glycoproteomics. On-line coupling with the electrospray MS is shown in different arrangements. Another objective has been to enhance sensitivity of the site-of-glycosylation determinations through the lectin-based elimination of coeluting peptides that commonly obscure the weaker ionization of glycopeptides from a tryptic digest. Accordingly, we exploit here the potential of using on-line lectin microcolumns in conjunction with reversed-phase LC for enrichment of glycopeptides.
EXPERIMENTAL SECTION
Materials and Chemicals
Macroporous Silica LiChrospher Si 1000 (10 μm, 1000 Å) was received from EM Science (Darmstadt, Germany). Canavalia ensiformis (Con A) and Sambucus nigra (SNA) lectins, hemoglobin, myoglobin, cytochrome c, ribonuclease B, ovalbumin, and fetuin were purchased from Sigma (St. Louis, MO), as was trypsin (high proteomic grade). Dithiothreitol and iodoacetamide were products of Biorad (Hercules, CA). Conventional chemicals and reagents were received from Aldrich (Milwaukee, WI). PEEK tubing, unions, and 2-μm stainless steel frits were purchased from Scivex, Upchurch (Oak Harbor, WA). Con A Sepharose was acquired from Amersham Biosciences AB (Uppsala, Sweden).
Preparation of Silica-Based Lectin Materials
Lectins were coupled to the aldehyde-modified silica utilizing a previously published procedure.21 Briefly, 1 g of macroporous silica (Lichosphere 1000, 10 μm, 1000 Å) was washed sequentially with ∼60 mL of water; 6 M hydrochloric acid; and finally, with water. The washed material was dried overnight at 150 °C. Dry silica was then suspended in 15 mL of dry toluene containing 200 μL of 3-glycidoxypropyltrimethoxysilane. Next, 5 μL of triethylamine was added, and the mixture was stirred at 105 °C under reflux for 16 h. The resulting epoxy silica was filtered; washed successively with toluene, acetone, and ether; and dried under vacuum. A 1-g aliquot of the epoxy silica was converted to a diol silica by suspending and stirring in 100 mL of 10 mM sulfuric acid at 90 °C for 1 h. The diol silica was filtered; washed extensively with water, ethanol, and ether; and dried in a vacuum. The diol-silica was then converted to aldehyde silica by suspending 1 g of the diol silica in 20 mL of acetic acid/water (90/10) and adding 1 g of sodium periodate. The mixture was then stirred at room temperature for 2 h. Aldehyde silica was then filtered; washed successively with water, ethanol, and ether; and dried under reduced pressure. The extent of surface epoxidation was determined by the procedure developed by Larsson.27 Briefly, ∼60 mg of epoxy silica (weighed accurately) was suspended in 2 mL of water, while the pH was adjusted to 7.0. Next, 1 mL of 3 M sodium thiosulfate (pH 7.0) and 100 mM hydrochloric acid, which was included to maintain the pH at 7.0, were added, while the reaction was allowed to proceed for 1 h. The amount of hydrochloric acid consumed during the reaction is equivalent to the amount of epoxy groups attached to the silica surface.
Lectins were then attached to the aldehyde-modified silica using the conventional reductive amination reaction.28 An aliquot of 1 mg of Con A or SNA was solubilized in 1 mL of 0.1 M sodium bicarbonate (pH 8.0) containing 0.5 M sodium chloride in separate vials. Next, 125 mg of freshly prepared aldehyde-modified silica was added to each vial, and the suspensions were deaerated and sonicated for 5 min. After addition of 3 mg of sodium cyanoborohydride into each vial, mixtures were stirred at room temperature for 3 h. Then, 5 mg of sodium borohydride was added, stepwise, over 30 min to reduce the unreacted aldehyde groups to diols, and the suspensions were stirred for 1 h. Lectin-bound silica was filtered; washed twice with coupling buffer and once with 10 mM Tris buffer (pH 7.4) containing 0.5 M sodium chloride, 1 mM calcium chloride, 1 mM manganese chloride, 1 mM magnesium chloride, 0.02% sodium azide; and stored in the same buffer at 4 °C. Coupling efficiency was determined using the Bradford assay,29 in which the amount of covalently attached ligand was calculated from the measurements of lectin concentration before and after the coupling reaction. A 20-μL aliquot of silica suspension was pulled from the coupling solution before and after the reaction. After centrifugation, 10 μL of supernatant was transferred to a 1.5-mL Eppendorf tube and diluted to 1 mL with water. A 1-mL aliquot of each diluted solution was mixed with 1 mL of Bradford reagent. Mixtures were gently vortexed and incubated at room temperature for 10 min. The content was then transferred into 1.5-mL plastic cuvettes, while absorbance at 595 nm was measured for its protein content.
Visualization of Surface-Bound Lectins
To verify the homogeneity and effectiveness of the lectin attachment to silica, fluorescent microscopic investigations were performed. First, a Con A lectin material containing a fluorescent probe (fluorescein isothiocyanate (FITC)-reacted protein) was attached to silica, yielding a product with green fluorescence (FITC–Con A lectin). The procedure for preparation of FITC–Con A/silica was the same as described above for the lectin–silica material. To visualize the attachment of a glycoprotein to this material, ovalbumin labeled fluorescently with Texas red was utilized. The solution of Texas red/ovalbumin was prepared in the binding buffer at ∼1 mg/mL concentration and mixed together with the silica-based FITC–ConA lectin. Both fluorescently labeled products were purchased from Molecular Probes (Eugene, OR). The mixture was stirred for 2 h and centrifuged, and the resins were isolated from the supernatant. The resins were then washed several times with the binding buffer to ensure a complete removal of the unbound proteins. Silica-based FITC–Con A lectin and Texas red bound to the silica-based FITC–Con A lectin were placed on slides and viewed using a Nikon TE2000 inverted microscope (Huntley, IL). FITC Hy Q Cube (96320) with an excitation wavelength of 480/40 nm and an emission wavelength of 535/50 nm was used for FITC–Con A, while TRITC Hy Q Cube (96321) with an excitation wavelength of 545/30 nm and an emission wavelength of 620/60 nm was used for Texas red ovalbumin. The images were acquired using a Sony DWF-V500 camera.
Control Sample
This sample was prepared to depict the ionic strength and protein concentration of blood serum and was prepared by dissolving 60 g of serum albumin, 8.072 g of sodium chloride, 0.21 g of potassium chloride, 0.18 g of potassium dibasic phosphate, 0.37 g of calcium chloride, and 0.25 g of magnesium sulfate in 1 L of water. This control sample was then spiked with various concentrations of ribonuclease B. This experiment was performed to see whether a large excess of a nonspecific protein interferes with lectin performance.
Packing of Lectin Microcolumns
PEEK tubing, 500-μm i.d. and 1-mm i.d., was cut to 5-cm length, and 2-μm stainless steel frit was placed into the PEEK union that was connected to one end of the tubing. The other end of the tubing was connected to a Capillary Perfusion Toolkit (Perseptive Biosystems, Framingham, MA). After addition of 1.5 mL of properly sonicated lectin–silica slurry, a HPLC pump (a part of Äkta Purifier, Amersham Biosciences, Piscattaway, NJ) was connected to the apparatus, and the slurry was packed to the tubing at 2500 psi pressure using 10 mM Tris buffer (pH 7.4) containing 0.5 M sodium chloride, 1 mM calcium chloride, 1 mM manganese chloride, 1 mM magnesium chloride, and 0.02% sodium azide. Upon the procedural completion, the system was allowed to depressurize while the packed tubing was disconnected from the apparatus and capped with another 2-μm stainless steel frit placed inside a union. The Con A– and SNA–silica microcolumns were washed with the packing buffer at 10 (500-μm i.d.) or 50 μL/min (1-mm i.d.) for 20 min prior to their storage at 4 °C.
Capillary C18 Columns
The capillary C18 columns used in this study were packed in-house at 1000 psi while using a properly sonicated C18 silica slurry (5 μm, 120 Å), prefritted 100-μm-i.d. fused-silica capillary (IntegraFrit, New Objective, Inc., Woburn, MA), and a gas pressure chamber. Prior to use, the capillaries were washed with 90% acetonitrile containing 0.1% formic acid at 400 nL/min for 30 min and then with 3% acetonitrile containing 0.1% formic acid.
Tryptic Digestion
A 200-μL portion of glycoprotein solution (0.1 μg/μL in 50 mM ammonium bicarbonate) was thermally denatured at 95 °C for 15 min, centrifuged, and cooled to room temperature. The sample was reduced with 1 μL of 50 mM dithiothreitol at 50 °C for 15 min and alkylated with 200 mM iodoacetamide at room temperature for 15 min. The reaction mixture was incubated at 37 °C for 18 h [after the addition of 2 μL of trypsin solution (1 μg/μL)].
High-Performance Affinity Chromatography
Silica-based lectin microcolumns (1-mm i.d. × 50 mm) were characterized and compared to the commercial Sepharose microcolumns using an Äkta Purifier (Amersham Biosciences, Piscattaway, NJ) equipped with a UV detector set at 280 nm. The sample loading buffer used throughout this study consisted of 10 mM Tris buffer (pH 7.4) containing 0.5 M sodium chloride, 1 mM calcium chloride, 1 mM manganese chloride, 1 mM magnesium chloride, and 0.02% sodium azide. The subsequently used elution buffer was the same as the loading buffer, but it also included 0.1 M methyl-α-D-mannoside. The affinity microcolumns were equilibrated with the sample loading buffer at 100 μL/min for 30 min. The flow rate was then reduced to 50 μL/min prior to the injection of 50-μg samples. Lectin-bound samples were eluted using a step gradient of the elution buffer from 0 to 100% (after 15-min washing with the loading buffer).
High-performance affinity chromatography coupled on-line to mass spectrometry was accomplished using different sizes and formats of capillaries and microcolumns. A MicroMass QTOF Global (Waters, Milford, MA) mass spectrometer in which the capillary voltage was set at 3.5 kV and the cone voltage was set at 60 was employed in this study. Instrument scanning range was 150–2100. All other parameters were adjusted to provide optimum sensitivity and mass resolution. The instrument was equipped with CapLC chromatography system (Waters, Milford, MA) interfaced to the mass spectrometer through an electrospray ionization source. Commonly, a 0.5 mm × 50 mm PEEK tubing packed with silica-based lectin, as described above, was connected to the system, while a C18 preconcentration cartridge (Symmetry 300 C18, 5 μm, Waters, Milford, MA) was used for the on-line desalting and separation of bound and unbound proteins. The same setup, however, including a capillary C18 column was utilized for the separation and analysis of glycoprotein tryptic digests.
RESULTS AND DISCUSSION
Coupling of Lectins to Aldehyde-Modified Silica
The siliceous materials to be used for the attachment of lectins must fulfill several important criteria: they must be (1) chemically stable; (2) resistant to high pressure; (3) macroporous; (4) hydrophilic, with a nonionic surface; and (5) possessing functional groups suitable for the ligand immobilization.30 Just as with the synthetically modified methacrylate-based polymers,31,32 porous silica generally meets these criteria, except that it suffers from a partial solubility at alkaline pH and the presence of silanol groups acting as potential ion-exchange sites. Therefore, prior to coupling of the ligand, the surfaces must be additionally derivatized. One of the attractive approaches to modifying silica is based on the formation of the aldehyde-silica surfaces which are eventually coupled to the ligand through reductive amination.27 This approach is very fast, is not expected to adversely influence the ligand activity (lectin trapping efficiency), and is expected to offer relatively high coupling yield (>90%). Recently, this chemistry was employed for the immobilization of enzymes such as lipase33 to silica media and bovine serum albumin to monolithic phases.34 The reaction is based on the reductive amination of proteins and aldehyde-modified silica material. In our case, this reaction was rapid (completed within 3 h), offering also high coupling yields (>90% as determined by the Bradford assay29). Although the majority of coupling reactions that are commonly employed are usually performed overnight at 4 °C to enhance ligand stability,32,35,36 performing the reaction at room temperature for 3 h appeared satisfactory, with no observable adverse effect on the lectin binding activity. Moreover, it is commonly recommended in affinity chromatography to add a high concentration of the saccharide that specifically forms a complex with the lectin (i.e., 0.1 M methyl-α -d-mannoside for Con A and 0.1 M d-lactose for SNA lectins) to protect the binding sites.12,37 However, we did not include these saccharides in our preparation, since no substantial improvement resulted from their addition. The high coupling yield is partially attributed to a highly efficient conversion of silica surface to epoxy groups. It was determined here that 2.42 μmol of epoxy groups is generated for every 1 m2 of silica. A 1-m2 aliquot of silica very efficiently coated is expected to accommodate 2.5 μmol of epoxy group.27 Accordingly, it appears that a 97% conversion efficiency of the silica surfaces to epoxidation was attained. The batch-to-batch reproducibility of the chemical preparation was better than 10%. This was determined from the data acquired through the preparation of five batches.
Despite the difference in specificity for Con A and SNA, both lectins are reported to be stable under the same preparation conditions,12 so that all our affinity microcolumns were prepared following the same procedure as described in the Experimental Section. Moreover, the amount of a coupled lectin is easily controlled by varying the concentration of the lectin materials used. This is attainable because of the high coupling yields.
We have been able to illustrate the efficiency of our coupling reaction through the use of FITC-labeled Con A lectin and Texas red-labeled ovalbumin. Figure 1 depicts a microscopic picture of the coupled resins (a) under white light, (b) under a wavelength suitable for the excitation of FTIC, and (c) under the light of a wavelength suitable for the excitation of Texas red. The even distribution of the emission observed in Figure 1b demonstrates an efficient lectin coupling, whereas the light observed in Figure 1c illustrates the efficiency of glycoprotein trapping.
Figure 1.
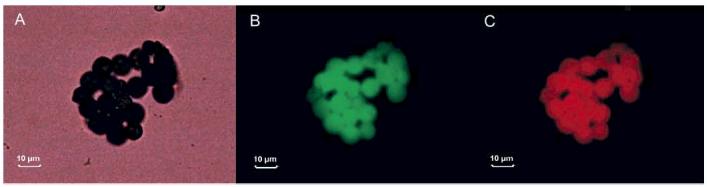
Microscopic photographs of the lectin beads coupled to FITC–Con A and treated with Texas red–ovalbumin. Pictures were acquired under (a) white light, (b) light with excitation wavelength of 480 nm suitable for FITC and (c) light with excitation wavelength of 545 nm, suitable for Texas red.
The silica-based lectin prepared in this work was characterized at the microscale using the Äkta Purifier HPLC system. The characterization was performed utilizing a 5-cm-long column with a 1.0-mm i.d., resulting in a final column volume of less than 30 μL. For such columns, 50 μl/min flow was determined to be optimal for analysis; lower values unnecessarily extended the analysis time, and higher values did not permit sufficient time for the formation of the ligand-sample complex. Although there are some recommendations about the suitable amount of lectin that affinity column should contain,12 it is necessary to choose the loading capacity that is appropriate for a particular application. In our case, these lectin microcolumns were not primarily utilized for sample purification because of their small volume, so a higher lectin load was required. The optimum lectin load needed for trapping of glycoproteins was determined by preparing materials with a different lectin load. The binding performance of a high-load microcolumn containing 50 mg Con A/g silica was compared to a low-load microcolumn containing 7 mg Con A/g silica. Although there was a very efficient trapping observed for the high-load column when 50 μg of ribonuclease B was loaded, under the same conditions, trapping was barely observable using the low-load column. This experiment illustrates how important it is to have either a sufficient loading capacity or very sensitive detection when attempting to perform affinity chromatography at a small scale. On the other hand, increasing the lectin load usually prompts the need to extensively condition the column before each injection, thus increasing the analysis time. Accordingly, the high-load lectin microcolumns had to be conditioned after elution with the loading buffer at 100 μL/min for 30 min to achieve reproducible results.
The performance of the silica-based lectin materials was further evaluated against their Sepharose counterpart. The trapping capabilities of both the Sepharose-based Con A material and silica-based Con A material with ribonuclease B as the substrate were compared. The trapping efficiencies of both materials are highly comparable, as was deduced from the similar peak areas of the analyses performed using commercial Con A material and our silica-based material. A shorter analysis time observed for the silica-based lectin can be attributed to the ability of these materials to withstand high backpressures without adversely affecting their trapping efficiencies. This feature cannot be offered by the Sepharose-based material, as shown in Figure 2, which endures gel shrinkage at high backpressures, thus lengthening the analysis time. Thus far, we have been able to demonstrate the ability to utilize a chemical attachment as the means for production of stable and effective lectin materials, offering advantages over the conventional packings.
Figure 2.

Binding capacity of Con A Sepharose lectin (A) vs. Con A silica-based lectin (B). Conditions: Columns, Con A Sepharose (1 mm × 50 mm, 10 μm, 1000 Å) (A) and silica-based Con A lectin with 60 mg Con A/g silica (1 mm × 50 mm, 10 μm, 1000 Å) (B); buffers: loading buffer, 10 mM Tris/HCl (pH 7.4), 0.5 M sodium chloride, 1 mM calcium chloride, 1 mM manganese chloride, 1 mM magnesium chloride, 0.02% sodium azide; elution buffer, the same as the loading buffer containing 0.1 M methyl- α-d-mannoside; flow-rate, 50 μL/min; 50 μg injected; UV detection at 280 nm.
Large-scale lectin high-performance affinity chromatography has long been used for fractionation of glycosylated proteins in real samples,36,38,39 but to our knowledge, the ability of a lectin material to specifically bind glycosylated proteins in minor amounts of complex biological material has never been tested. In this case, the affinity interaction between a sample and a lectin is established quite easily when a standard or a simple mixture of glycoproteins is introduced to the column. If a complex sample, usually with a low percentage of glycosylated proteins, needs to be fractionated, the lectin material must be capable of selectively binding only the minor glycoproteins without any interference from sample matrix. The matrix influence on the trapping efficiency of our silica-based lectin was evaluated using a control sample prepared as described above, with ribonuclease B as a standard glycoprotein. The extent of binding in the presence and absence of sample matrix was subsequently compared (see Figure 3). The control sample was spiked with different amounts of ribonuclease B (0–50 μg) prior to loading on the silica-based Con A microcolumn (Figure 3a-c). Peak areas of the bound fractions were compared. As the amounts of ribonuclease B in the sample were increased (Figure 3a-c), peak areas increased as well, suggesting an efficienct trapping process, regardless of the analyte relative concentration to the major component in the sample matrix (serum albumin). The trapping of the same amount of ribonuclease B (in the presence or absence of the major component, albumin) was comparable (Figure 3c and d). We can conclude that a minimal (if any) nonspecific binding occurs in this situation. Accordingly, the material was anticipated to be highly selective at very low glycoprotein amounts, even for a very complex sample matrix.
Figure 3.

Effect of matrix on the trapping of ribonuclease B. Conditions: columns, Con A silica (1 mm × 50 mm, 10 μm, 1000 Å) with 60 mg Con A/g silica; buffers: loading buffer, 10 mM Tris/HCl (pH 7.4), 0.5 M NaCl, 1 mM CaCl2, 1 mM MnCl2, 1 mM MgCl2, 0.02% NaN3; elution buffer: loading buffer containing 0.1 M methyl- α-d-mannoside; flow-rate 50 μL/min; 10 μL injected; UV detection at 280 nm.
Interfacing high-performance affinity chromatography directly to mass spectrometry (MS) suffers from several problems, usually seen as the result of the needed high salt concentrations1 or inclusion of certain ions that are not MS-friendly.12 It is very unlikely to have experimental conditions that would be simultaneously ideal for affinity interaction and mass spectrometric detection. Such a coupling requires, first, exclusion or a substantial reduction of the salts commonly included in the binding buffers. However, this task is nontrivial, since a total elimination of these buffer components would substantially reduce the column binding efficiency. An alternative is to include these components in the sample matrix while performing an extensive desalting procedure prior to an MS analysis. However, this approach would be cumbersome, substantially increasing the analysis time.
Initially, we investigated the binding efficiency of these columns using water as a loading buffer, and accordingly, we prepared the glycoprotein samples in the commonly employed loading buffer, as described above. However, when water was used to load the sample plug containing the commonly employed loading buffer to the lectin column, the composition of the elution buffer was kept unchanged. This approach was first tested off-line using the HPLC system. Surprisingly, the Con A binding activity was not adversely influenced by the use of water as the loading buffer, even after 15 injections, as was deduced from comparable peak areas of ribonuclease B for the first and last runs. Accordingly, elimination of the high salt contents in the loading buffer, as deduced from the described experiment, was beneficial to interfacing of the lectin columns to MS.
Interfacing High-Performance Affinity Chromatography to MS
Although some attempts to simplify complex mixtures of proteins (glycoprotein fractionation) using lectin affinity chromatography with MS,21,26,40 determination of the glycosylation sites has thus far been realized only in the off-line arrangement.41 Our experience with the lectin microcolumns indicates a substantial potential in this direction. The system used in this application is shown in Figure 4. As depicted in Figure 4, the system includes an auxiliary isocratic pump connected to the injection system, a lectin affinity microcolumn, a 10-port valve, a C18 preconcentration cartridge needed for a sample desalting, and a capillary C18 column to perform the separation of tryptic peptides. Importantly, this system requires that only a negligible amount of salts be included in the sample and delivered through the auxiliary pump, transporting the sample to the preconcentration cartridge. Deionized water can obviously be used as the loading buffer, having no adverse effect on the lectin binding activity. Consequently, the samples could be prepared in 10 mM Tris buffer (pH 7.4), containing 0.5 M sodium chloride, 1 mM calcium chloride, 1 mM manganese chloride, 1 mM magnesium chloride, and 0.02% sodium azide to prevent nonspecific binding.
Figure 4.
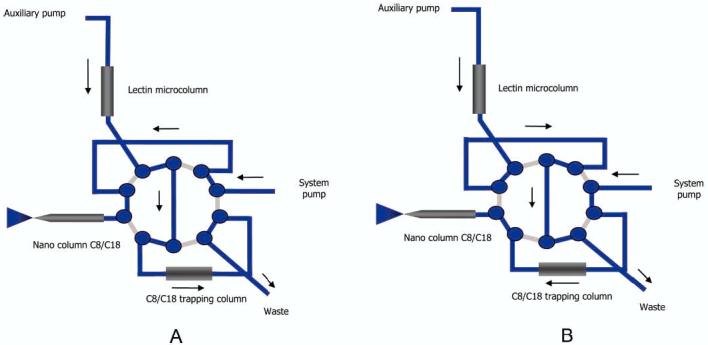
High-performance affinity chromatography setup coupled on-line to electrospray mass spectrometry, including a system for loading of proteins/glycoproteins (A) and analysis of proteins/glycoproteins (B).
First, the sample was injected into the lectin column and the C8/C18 trapping cartridges (Figure 4A). This setup ensures that the sample matrix is removed after trapping glycoproteins/glycopeptides on the lectin column and proteins/peptides on the C8/C18 trapping cartridge. The C8/C18 trapped sample (now assigned as lectin-unbound) becomes sufficiently eluted prior to the MS analysis. Next, glycoproteins/glycopeptides are eluted from the lectin column by using the autosampler and the auxiliary pump to inject the elution buffer containing the sugar at high concentration (Figure 4A). Eluted glycoproteins/glycopeptides are then trapped again on the C8/C18 trapping cartridge. The C8/C18 trapped sample (now assigned as lectin-bound) is sufficiently washed to eliminate all sugar and salts prior to the MS analysis. During the MS analysis, the auxiliary pump is connected only to the lectin microcolumn and waste again, while the flow rate is increased to condition the lectin column for the next analysis (Figure 4B). This setup ensures that no salts are introduced to the mass spectrometer. Solely deionized water with 3% acetonitrile was used as a conditioning buffer, while a high ionic strength condition and other essential ions are provided during the injection and elution. This type of conditioning is efficient, whereas it can be used because of the small scale of trapping and application of the valving system with on-line desalting and preconcentration.
The use of the described setup for trapping ribonuclease B sample is illustrated in Figure 5. The upper trace depicts the MS analysis of the Con A lectin-unbound fraction, clearly suggesting the efficient trapping of ribonuclease B on the Con A lectin microcolumn (Figure 5A). The middle trace depicts the MS analysis of the lectin-bound fraction (Figure 5B), where different charge states of ribonuclease B are observable for each of the five glycoforms of this glycoprotein with a single glycosylation site, indicating the five glycan structures distinguishable by MS. The bottom trace of this figure depicts the MS analysis of a blank following the analysis of the lectin-bound fraction, indicating clearly the efficient elution of ribonuclease B from the lectin column in the previous step. The data depicted in Figure 5 indicate that this approach is highly effective for trapping glycoproteins and their subsequent on-line MS analysis. The major advantage of this approach is its minimal sample handling, minimizing sample losses and ensuring greater sensitivities.
Figure 5.

On-line silica-based Con A lectin trapping of ribonuclease B. (A) MS analysis of lectin-unbound fraction, (B) MS analysis of lectin-bound fraction, and (C) MS analysis of blank run following the desorption of lectin-bound fraction.
Under the described analytical conditions, the binding capacity was calculated for the silica-based Con A lectin. The amount of ribonuclease B injected through the system was increased to the maximum of 200 ng. The signal due to the most intense peak observed in the MS analysis for both lectin-bound and -unbound fractions was plotted against the amount of ribonuclease B (Figure 6). The lectin microcolumn retains the ribonuclease B sample completely until its injected amount exceeds the surface coverage of the lectin groups available for trapping. Beyond this point, ribonuclease B was also observed in the unbound fraction. The highest amount of ribonuclease B totally trapped on the lectin column represents the trapping capacity of this silica-based lectin material.
Figure 6.

Binding capacity of silica-based Con A lectin material.
The reproducibility of the described system is within 5% for 10 runs performed over 3 days. This is viewed as an excellent result, since no correction was employed to offset any possible variations due to ionization changes. Moreover, this reproducibility also agrees with the data observed for the analysis performed earlier on the HPLC system at a larger scale. Trapping efficiency of the lectin column after 10 injections was almost identical to that observed for the first injection. The lectin columns were used for over 30 injections without any noticeable change in trapping efficiency and were stable for at least 6 months when stored at room temperature. Considering the small volume utilized in preparation of these columns and the procedural simplicity of lectin preparation, the replacement of the cartridge after 20 or so injections seems very practical and cost-effective. Moreover, the lectin microcolumns could be easily regenerated by flushing them for 1 h with the binding buffer described above.
A Con A silica microcolumn (0.5 mm × 50 mm, high load, 60 mg Con A/g silica) was further used to demonstrate the ability to trap a glycoprotein present in a protein mixture. The sample consisted of ribonuclease B (MW = 14 900 Da), cytochrome c (MW = 12 350 Da), and hemoglobin (MW = 16 950 Da). Ribonuclease B is a glycoprotein to which several highmannose glycans are attached,42 binding apparently to Con A, whereas cytochrome c and hemoglobin are not glycosylated and should not interact with Con A. The MS analyses of the Con A lectin unbound and bound fractions are shown in Figure 7A and B, respectively. The deconvoluted MS spectrum of the Con A lectin-unbound fraction included two proteins present in the sample without any traces of ribonuclease B (Figure 7A); the deconvoluted MS spectrum of the Con A lectin-bound fraction depicted only the five glycoforms of ribonuclease B (Figure 7B). In the case of ribonuclease B, which has only one site of glycosylation and a relatively limited microheterogeneity,42 lectin affinity chromatography interfaced on-line to MS has permitted the assignment of glycoforms associated with this particular glycoprotein.
Figure 7.

On-line Con A trapping of ribonuclease B. (A) Deconvoluted mass spectrum of lectin-unbound and (B) lectin-bound fractions.
Generally, the efficiency of trapping on a lectin column is dependent on the glycosylated structure and its location in the protein 3D structure. The presence of the glycan moiety on the protein backbone, in a location allowing its interaction with the lectin material, is necessary, being primarily responsible for efficient glycoprotein trapping.43
Although the sites of glycosylation on a glycoprotein are commonly determined by a scanning mass spectrometer (e.g., a triple-quadrupole or a quadrupole/time-of-flight instrument), the weaker ionization of glycopeptides relative to other peptides makes this approach impractical in some cases and requires the use of a large amount of sample, which in many cases may not be available. Therefore, it is desirable to isolate glycopeptides from the other peptides that are present in a tryptic digest, thus eliminating peptide interference. We show here that this can be achieved by utilizing lectin affinity chromatography.
The silica-based lectin capillaries described above can be utilized in a two-dimensional separation mode. First, a tryptic digest of a glycoprotein (or a pool of glycoproteins) will be loaded onto these capillaries and then eluted using the elution buffer. The eluted glycopeptides will be consequently trapped on a reversed-phase trapping column. This is needed to eliminate the high salt content of the elution buffer. Finally, the trapped glycopeptides will be injected into a reversed-phase capillary column that is interfaced to a mass spectrometer. This approach was utilized in the analysis of a fetuin tryptic digest. Bovine fetuin (M = 38 418 Da) is a glycoprotein that has both N- and O-glycosylated structures attached. There are three N-glycosylation sites associated with this protein. Moreover, glycan structures associated with this glycoprotein are mostly (2–6) sialylated.44 Two types of lectin trapping columns, a Con A trapping column which is selective for mannose-rich glycans and an SNA column specific for 2–6-linked sialic acids containing glycans, were used to determine the site of glycosylation of this glycoprotein.
Selective ion chromatograms of fetuin glycopeptides analyzed by conventional LC/MS are depicted in Figure 8a, c, and e; those of the glycopeptides trapped on-line through a Con A lectin trapping column prior to LC/MS are depicted in Figure 8b, d, and f. Note that the same amount of fetuin tryptic digest was injected in both cases. As mentioned above, the competitive ionization resulting from the coelution of peptides and glycopeptides in addition to the weaker ionization capacities of glycopeptides makes the determination of glycosylation sites difficult. Comparing the intensity of the extracted chromatograms of the same ions observed with and without the use of on-line lectin trapping clearly demonstrates this aspect. The peak intensity of the glycopeptide possessing N156 glycosylation site analyzed using on-line lectin trapping (Figure 8a) is ∼20-fold higher than that observed without the use of on-line lectin trapping (Figure 8b). On the other hand, the peak intensities of the other glycopeptides with the glycosylation sites at N176 and N99 were also higher when the on-line lectin trapping was utilized (compare Figure 8c and d and Figure 8e and f, respectively). Lectin trapping eliminated the coelution of peptides and glycopeptides, thus enhancing the ionization of glycopeptides. This effect is more pronounced in the case of the N156 glycosylation site, since it coelutes with many peptides. The other glycopeptides coelute with fewer peptides; nevertheless, the use of lectin trapping enhanced their signal 2-to 6-fold. This enhancement was observed even though the Con A trapping column was partially effective in retaining fetuin glycopeptides. Glycopeptides were observed in both the bound and unbound fractions; therefore, another lectin column was utilized to demonstrate a much higher trapping efficiency.
Figure 8.

Extracted ion chromatograms of fetuin glycopeptides analyzed by LC/MS without (a, c, and e) and with on-line Con A-lectin trapping (b, d, and f). Analysis conditions are detailed in Experimental.
As mentioned above, fetuin glycopeptides possess sialic acid moieties, which bind more efficiently to SNA lectin specific for this residue. Accordingly, the fetuin-derived glycopeptides associated with N156, N176, and N99 were not observed in the unbound fractions (Figure 8a, c, and e, respectively), in comparison with bound fractions (Figure 8b, d, and f, respectively). It is apparent from these figures that the use of a single lectin trapping column may not be completely sufficient. The use of several lectin columns in series is expected to be more effective. This mode may be attractive, especially for the analysis of a mixture of glycoproteins. The use of multiple trapping columns will simplify the overall complexity of a mixture and result in a better coverage and lower competitive ionization.
CONCLUSIONS
Although various lectins are beginning to be employed in biochemical isolations on nearly a routine basis, the approach described here extends their utilization to on-line analytical schemes and the investigations of glycoproteins at microscale. A simple and versatile technology of preparing pneumatically resistant microcolumn beds ensures the needed analytical reproducibility and stability over time. Different lectin materials can be prepared using similar chemical procedures.
Using model glycoproteins in this study, we have demonstrated an effective trapping of analytes on the lectin-immobilized surfaces and quantitative desorption for MS analysis. A system of microcolumns and high-pressure valves can be utilized in the analytical schemes leading to structural determination of glycoproteins or glycopeptides in complex mixtures. The selectivity of lectin-based trapping in the mixtures with nonglycosylated proteins/peptides ensures highly effective determinations of glycosylated molecules, as shown by assignment of the sites of glycosylation.
Our future efforts will be directed toward the use of different lectin microcolumns in the fractionation of complex mixtures of modified proteins or peptides as well as a selective preconcentration of glycoconjugates with unique glycan structures.
Figure 9.

Extracted ion chromatograms of fetuin glycopeptides analyzed by on-line SNA-lectin trapping and LC/MS. Lectin-unbound fractions (a, c, and e), and lectin-bound fractions (b, d, and f). Analysis conditions are detailed in the Experimental Section.
ACKNOWLEDGMENT
This work was supported by Grant No. (GM24349) from the National Institute of General Medical Sciences, U.S. Department of Health and Human Services and partially by a grant from the Indiana 21st Century Research and Technology Fund. In addition, the instrumentation used in this work was supported by the Indiana Genomics Initiative (INGEN), which is funded in part by the Lilly Endowment. We also thank Dr. Stephen Jacobson for use of his microscopic equipment to acquire the fluorescence images of the silica-based lectin material.
References
- 1.Hage DS. J. Chromatogr., B. 2002;768:3–30. doi: 10.1016/s0378-4347(01)00482-0. [DOI] [PubMed] [Google Scholar]
- 2.Hage DS, Austin J. J. Chromatogr. B. 2000;739:39. doi: 10.1016/s0378-4347(99)00445-4. [DOI] [PubMed] [Google Scholar]
- 3.Larive CK, Lunte SM, Zhong M, Perkins MD, Wilson GS, Gokulrangan G, Williams T, Afroz F, Schoeneich C, Derrick TS, Middaugh CR, Bogdanowich-Knipp S. Anal. Chem. 1999;71:389R. doi: 10.1021/a1990013o. [DOI] [PubMed] [Google Scholar]
- 4.Lillehoj E, Malik P, V. S. Adv. Biochem. Eng. Biotechnol. 1989;40:19. doi: 10.1007/BFb0009827. [DOI] [PubMed] [Google Scholar]
- 5.Chattopadhyay A, Tiam T, Kortum L, Hage DS. J. Chromatogr. B. 1998;715:183. doi: 10.1016/s0378-4347(98)00140-6. [DOI] [PubMed] [Google Scholar]
- 6.Liu Y, Zhao R, Shangguan D, Zhang H, Hongwu L, Liu G. J. Chromatogr., B. 2003;792:177. doi: 10.1016/s1570-0232(03)00263-0. [DOI] [PubMed] [Google Scholar]
- 7.Yang J, Hage DS. J. Chromatogr. 1993;645:241. doi: 10.1016/0021-9673(93)83383-4. [DOI] [PubMed] [Google Scholar]
- 8.Chaiken IM, editor. Analytical Affinity Chromatography. CRC Press; Boca Raton, FL: 1987. [Google Scholar]
- 9.Scouten WH. Affinity Chromatography: Bioselective adsorption on Inert Matrices. Wiley; New York: 1981. [Google Scholar]
- 10.Turkova J. Affinity Chromatography. Elsevier; Amsterdam: 1978. [Google Scholar]
- 11.Carlsson SR. Glycobiology: A Practical Approach. Oxford University Press; Oxford, UK: 1993. [Google Scholar]
- 12.Cummings RD. Methods Enzymol. 1994;230:66–86. doi: 10.1016/0076-6879(94)30008-9. [DOI] [PubMed] [Google Scholar]
- 13.Taketa K. Electrophoresis. 1998;19:2595–2602. doi: 10.1002/elps.1150191506. [DOI] [PubMed] [Google Scholar]
- 14.Yamamoto K, Tsuji T, Osawa T. Glycoanalysis Protocols. Humana Press Inc.; Totowa: 1998. [Google Scholar]
- 15.Hage DS. Clin. Chem. 1999;45:593–615. [PubMed] [Google Scholar]
- 16.Lee W, Lee KH. Anal. Biochem. 2004;324:1–10. doi: 10.1016/j.ab.2003.08.031. [DOI] [PubMed] [Google Scholar]
- 17.Krogh TN, Berg T, Hojrup P. Anal. Biochem. 1999;247:153–162. doi: 10.1006/abio.1999.4254. [DOI] [PubMed] [Google Scholar]
- 18.Bundy JL, Fenselau C. Anal. Chem. 1999;71:1460–1463. doi: 10.1021/ac981119h. [DOI] [PubMed] [Google Scholar]
- 19.Honda S, Suzuki S, Nitta T, Kakehi K. J. Chromatogr. 1988;438:73–84. doi: 10.1016/s0021-9673(00)90234-6. [DOI] [PubMed] [Google Scholar]
- 20.Cartellieri S, Hamer O, Helmholz H, Niemeyer B. Biotechnol. Appl. Biochem. 2002;35:83–89. doi: 10.1042/ba20010067. [DOI] [PubMed] [Google Scholar]
- 21.Xiong L, Andrews D, Regnier F. J. Proteomic Res. 2003;2:618–625. doi: 10.1021/pr0340274. [DOI] [PubMed] [Google Scholar]
- 22.Bundy JL, Fenselau C. Anal. Chem. 2001;73:751–757. doi: 10.1021/ac0011639. [DOI] [PubMed] [Google Scholar]
- 23.Mechref Y, Novotny MV. Chem. Rev. 2002;102:321–370. doi: 10.1021/cr0103017. [DOI] [PubMed] [Google Scholar]
- 24.Mechref Y, Gong H, Ma W, Novotny MV. Biochem. Biophys. Res. Commun. 1999;255:451–455. doi: 10.1006/bbrc.1999.0176. [DOI] [PubMed] [Google Scholar]
- 25.Mechref Y, Zidek L, Ma W, Novotny MV. Glycobiology. 2000;10:1–5. doi: 10.1093/glycob/10.3.231. [DOI] [PubMed] [Google Scholar]
- 26.Zhang B, Palcic MM, Mo H, Goldstein IJ, Hindsgaul O. Glycobiology. 2001;11:141–147. doi: 10.1093/glycob/11.2.141. [DOI] [PubMed] [Google Scholar]
- 27.Larsson P-O, Glad M, Hansson L, Månsson MO, Ohlson S, Mosbach K. Advances in Chromatography. Dekker; New York: 1983. [PubMed] [Google Scholar]
- 28.Emerson WS. Org. Reaction. 1948;4:174–255. [Google Scholar]
- 29.Bradford M. Anal. Biochem. 1976;72:248–254. doi: 10.1016/0003-2697(76)90527-3. [DOI] [PubMed] [Google Scholar]
- 30.Larsson P-O. Methods Enzymol. 1984;104:212–223. doi: 10.1016/s0076-6879(84)04091-x. [DOI] [PubMed] [Google Scholar]
- 31.Dyr JE, Suttnar J. J. Chromatogr. 1991;563:124–128. doi: 10.1016/0378-4347(91)80283-i. [DOI] [PubMed] [Google Scholar]
- 32.Josič D, Hoffmann W, Habermann R, Reutter W. J. Chromatogr. 1988;444:29–39. doi: 10.1016/s0021-9673(01)94006-3. [DOI] [PubMed] [Google Scholar]
- 33.Seo W-Y, Lee K. Biotechnol. Bioprocess Eng. 2004;9:465–470. [Google Scholar]
- 34.Malik R, Jiang T, Hage D. Anal. Chem. 2004;76:7013–7022. doi: 10.1021/ac049001q. [DOI] [PubMed] [Google Scholar]
- 35.Geng M, Zhang X, Bina M, Regnier F. J. Chromatogr., B. 2001;752:293–306. doi: 10.1016/s0378-4347(00)00550-8. [DOI] [PubMed] [Google Scholar]
- 36.Harada H, Kamei M, Yui S, Koyama F. J. Chromatogr. 1986;355:291–295. doi: 10.1016/s0021-9673(01)92627-5. [DOI] [PubMed] [Google Scholar]
- 37.Shibuya N, Goldstein IJ, Broekaert WF, Nsimba-Lubaki M, Peeters B, Peumans WJ. J. Biol. Chem. 1987;262:1596–1601. [PubMed] [Google Scholar]
- 38.Josič D, Schuett W, Neumeier R, Reutter W. FEBS Lett. 1985;185:182–186. doi: 10.1016/0014-5793(85)80766-3. [DOI] [PubMed] [Google Scholar]
- 39.Manabe T, Higuchi N, Okuyama T, Mukaiyama Y. J. Chromatogr. 1988;431:45–54. doi: 10.1016/s0378-4347(00)83068-6. [DOI] [PubMed] [Google Scholar]
- 40.Rüdiger A-H, Rüdiger M, Carl UD, Chakraborty T, Roepstorff P, Wehland J. Anal. Biochem. 1999;275:162–170. doi: 10.1006/abio.1999.4319. [DOI] [PubMed] [Google Scholar]
- 41.Bunkenborg J, Pitch BJ, Podtelejnekov AV, Wisniewski JR. Proteomics. 2004;4:454–465. doi: 10.1002/pmic.200300556. [DOI] [PubMed] [Google Scholar]
- 42.Joo-An H, Peavy TR, Hedrick JL, Lebrilla CB. Anal. Chem. 2003;75:5628–5637. doi: 10.1021/ac034414x. [DOI] [PubMed] [Google Scholar]
- 43.Jeyaprakash A, Katiyar S, Swaminathan CP, Sekar K, Surolia A, Vijayn M. J. Mol. Biol. 2003;332:217–228. doi: 10.1016/s0022-2836(03)00901-x. [DOI] [PubMed] [Google Scholar]
- 44.Cointe D, Leroy Y, Chirat F. Carbohydr. Res. 1998;311:51–59. doi: 10.1016/s0008-6215(98)00196-7. [DOI] [PubMed] [Google Scholar]