

Abstract
3′-Azido-3′-deoxythymidine (AZT) is a staple of highly active antiretroviral therapy (HAART). Prior to HAART, long-term use of high-dosage AZT caused myopathy, cardiomyopathy, and hepatotoxicity, associated with mitochondrial DNA depletion. As a component of HARRT, AZT causes cytopenias and lipodystrophy. AZT-5′-triphosphate (AZTTP) is a known inhibitor of the mitochondrial polymerase γ and has been targeted as the source of the mitochondrial DNA depletion. However, in previous work from this laboratory with isolated rat heart mitochondria, AZT phosphorylation beyond AZT-5′-monophosphate (AZTMP) was not detected. Rather, AZT was shown to be a more potent inhibitor of thymidine phosphorylation (50% inhibitory concentration (IC50) of 7.0 ± 1.0 μM) than AZTTP is of polymerase γ (IC50 of >100 μM), suggesting that depletion of mitochondrial stores of TTP may limit replication. This work has investigated whether an identical mechanism might account for the hepatotoxicity seen with long-term use of AZT. Isolated rat liver mitochondria were incubated with labeled thymidine or AZT, and the rate and extent of phosphorylation were determined by HPLC analysis of acid-soluble extracts of the incubated mitochondria. The results showed that in the phosphorylation of thymidine to TMP, liver mitochondria exhibit a higher Vmax and Km than heart mitochondria, but otherwise heart and liver mitochondria display similar kinetics. AZT is phosphorylated to AZTMP, but no further phosphorylated forms were detected. In addition, AZT inhibited the production of TTP, with an IC50 of 14.4 ± 2.6 μM AZT. This is higher, but comparable to, the results seen in isolated rat heart mitochondria.
Keywords: AZT, Liver mitochondria, Thymidine, Mitochondrial toxicity, Thymidine kinase 2, Reverse transcriptase inhibitors
Abbreviations: AIDS, acquired immunodeficiency syndrome; AZT, 3′-azido-3′-deoxythymidine; AZTDP, 3′-azido-3′-deoxythymidine-5′-diphosphate; AZTMP, 3′-azido-3′-deoxythymidine-5′-monophosphate; AZTTP, 3′-azido-3′-deoxythymidine-5′-triphosphate; HAART, highly active antiretroviral therapy; HIV, human immunodeficiency virus; IC50, 50% inhibitory concentration; S.E.M., standard error of mean
1. Introduction
3′-Azido-3′-deoxythymidine (AZT) is an analog of thymidine and belongs to the class of drugs called the nucleoside-analog reverse transcriptase inhibitors, used in the treatment of acquired immunodeficiency syndrome (AIDS). AZT capitalizes on human immunodeficiency virus’s (HIV) unique method of replication by inhibiting the viral reverse transcriptase, which blocks the life-cycle of HIV and effectively slows the progression of AIDS. When given in monotherapy at high doses over long periods of time, AZT is known to cause damage to many tissues, including a mitochondrial skeletal muscle myopathy, a dilated cardiomyopathy, and hepatotoxicity [1–11]. These conditions are related to AZT use and not to the progression of AIDS since when patients experiencing one or more of these adverse effects discontinued AZT therapy, the adverse effects would resolve [8,9]. In modern therapy regimens, AZT is given at much lower doses and in combination with other drugs. Thus, these adverse effects have become fairly rare, but hematological toxicities, such as anemia, and lipodystrophy are observed commonly in combination therapy [12–14].
These toxicities are believed to be mediated through mitochondrial damage and are associated with mitochondrial DNA depletion [15–17]. The current prevailing hypothesis for this damage is by 3′-azido-3′-deoxythymidine-5′-triphosphate (AZTTP) inhibition of the mitochondrial DNA polymerase γ [18]. However, several groups have demonstrated that relative to other nucleoside analog triphosphates, AZTTP is not a very good inhibitor of polymerase γ (50% inhibitory concentration (IC50) of 100–200 μM AZTTP) [16,17,19]. Further, because 3′-azido-3′-deoxythymidine-5′-monophosphate (AZTMP) is a poor substrate for the cytosolic thymidylate kinase [20,21], levels of AZTTP high enough to inhibit polymerase γ have not been reported even in mitotic tissue [20,22]. Prior research utilizing non-mitotic tissue in this laboratory demonstrated that AZTTP was not detected during the 2 h incubation of isolated rat heart mitochondria and that AZTMP accumulated within the matrix of the mitochondria [23]. This research also has shown that AZT was a potent inhibitor of thymidine phosphorylation in isolated rat heart mitochondria (IC50 of 7.0 ± 1.0 μM AZT). This inhibition is directed towards the mitochondrial thymidine kinase 2, which is the only thymidine kinase expressed in non-mitotic cells [24]. An alternative hypothesis for the observed toxicity is that in non-mitotic tissues, AZT results in the depletion of mitochondrial stores of TTP, limiting mitochondrial DNA replication and causing mitochondrial toxicity [23]. This work intends to extend this original research beyond rat heart to another tissue, the rat liver.
2. Materials and methods
2.1. Isolation and incubation of rat liver mitochondria
Mitochondria were isolated from Harlan Sprague–Dawley rat liver using a slight modification of the method described previously [23]. In this modified procedure, the liver is not perfused before homogenization, and no nagarse is used. The isolated mitochondria were then incubated at 30 °C in a medium defined previously [23], containing mitochondria at 4 mg protein/mL in 25 mM MOPS buffer (pH 7.2), 90 mM potassium chloride, 4 mM magnesium sulfate, 5 mM potassium phosphate, 0.4 mM EGTA, 44 mM mannitol, 14 mM sucrose, BSA (1 mg/mL), 2 mM ATP, 20 mM glutamate, and 0.1 mM of the other 19 amino acids. Concentrations and specific radioactivities of [methyl-3H]-thymidine and [methyl-3H]-AZT used in these incubations are noted in the figure legends.
2.2. Detection of mitochondrial phosphorylation of thymidine and AZT by direct precipitation
A 0.2 mL aliquot of the incubation medium was removed at various time points and was mixed with an equal volume of 10% trichloroacetic acid. The mixture was kept on ice for at least 10 min and then centrifuged. 0.35 mL of the acid-soluble supernatant was removed and neutralized with 350 mg of resin (AG-11A8) and 0.21 mL of water. The neutralized extract was filtered and analyzed by HPLC as described below.
This method yields the total of the nucleoside and nucleotide components found in the medium and in the acid-soluble portion of the mitochondrial matrix. The rate of appearance of phosphorylated forms of a labeled precursor can be quantitated over time or in relation to substrate concentration. This method does not differentiate between phosphorylation within the matrix and phosphorylation outside of the matrix.
2.3. HPLC analysis
[Methyl-3H]-thymidine, [methyl-3H]-AZT, and their phosphorylated intermediates from the neutralized acid-soluble extract described in the previous section were identified and quantitated using reverse-phase HPLC with an Alltech nucleoside/nucleotide column connected to an in-line UV monitor (254 nm) and a Radiomatic flow-through scintillation counter as described previously [23]. The buffers used for HPLC analysis were as follows: 60 mM ammonium phosphate and 5 mM tetrabutylammonium phosphate in water (A) and 5 mM tetrabutylammonium phosphate in methanol (B). Three methods used on the HPLC are described below, and results from typical runs are shown in Fig. 1. All methods use a total flow rate of 2 mL/min. For [methyl-3H]-thymidine compounds and for [methyl-3H]-AZT with AZT concentrations less than 10 μM, the methods used are the same as described previously in McKee et al. [23]. For [methyl-3H]-AZT with AZT concentrations of 10 μM or higher, the HPLC method starts at 80% A and 20% B, shifts to 60% A and 40% B over 15 min using a slightly concave gradient, holds at 60% A and 40% B for 10 min, and finally drops immediately to 80% A and 20% B and holds for 5 min to re-equilibrate the column. This improved separation of AZT and AZTMP, necessary at high concentrations of AZT.
Fig. 1.
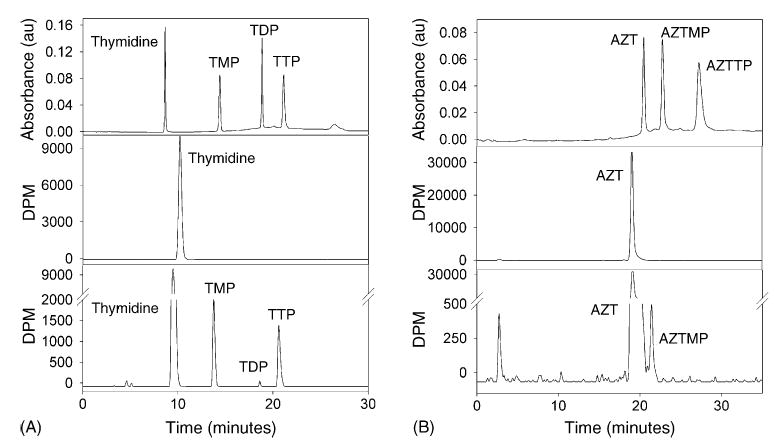
HPLC analysis of thymidine (A) and AZT (B) nucleosides and nucleotides in the acid-soluble extracts of incubated isolated liver mitochondria. Thymidine standard (A, top) and AZT standard (B, top) were separated by HPLC with an in-line UV absorbance detector. The acid-soluble extracts of a mitochondrial sample after 0 min (A, middle) and 120 min (A, bottom) of incubation with [methyl-3H]-thymidine (1 μM, 8000 dpm pmol−1) were detected by HPLC and an in-line scintillation counter. The acid-soluble extracts of a mitochondrial sample after 0 min (B, middle) and 120 min (B, bottom) of incubation with [methyl-3H]-AZT (1 μM, 8000 dpm pmol−1) were detected by HPLC and an in-line scintillation counter.
2.4. Data treatment
Values of Vmax, Km, and IC50 and their respective standard deviations were obtained by best fit graphical analysis of the data using Sigma Plot 9.01.
3. Results
3.1. Removal of nagarse from mitochondrial isolation method
Originally, the liver mitochondria to be used for this work were isolated using nagarse, similar to the described method in McKee et al. [23]. However, replacement of the nagarse with a solution containing 220 mM mannitol, 70 mM sucrose, 5 mM MOPS, and 2 mM EGTA resulted in better coupled mitochondria with higher respiratory control ratios. The mean respiratory control ratio ± standard error of mean (S.E.M.) for the mitochondria isolated with nagarse was 3.86 ± 0.39, and for mitochondria isolated without nagarse, it was 4.92 ± 0.22. A two-tailed Student’s t-test was used to compare these means and yielded p = 0.04, suggesting that the difference between the means is statistically significant.
3.2. Time course of thymidine and AZT phosphorylation in isolated rat liver mitochondria
Isolated mitochondria were incubated as described in Section 2 with the addition of either [methyl-3H]-thymidine or [methyl-3H]-AZT to the incubation medium. Aliquots were then removed at several time points and prepared as described in Section 2. The data for thymidine (Fig. 2A) reveal that the total amount of phosphorylated thymidine (all TNP) increases nearly linearly over the 90 min incubation period. TMP accounts for the bulk of the phosphorylated thymidine, and its level also increases nearly linearly over the course of the incubation. TDP and TTP rise at much slower rates. This suggests that in isolated rat liver mitochondria, the rate-limiting step in the thymidine phosphorylation pathway is at the conversion of TMP to TDP.
Fig. 2.
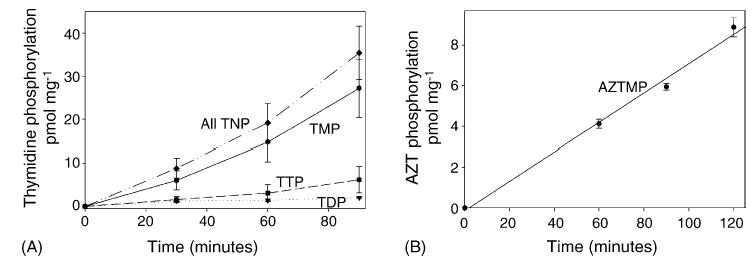
Time course of the phosphorylation of thymidine (A) and AZT (B) in isolated liver mitochondria. Mitochondria were incubated as described in Section 2 with 1 μM [methyl-3H]-thymidine (8000 dpm pmol−1) or 1 μM [methyl-3H]-AZT (8000 dpm pmol−1). Acid-soluble extracts were separated by HPLC and detected by an in-line scintillation counter. Results shown are the mean ± S.E.M. of three to four independent observations. For thymidine (A), the levels of TMP, TDP, TTP, and total phosphorylated thymidine (all TNP) are depicted. For AZT (B), AZTMP was the only phosphorylated form detected. This demonstrates that isolated liver mitochondria readily produce TTP but do not synthesize detectable amounts of AZTTP during the time frame of these experiments.
As with thymidine, the data for AZT (Fig. 2B) show a linear rate of conversion of AZT to AZTMP. However, unlike thymidine, AZTMP was not further phosphorylated, and no 3′-azido-3′-deoxythymidine-5′-diphosphate (AZTDP) or AZTTP was detected over the course of the 2 h incubation period.
3.3. Kinetics of thymidine and AZT phosphorylation in isolated rat liver mitochondria
Using a range of thymidine concentrations, varying from 0.4 μM to 200 μM, the kinetics of thymidine phosphorylation were determined. The sum of the measured levels of TMP, TDP, and TTP was used to calculate the velocity of thymidine phosphorylation (picomole per milligram protein per hour). Fitting these data using the Michaelis–Menton equation yields a Vmax of 284.4 ± 22.6 pmol mg−1 h−1 and an apparent Km of 12.0 ± 3.5 μM. The Eadie–Hofstee plot (Fig. 3B) is distinctly biphasic, and the data in it are approximated with two straight lines, producing two approximated Km’s (27.7 μM and 2.3 μM). The calculated Hill coefficient (Fig. 3B, inset) is 0.67. Both the biphasic Eadie–Hofstee plot and the Hill coefficient of less than 1 are highly suggestive of negative cooperativity, which has been previously observed with purified thymidine kinase 2 [25].
Fig. 3.
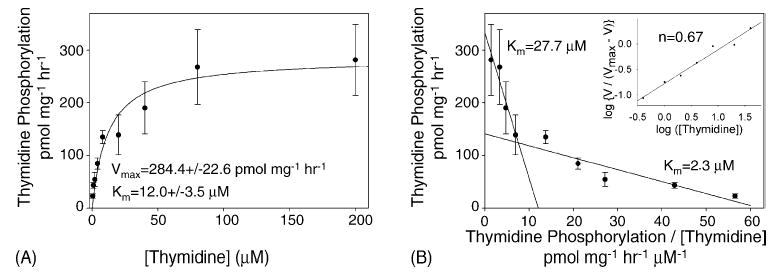
Kinetics of thymidine phosphorylation in isolated liver mitochondria. Michaelis–Menton plot (A) of the velocity of thymidine phosphorylation, as determined in Fig. 2, against thymidine concentration (0.4–200 μM). For thymidine concentration between 0.4 μM and 20 μM, the specific radioactivity was 8000 dpm pmol−1, but thymidine concentrations of 40 μM, 80 μM, and 200 μM had specific radioactivities of 5000 dpm pmol−1, 2500 dpm pmol−1, and 1000 dpm pmol−1, respectively, in order to conserve [methyl-3H]-thymidine. Data from four trials were pooled and shown as the mean ± S.E.M. The Vmax and Km were calculated by best fit using the Michaelis–Menton equation (Sigma Plot 9.01). Both are several fold higher than those observed in isolated rat heart mitochondria [23]. Eadie–Hofstee plot (B) of the same data with the velocity of thymidine phosphorylation is plotted against the velocity divided by the thymidine concentration. An approximation of the data can be obtained with two straight lines, yielding two affinity constants. Hill plot (B, inset) of the same data yields a Hill coefficient of 0.67.
The kinetics of AZT phosphorylation were determined in the same manner as for thymidine phosphorylation, utilizing AZT concentrations varying from 0.4 μM to 120 μM. The Michaelis–Menton equation yields a Vmax of 68.8 ± 2.9 pmol mg−1 h−1 and an apparent Km of 6.3 ± 1.1 μM (Fig. 4A). As noted for thymidine, the Eadie–Hofstee plot (Fig. 4B) is biphasic, and the Hill coefficient (Fig. 4B, inset) is 0.76. Again, these both suggest negative cooperativity.
Fig. 4.
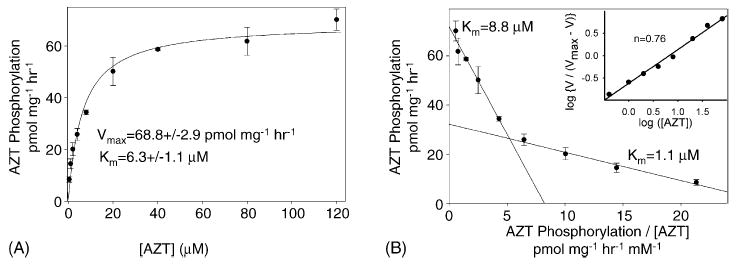
Kinetics of AZT phosphorylation in isolated liver mitochondria. Michaelis–Menton plot (A) of the velocity of AZT phosphorylation as determined in Fig. 2 vs. the AZT concentration (0.4–120 μM) is shown. For AZT concentration between 0.4 μM and 8 μM, the specific radioactivity was 8000 dpm pmol−1, but AZT concentrations of 20 μM, 40 μM, 80 μM, and 200 μM had specific radioactivities of 6500 dpm pmol−1, 3500 dpm pmol−1, 2000 dpm pmol−1, and 1200 dpm pmol−1, respectively, in order to conserve [methyl-3H]-AZT. Data from three trials were pooled and expressed as the mean ± S.E.M. The best fit line for the Michaelis–Menton equation (Sigma Plot 9.01) was used to calculate the Vmax and Km, which are three to four times higher than those observed in isolated rat heart mitochondria [23]. Eadie–Hofstee plot (B) of the same data with the velocity of AZT phosphorylation plotted against the velocity divided by the AZT concentration. An approximation of the data can be obtained with two straight lines, yielding two affinity constants. Hill plot (B, inset) is of the same data and yields a Hill coefficient of 0.76.
3.4. Inhibition of thymidine phosphorylation by AZT in isolated rat liver mitochondria
Previous work with isolated rat heart mitochondria has shown that AZT inhibits the phosphorylation of thymidine (Fig. 5). To see if this holds true for isolated rat liver mitochondria, [methyl-3H]-thymidine was incubated in the presence of concentrations of AZT ranging from 0 μM to 200 μM. A constant thymidine concentration of 1 μM, chosen as an approximation of the physiological concentration of thymidine [26], was used for all samples. The results demonstrate clearly that increasing the AZT concentration causes a decrease in the rate of thymidine phosphorylation, with an IC50 of 14.4 ± 2.6 μM AZT.
Fig. 5.
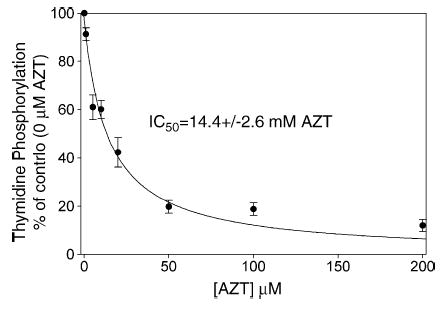
Effect of AZT on thymidine phosphorylation in isolated liver mitochondria. Mitochondria were incubated with 1 μM [methyl-3H]-thymidine (8000 dpm pmol−1) and unlabeled AZT in concentrations varying from 0 μM to 200 μM. The acid-soluble extracts were separated by HPLC and detected by an in-line scintillation counter. Data from four trials were pooled and expressed as the mean ± S.E.M. The percentage of phosphorylation observed as compared to the 0 μM AZT control sample (51.7 ± 10.1 μM) from each experiment is plotted against the AZT concentration. AZT inhibits the phosphorylation of thymidine, with an IC50 of 14.4 ± 2.6 μM AZT, as determined by the best fit line of the hyperbolic decay equation (Sigma Plot 9.01). These results mirror those seen in previous experiments with isolated heart mitochondria [23], although with a slightly higher IC50.
4. Discussion
During the pre-highly active antiretroviral therapy (HAART) era, AZT monotherapy in AIDS patients was closely associated with myopathy, cardiomyopathy, and hepatotoxicity [1–10]. Subsequent work in HIV negative rat models treated with AZT confirmed the presence of the same type of toxicities in the rat [11,15]. Cytotoxicity of AZT has also been shown in a variety of transformed cells, including the HepG2 cell line [10,22,27]. In all cases, the toxicity of AZT was correlated with abnormal mitochondria and mitochondrial DNA depletion, when examined. Earlier work from this laboratory investigated the mechanism of this toxicity in isolated rat heart mitochondria and proposed that the toxicity may be caused by AZT inhibition of thymidine salvage with depletion of the TTP pool [23]. The findings described here extend these studies to isolated rat liver mitochondria. A comparison of the liver studies with those from heart demonstrates that both heart and liver mitochondria readily phosphorylate thymidine to TTP. The initial reaction in this pathway is catalyzed by thymidine kinase 2. In the liver mitochondria, the Vmax of this reaction is about seven-fold faster, and the Km is about six-fold higher. In both heart and liver TMP is the predominant phosphorylated form of thymidine, suggesting that the thymidylate kinase reaction, converting TMP to TDP, has become the rate-limiting reaction in the isolated mitochondria. AZT is readily phosphorylated to AZTMP in mitochondria from both tissues, and no AZTDP or AZTTP is detected over the course of the incubation period. The liver mitochondria display a Vmax for AZT phosphorylation about three-fold faster, but unlike for thymidine, the Km is nearly the same as in heart mitochondria. Both tissues display negative cooperativity in the phosphorylation of thymidine and AZT. This is consistent with previous observations in purified thymidine kinase 2 [25].
No AZTTP is detected during the incubation in either liver or heart mitochondria [23]. This may be due to the limited time frame in which isolated mitochondria may be studied and to the poor reactivity of AZTMP with thymidylate kinase. Previous work in heart mitochondria [23] indicates that TMP and AZTMP are not transported across the inner membrane and must be phosphorylated by a matrix thymidylate kinase, which has yet to be characterized. Nonetheless, the cytosolic thymidylate kinase is known to be a highly rate-limiting step in the AZT phosphorylation pathway [20]. This raises the probability that AZTTP is unlikely to ever reach the concentration (>100 μM [17]) required to inhibit the mitochondrial DNA polymerase γ. Alternatively, AZT potently inhibits the phosphorylation of thymidine in both heart and liver mitochondria. The IC50 for liver mitochondria (14.4 ± 2.6 μM AZT) is higher but still comparable to the IC50 observed for heart mitochondria (7.0 ± 1.0 μM AZT) [23]. This supports the hypothesis proposed by McKee et al. [23] in which AZT inhibits thymidine phosphorylation causing the TTP pools contained within the mitochondria to become limiting. This could cause a slowing or halting of mitochondrial DNA replication, leading to mitochondrial DNA depletion. The cytosolic thymidine kinase 1 is regulated by the cell-cycle and is expressed only during S-phase [28]. In non-mitotic cells, like those found in heart and liver, no thymidine kinase 1 is expressed, and the only route available for these cells to phosphorylate thymidine is by the mitochondrial thymidine kinase 2 pathway [28]. AZT, by acting to inhibit thymidine kinase 2, may greatly slow the conversion of thymidine to TMP. A reduction in the production of TMP directly results in a reduction in TTP production, as TMP is a necessary precursor to TTP. As TTP becomes limiting, mitochondrial DNA replication slows, and eventually mitochondrial DNA depletion is evident. Additionally, an imbalance in the TTP pool relative to the other dNTP pools is known to increase the mitochondrial DNA mutation rate [29]. Further evaluation of this potential mechanism will require studies correlating the depletion of TTP pools with cytotoxicity, mitochondrial toxicity, and mitochondrial DNA depletion, perhaps in hepatocyte or cardiomyocyte cell culture.
Strong support for this hypothesis of mitochondrial DNA depletion comes from a human inherited disease of severe muscle myopathy with mitochondrial DNA depletion caused by a partial deficiency of thymidine kinase 2 [30,31]. This disease is usually lethal in childhood. Saada et al. [32] have demonstrated that TTP is significantly reduced in fibroblast cells cultured from these patients. Liver damage has not been reported in the few individuals that have been characterized to have a partial thymidine kinase 2 deficiency; however, a similar mitochondrial DNA depletion disease affecting liver and brain has been characterized in which the matrix enzyme deoxyguanosine kinase is deficient [33]. The difference in the presenting pathology of these two disorders is unknown, but it may be related to tissue specific levels of expression of the respective enzymes.
Acknowledgments
This work is supported by a pre-doctoral fellowship from the American Heart Association Greater Midwest Affiliate to MDL and by a grant from the National Institute of Health, HL 72710 to EEM.
References
- 1.Chariot P, Drogou I, de Lacroix-Szmania I, Eliezer-Vanerot MC, Chazaud B, Lombes A, et al. Zidovudine-induced mitochondrial disorder with massive liver steatosis, myopathy, lactic acidosis, and mitochondrial DNA depletion. J Hepatol. 1999;30:156–60. doi: 10.1016/s0168-8278(99)80020-8. [DOI] [PubMed] [Google Scholar]
- 2.Deveaud C, Beauvoit B, Hagry S, Galinier A, Carriere A, Salin B, et al. Site specific alterations of adipose tissue mitochondria in 3′-azido-3′-deoxythymidine (AZT)-treated rats: an early stage in lipodystrophy? Biochem Pharmacol. 2005;70:90–101. doi: 10.1016/j.bcp.2005.04.015. [DOI] [PubMed] [Google Scholar]
- 3.Sinnwell TM, Sivakumar K, Soueidan S, Jay C, Frank JA, McLaughlin AC, et al. Metabolic abnormalities in skeletal muscle of patients receiving zidovudine therapy observed by 31P in vivo magnetic resonance spectroscopy. J Clin Invest. 1995;96:126–31. doi: 10.1172/JCI118012. [DOI] [PMC free article] [PubMed] [Google Scholar]
- 4.Olano JP, Borucki MJ, Wen JW, Haque AK. Massive hepatic steatosis and lactic acidosis in a patient with AIDS who was receiving zidovudine. Clin Infect Dis. 1995;21:973–6. doi: 10.1093/clinids/21.4.973. [DOI] [PubMed] [Google Scholar]
- 5.Arnaudo E, Dalakas M, Shanske S, Moraes CT, DiMauro S, Schon EA. Depletion of muscle mitochondrial DNA in AIDS patients with zidovudine-induced myopathy. Lancet. 1991;337:508–10. doi: 10.1016/0140-6736(91)91294-5. [DOI] [PubMed] [Google Scholar]
- 6.Cupler EJ, Danon MJ, Jay C, Hench K, Ropka M, Dalakas MC. Early features of zidovudine-associated myopathy: histopathological findings and clinical correlations. Acta Neuropathol (Berl) 1995;90:1–6. doi: 10.1007/BF00294452. [DOI] [PubMed] [Google Scholar]
- 7.Tanuma J, Ishizaki A, Gatanaga H, Kikuchi Y, Kimura S, Hiroe M, et al. Dilated cardiomyopathy in an adult human immunodeficiency virus type 1-positive patient treated with a zidovudine-containing antiretroviral regimen. Clin Infect Dis. 2003;37:e109–11. doi: 10.1086/377609. [DOI] [PubMed] [Google Scholar]
- 8.Dalakas MC, Illa I, Pezeshkpour GH, Laukaitis JP, Cohen B, Griffin JL. Mitochondrial myopathy caused by long-term zidovudine therapy. N Engl J Med. 1990;322:1098–105. doi: 10.1056/NEJM199004193221602. [DOI] [PubMed] [Google Scholar]
- 9.Mhiri C, Baudrimont M, Bonne G, Geny C, Degoul F, Marsac C, et al. Zidovudine myopathy: a distinctive disorder associated with mitochondrial dysfunction. Ann Neurol. 1991;29:606–14. doi: 10.1002/ana.410290607. [DOI] [PubMed] [Google Scholar]
- 10.Benbrik E, Chariot P, Bonavaud S, Ammi-Said M, Frisdal E, Rey C, et al. Cellular and mitochondrial toxicity of zidovudine (AZT), didanosine (ddI) and zalcitabine (ddC) on cultured human muscle cells. J Neurol Sci. 1997;149:19–25. doi: 10.1016/s0022-510x(97)05376-8. [DOI] [PubMed] [Google Scholar]
- 11.Corcuera T, Alonso MJ, Picazo A, Gomez F, Roldan M, Abad M, et al. Hepatic morphological alterations induced by zidovudine (ZDV) in an experimental model. Pathol Res Pract. 1996;192:182–7. doi: 10.1016/S0344-0338(96)80218-4. [DOI] [PubMed] [Google Scholar]
- 12.Barile M, Valenti D, Quagliariello E, Passarella S. Mitochondria as cell targets of AZT (zidovudine) Gen Pharmacol. 1998;31:531–8. doi: 10.1016/s0306-3623(98)00041-x. [DOI] [PubMed] [Google Scholar]
- 13.Shah I. Adverse effects of antiretroviral therapy in HIV-1 infected children. J Trop Pediatr 2005 [Epub ahead of print]. [DOI] [PubMed]
- 14.Moh R, Danel C, Sorho S, Sauvageot D, Anzian A, Minga A, et al. Haematological changes in adults receiving a zidovudine-containing HAART regimen in combination with cotrimoxazole in Cote d’Ivoire. Antivir Ther. 2005;10:615–24. doi: 10.1177/135965350501000510. [DOI] [PubMed] [Google Scholar]
- 15.Lewis W, Gonzalez B, Chomyn A, Papoian T. Zidovudine induces molecular, biochemical, and ultrastructural changes in rat skeletal muscle mitochondria. J Clin Invest. 1992;89:1354–60. doi: 10.1172/JCI115722. [DOI] [PMC free article] [PubMed] [Google Scholar]
- 16.Lim SE, Copeland WC. Differential incorporation and removal of antiviral deoxynucleotides by human DNA polymerase gamma. J Biol Chem. 2001;276:23616–23. doi: 10.1074/jbc.M101114200. [DOI] [PubMed] [Google Scholar]
- 17.Martin JL, Brown CE, Matthews-Davis N, Reardon JE. Effects of antiviral nucleoside analogs on human DNA polymerases and mitochondrial DNA synthesis. Antimicrob Agents Chemother. 1994;38:2743–9. doi: 10.1128/aac.38.12.2743. [DOI] [PMC free article] [PubMed] [Google Scholar]
- 18.Lewis W, Dalakas MC. Mitochondrial toxicity of antiviral drugs. Nat Med. 1995;1:417–22. doi: 10.1038/nm0595-417. [DOI] [PubMed] [Google Scholar]
- 19.Johnson AA, Ray AS, Hanes J, Suo Z, Colacino JM, Anderson KS, et al. Toxicity of antiviral nucleoside analogs and the human mitochondrial DNA polymerase. J Biol Chem. 2001;276:40847–5. doi: 10.1074/jbc.M106743200. [DOI] [PubMed] [Google Scholar]
- 20.Lavie A, Schlichting I, Vetter IR, Konrad M, Reinstein J, Goody RS. The bottleneck in AZT activation. Nat Med. 1997;3:922–4. doi: 10.1038/nm0897-922. [DOI] [PubMed] [Google Scholar]
- 21.Lavie A, Vetter IR, Konrad M, Goody RS, Reinstein J, Schlichting I. Structure of thymidylate kinase reveals the cause behind the limiting step in AZT activation. Nat Struct Biol. 1997;4:601–4. doi: 10.1038/nsb0897-601. [DOI] [PubMed] [Google Scholar]
- 22.Sales SD, Hoggard PG, Sunderland D, Khoo S, Hart CA, Back DJ. Zidovudine phosphorylation and mitochondrial toxicity in vitro. Toxicol Appl Pharmacol. 2001;177:54–8. doi: 10.1006/taap.2001.9288. [DOI] [PubMed] [Google Scholar]
- 23.McKee EE, Bentley AT, Hatch M, Gingerich J, Susan-Resiga D. Phosphorylation of thymidine and AZT in heart mitochondria: elucidation of a novel mechanism of AZT cardiotoxicity. Cardiovasc Toxicol. 2004;4:155–67. doi: 10.1385/ct:4:2:155. [DOI] [PMC free article] [PubMed] [Google Scholar]
- 24.Coppock DL, Pardee AB. Regulation of thymidine kinase activity in the cell cycle by a labile protein. J Cell Physiol. 1985;124:269–74. doi: 10.1002/jcp.1041240215. [DOI] [PubMed] [Google Scholar]
- 25.Wang L, Munch-Petersen B, Herrstrom Sjoberg A, Hellman U, Bergman T, Jornvall H, et al. Human thymidine kinase 2: molecular cloning and characterisation of the enzyme activity with antiviral and cytostatic nucleoside substrates. FEBS Lett. 1999;443:170–4. doi: 10.1016/s0014-5793(98)01711-6. [DOI] [PubMed] [Google Scholar]
- 26.Traut TW. Physiological concentrations of purines and pyrimidines. Mol Cell Biochem. 1994;140:1–22. doi: 10.1007/BF00928361. [DOI] [PubMed] [Google Scholar]
- 27.Pan-Zhou XR, Cui L, Zhou XJ, Sommadossi JP, Darley-Usmar VM. Differential effects of antiretroviral nucleoside analogs on mitochondrial function in HepG2 cells. Antimicrob Agents Chemother. 2000;44:496–503. doi: 10.1128/aac.44.3.496-503.2000. [DOI] [PMC free article] [PubMed] [Google Scholar]
- 28.Johansson M, van Rompay AR, Degreve B, Balzarini J, Karlsson A. Cloning and characterization of the multisubstrate deoxyribonucleoside kinase of Drosophila melanogaster. J Biol Chem. 1999;274:23814–9. doi: 10.1074/jbc.274.34.23814. [DOI] [PubMed] [Google Scholar]
- 29.Song S, Pursell ZF, Copeland WC, Longley MJ, Kunkel TA, Mathews CK. DNA precursor asymmetries in mammalian tissue mitochondria and possible contribution to mutagenesis through reduced replication fidelity. Proc Natl Acad Sci USA. 2005;102:4990–5. doi: 10.1073/pnas.0500253102. [DOI] [PMC free article] [PubMed] [Google Scholar]
- 30.Saada A, Shaag A, Elpeleg O. mtDNA depletion myopathy: elucidation of the tissue specificity in the mitochondrial thymidine kinase (TK2) deficiency. Mol Genet Metab. 2003;79:1–5. doi: 10.1016/s1096-7192(03)00063-5. [DOI] [PubMed] [Google Scholar]
- 31.Saada A, Shaag A, Mandel H, Nevo Y, Eriksson S, Elpeleg O. Mutant mitochondrial thymidine kinase in mitochondrial DNA depletion myopathy. Nat Genet. 2001;29:342–4. doi: 10.1038/ng751. [DOI] [PubMed] [Google Scholar]
- 32.Saada A, Ben-Shalom E, Zyslin R, Miller C, Mandel H, Elpeleg O. Mitochondrial deoxyribonucleoside triphosphate pools in thymidine kinase 2 deficiency. Biochem Biophys Res Commun. 2003;310:963–6. doi: 10.1016/j.bbrc.2003.09.104. [DOI] [PubMed] [Google Scholar]
- 33.Mandel H, Szargel R, Labay V, Elpeleg O, Saada A, Shalata A, et al. The deoxyguanosine kinase gene is mutated in individuals with depleted hepatocerebral mitochondrial DNA. Nat Genet. 2001;29:337–41. doi: 10.1038/ng746. [DOI] [PubMed] [Google Scholar]