

Abstract
Purpose: Imaging studies from anesthetized cat, monkey and human retinas have revealed near-infrared fundus reflectance changes induced by visible light stimulation. Here, we characterize the spatial and temporal properties of similar changes in normal, awake humans.
Methods: 5 normal human subjects were studied. A modified fundus camera was used to image changes in retinal reflectance of 780nm near-infrared light imaged onto a 12 bit CCD camera in response to a green (540nm) visual stimulus. During 60s of recording (frame rate, 3Hz) 10 cycles were recorded, during each of which 3s of blank and then 3s of either vertical bar or blank stimulus was projected. The change in the average near-infrared reflectance of the stimulated retinal region relative to an equal sized non-stimulated region (ratio of reflectance between the two retinal areas=r) was analyzed with a mixed model for repeated measures.
Results: The mixed model showed a significant average decrease in r of 0.14% (95% CI, −0.25 to −0.03) over all subjects induced by bar stimulus cycles with a gradual return to baseline after stimulus offset compared to only 0.04% (95% CI, −0.11 to 0.20) decrease in r for blank non stimulated cycles,. The mixed model for individuals showed a decreasing linear trend in r over time during bar stimulation but no decrease for blank cycles in 3/5 subjects.
Conclusions: There exists a localized decrease in reflectance to 780nm near-infrared light in the retinal region exposed to a visual stimulus, which is significant in 3/5 subjects. It is presumed that the reflectance change represents the functional activity of the retina in response to a visual stimulus.
Introduction
Optical imaging of an intrinsic contrast signal is now a well established method of visualizing neural activity on the cortical surface of the mammalian brain, and has provided a means for revealing the functional architecture of ocular dominance columns in visual cortex (1;2). Its principle is based on imaging the changes in tissue reflectance of light that are elicited by stimulus-induced changes in neuronal activity(3). Such reflectance changes are thought to originate from stimulus-induced changes in light scattering properties of neural tissue, and from changes in light absorption associated with hemodynamic changes in blood volume or the oxygenated state of hemoglobin (4). At near-infrared wavelengths, decreased scattering of light due to neural activation is the predominant cause of decreased reflectance, and is related to a decrease in extracellular space volume, caused by neuronal KCl inflow and resulting water influx(5). The reflectance changes are very small, and the change elicited by neuronal activation constitutes less than 1% of the total reflectance of light from the neural tissue. Due to its optical accessibility, the retina is ideally suited for imaging tissue reflectance. In intrinsic optical imaging of functional activation of visual cortex, the stimulus can be applied to the retina while changes in tissue reflectance are measured from the cortical surface. In intrinsic optical imaging of retinal function, the stimulus and measurement location are the same, requiring that the optical pathway from the retina to the CCD imaging sensor be filtered to allow only the near-infrared measurement light to reach the sensor, without contamination from the visible light of the stimulus.
A number of publications have documented changes in retinal reflectance with light exposure. Riva et al., provided an extensive review of visually evoked hemodynamic retinal changes, including changes in vessel diameter, laser Doppler flowmetry, oxymetry and functional magnetic resonance imaging signals(6). Crittin et al., demonstrated the existence of visually evoked light reflectance changes at 570nm and 600nm around the optic nerve head in response to a whole field flicker stimulus in humans (7). Tsunoda et al report a visually evoked reflectance change in the macula of macaque monkeys to a whole field flash stimulus (8). De Lint et al. showed retinal reflectance changes in humans on a time scale of minutes with the fundus reflectance increasing during light and decreasing during dark adaptation (9). From cortical optical imaging, visually evoked reflectance changes of light in the 400-600nm range are dominated by hemodynamic components, while the reflectance changes of near infrared light over 630nm may significantly be influenced by changes in the light scattering properties of cells(4;10). Our group (11) report, both in an anesthetized cat preparation and in humans, that stationary localized visual stimuli can evoke focal reflectance changes on the retina by 780nm near-infrared light(12-14).
Optical imaging of retinal intrinsic signals in awake humans could offer a novel means by which the temporal and spatial activation properties of the retinal layers can be revealed in normal and pathologic states. The measurements in humans are technically more challenging when compared to stabilized animal preparations in which the retina is immobilized and heart rate and breathing can be regulated. The purpose of this study was to characterize the changes in amount of near-infrared 780nm light reflected from the retina in awake humans in response to a focal visual stimulus.
Materials and Methods
Experimental Setup
The Optical Imaging Device is based on a Canon non-mydriatic fundus camera (CPP-1 fundus photoperimeter, Canon Corporation, Tokyo, Japan), modified to allow simultaneous projection of a visual stimulus and near-infrared illumination onto the retina and imaging of the near-infrared retinal reflectance. The experimental setup is depicted in Figure 1. Light emitted by a halogen bulb, powered by a stabilized adjustable power supply (Agilent E3644A, Agilent Corp, Palo Alto, CA), was projected onto the retina after passing through Interference filter I (780nm peak, 40nm bandwidth) ensuring that only near-infrared light reached the retina. The fundus camera's original safety filters rejected ultraviolet and long infrared wavelengths (not shown). A Liquid Crystal Display (LCD) stimulus screen (Kopin Cyberdisplay 320M, Kopin Co, Taunton, MA), was controlled by an external computer and proprietary StimulatorJ software (see below). The light emitted by the LCD passed through a bandpass filter (550nm peak, 20nm bandwidth), allowing only the green stimulus light to be reflected by the cold mirror (see Figure 1) onto the retina. The light reflected back from the retina contained both reflected near-infrared light, modulated by the intrinsic optical signal, and the reflected green stimulus light, but only the near-infrared light was transmitted through the cold mirror (block 480-565nm, pass > 600nm at 45°). A supplementary 780nm bandpass filter further filtered the light transmitted by the cold mirror to ensure that no non-near-infrared components of the light reflected from the retina could each the CCD sensor. Control experiments performed on an artificial eye confirmed that the localized response could not be attributed to the reflection of the visual stimulus from the retina onto the CCD sensor by inadequate filtering. The illumination by near-infrared light was set manually before the start of each experiment to attain an optimally uniform reflectance image. Extensive safety testing was performed by Kestrel Co. to ensure that this illumination was within safe limits, and were found to be below 0.06 nW/m2. The CCD sensor, a 12-bit monochrome camera (Quantix, Photometrics, Tucson, AZ, model A02D6000) was triggered by the StimulatorJ software, and recorded the reflectance images of 264×256 pixels every 333ms, at 260ms exposure time, i.e. during each 333ms frame, the sensor integrated each pixel's intensity over 260ms.
Figure 1.

Schematic diagram of the experimental setup. Red arrows and red line show the near-infrared pathway of near-infrared illuminating light, and green arrows and green line show green visual stimulus light. The near-infrared and green lights are both reflected from the retina (mixed common pathway shown as green and red line), but all of the visible light is filtered out so that the CCD camera only sees the reflected near-infrared light. See text for explanation.
To stabilize the subject's head with respect to the device, a padded adjustable headband coupled to a rigid headframe was affixed to the chin-rest, which could be positioned along the x, y, and z axes. Head stabilization with the headband was sufficient during preliminary experiments to circumvent the need for a bite-bar. To avoid blink artifacts, a Burian-Allen speculum contact lens electrode (normally used for electroretinography) was used. The contact lens was applied with gonioscopic solution to ensure adequate corneal lubrication and to protect the cornea from drying during recording; drying could potentially affect image quality and influence near-infrared reflectance measurements. Corneal anesthesia and a patch on the contralateral eye were used to minimize blinking and other involuntary eye movements. Refractive error was neutralized with the fundus camera refraction corrector.
StimulatorJ software, written by one of the authors (MDA) was used to control the visual stimulus on the miniature LCD display. It is based on the ImageJ program from the National Institutes of Health, available at rsb.info.nih.gov/ij (15), and can display a variety of solid, checkerboard, flickering and static stimuli with configurable timing (see below). For the current study, homogeneous blank field and vertical bar stimuli were used.
For recording, the tested eye was dilated with 2.5%phenylephrine / 0.5% cyclopentolate combination mydriatic at least 30 minutes prior to the experiment. After corneal anesthesia with topical 0.5% proparacain hydrochloride ophthalmic solution and insertion of the Burian-Allen lens, the subject dark adapted for five minutes. The CCD camera was focused on the retinal vessels under visual inspection of the reflectance image and the near-infrared illumination was adjusted to a level to attain an optimally uniform reflectance image. The recording area covered approximately 45° in diameter, and was centered on the fovea to include the vascular arcades and optic disc.
Stimuli were presented in a randomized sequence paradigm, as depicted in Figure 2. At the start of the run, the CCD camera was triggered to begin image collection, while a pre-stimulus blank period was presented for 3 seconds. Following the pre-stimulus period, a three second stimulus period occurred, consisting of either a stationary bright vertical bar or a blank (no stimulus given), as determined by the randomized block design. Throughout the run, a small central fixation mark was flickered at 8Hz so the subject could maintain steady eye position. The pre-stimulus and stimulus sequence (referred to as “cycle”) was repeated ten times without interruption, typically resulting in 60 seconds (ten cycles) of continuous blank and vertical bar stimulus conditions. The randomized block sequence design ensured that five vertical bars and five blanks were randomly projected in each 60 second period. The CCD image sequence that was recorded as a 60 seconds run contained 180 frames, each 333 ms in length, and was stored to disk for offline analysis (see below). The rationale for this protocol was to have an extended recording time without interruption, minimizing the total testing time and reducing potential sources of error associated with the subject exiting and then repositioning in front of the instrument. Eight runs on a day could typically be obtained without undue discomfort and fatigue. Runs were limited to 60s to minimize head and eye movement.. In preliminary experiments, longer continuous recording led to unacceptable head movements.
Figure 2.

Example of stimulus randomized sequence. During 60 seconds, 10 cycles of 6 seconds each are projected. Each cycle has 3 seconds of blank (no stimulus), and 3 seconds of either a vertical bar cycle (vb) or a blank cycle (blank), determined by the randomized block. There are always five blank and five bar cycles in each 60 second run.
The area and location of the projection of the stimulus in the retinal image were determined by having the subject fixate at each corner of the fully illuminated rectangular image of the LCD screen while recording the retinal image for each eye position. From these fixation images, the area of projection of the LCD screen onto the subject's retina could be determined. The projected area on the retina of the vertical bar was approximately 5×1mm. The luminance of the vertical bar stimulus was approximately 10cd/m2 in the pupil plane, while during a blank stimulus, the luminance of the LCD screen was not measurable with our light meter (< 0.2cd/m2). The stimulus shape, size, location, luminance and timing were optimized on the basis of preliminary human and cat experiments that evaluated a number of stimulus geometries including counter flickering checkerboard stimuli, and diagonal and hemifield stimuli. In preliminary experiments, significant improvements in signal to noise ratio were not found by changing stimulus size or location, while hemifields and diagonally shaped stimuli gave results that were more difficult to compare with a control, unstimulated area. Therefore, for the purpose of this study, the rectangular bar stimulus was primarily used as the visual stimulus.
Volunteer Inclusion and Exclusion criteria
All experiments were performed under a protocol that adhered to the tenets of the declaration of Helsinki and was approved by the Institutional Review Board of the University of Iowa Hospitals and Clinics, including informed consent. For this study, five normal subjects were enrolled. The subjects included two females and three males, with ages 51, 50, 41, 41, 30 years. Subjects 1-3 and 5 were Caucasian, subject 4 was Asian). To satisfy inclusion criteria, subjects underwent a complete ophthalmologic history, slit lamp and retinal examination. All subjects had normal eyes with refractive errors < ±6D. One eye of each subject was chosen at random for the experiment.
Data Analysis
For offline analysis, each image was aligned to the first image in each sequence using an affine Mutual Information registration algorithm designed by one of the authors (MDA) for ImageJ, and available at http://bij.isi.uu.nl(16). This algorithm segments the vessel ridges in each retinal image using the eigenvalues of the Hessian matrix at each pixel, and then finds the affine transformation containing the minimal amount of mutual information with the first image in the sequence(14). The amount of x-, and y-shift that had to be applied to each frame for optimal registration was recorded.
As explained above, each subject run consisted of a 60 second recording period containing 10 cycles (6 seconds/cycle), of 18 frames each. Each cycle consisted of a 3 second (9 frames) baseline recording where no stimulus was presented followed by another 3 second (9 frames) where either a vertical bar stimulus (bar cycle) was presented or no stimulus was presented (blank cycle). The pixel intensities in each recorded frame were analyzed to determine the reflectance ratio (r) of two equal-sized rectangular regions of the retina; one (S) corresponding to the projection of the vertical bar stimulus and the other (N) corresponding to a non-stimulated area oriented perpendicular to the first region (Figure 3). The relative reflectance or reflectance ratio r of each image at time t was calculated by dividing the average pixel intensity of S by the average pixel intensity of N, for each frame, for time t from the start of the cycle. Both S and N regions of interest spared the optic disc and the parafoveal region. See Figure 3. r(t) was normalized with respect to the frame immediately preceding the stimulus onset by dividing each rj(t) by r(3000ms). For subsequent analysis, windows for r were defined of the average r of three consecutive frames each, one window before and three after stimulus onset, and for frames 6,7,8 - 10,11,12 - 13,14,15 - 16,17,18 respectively for both blank and bar stimulus conditions. Corresponding windows were also computed for x- and y-position.
Figure 3.
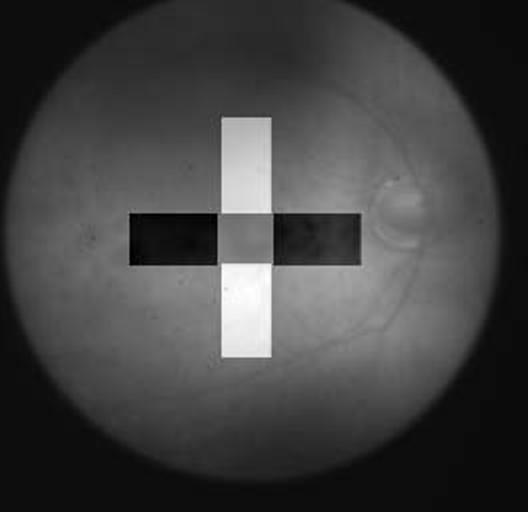
Definition of regions of interest (ROI) on the retina imaged by near infrared light (optic disc and vessels are to the right) used to calculate the intrinsic optical signal. S (white) is the ROI onto which the vertical bar stimulus was projected, and N (black) is the control ROI where no visual stimulus was given. For calculation of the localized reflectance ratio, expressed as a ratio of the average pixel intensity in S divided by the average pixel intensity in N, the central foveal area common to the two was excluded.
A mixed effect model for repeat measures was used to determine the effect of the presence or absence of a vertical bar visual stimulus (bar versus blank cycles) on the reflectance ratio (17). The advantage of the mixed model over less robust methods such as multiple linear regression is that it allows an analysis of all sources of variation separately and independently. This is in contrast to the multiple linear regression, where all variation is lumped into one error term, and which can only account for multiple sources of variation with a considerable loss of generality. The sources of variation in this study were stimulus, time (window), cycle, cycles in runs, cycles in runs across subjects, and interactions between these sources. This ‘overall’ mixed model was designed to determine the existence of a change in over four time windows (from prestimulus window 0 to poststimulus window 3) in all experiments and in all subjects in both bar and blank cycles. The mixed model analysis was performed using SAS proc MIXED (SAS Version 9.1, SAS Institute Inc., Cary, NC, 2003). Fixed effects were stimulus state (vertical bar or blank), window, and stimulus-window interaction. The random effects were runs within subject, cycle within run within subject, and subject. Within each stimulus cycle (bar or blank), a statistical test for linear mean contrast was performed to determine if mean changes in retinal reflectance, as measured by the mean ratio, decreases linearly across the four sequential time windows (see preceding paragraph).
The above model is designed to measure the existence of a change in in all subjects in all cycles, but it cannot determine the relative size of these changes in individual subjects. Therefore a second ‘individual’ mixed model was designed to test for the presence of a change in individual subjects. The presence of a linear trend was defined as the ‘individual mixed model’ showing a change in reflectance from before to after the stimulus, to .
The effect of changes in eye fixation position on the changes in r was tested by Pearson's Product Moment Calculation. The correlation and its 95% confidence interval of the reflectance ration (r) windows with the corresponding small x- and y-position shifts of the fundus that are inevitable during image recording were calculated. This was done to evaluate whether small changes in eye position could account for any of the significant changes in the reflectance ratio, r, that were induced by the bar stimulus.
Results
For all subjects, at least four 60 second runs were obtained with the vertical bar and blank stimuli on a single day. From the overall linear mixed effects model analysis, a significant change (five subjects) in the mean reflectance ratio across the four windows was observed in the bar cycles (p < 0.02), but not in the blank cycles (p < 0.58). The change in reflectance ratio for the bar stimulus was −0.14% (95% confidence interval, −0.25 to −0.03), and for the blank stimulus was 0.04% (95% confidence interval, −0.11 to 0.18) from time window 0 to window 3 (in other words, the reflectance decreased linearly overall by approximately 0.14% if a vertical bar stimulus was present and did not decrease with a blank stimulus). The test for a linear decrease from window 0 to window 3 for the bar cycles had a p value of 0.025, and 0.904 for the blank cycles. The results from the mixed model were weighted to take into account any difference in the number of runs for each subject, for the order of cycles in runs, and for subjects. In other words, the decreasing linear trend in the reflectance ratio, r, that was found after stimulus onset was not merely a mathematical average across cycles and subjects: it means that in all cycles for all subjects, some decrease is measurable. The maximum decrease for those subjects with a decreasing linear trend was in time window 2, or between 2.33s to 3.33s. after stimulus onset.
To study the significance of this decrease in individual subjects, the individual mixed model was used (Table 3). In 3 out of 5 subjects a decrease in reflectance ratio was found following the onset of the stimulus, however the 95% confidence intervals bracketed zero, except in one subject (subject 3). In 4 out of 5 subjects, no decrease in reflectance ratio was found in blank stimulus cycles, while one subject showed a small decrease.
Therefore, the mixed model analysis demonstrated a significant decrease in the reflectance ratio, r, which decreased linearly over time following onset of stimulus, but not during blank non-stimulus cycles. The effect of stimulus on reflectance ratio was found to be significant across all subjects, however, these changes in reflectance varied somewhat over time for both bar and blank stimuli across individuals, under the present experimental conditions.
Figure 4 shows the time course of the reflectance ratio averaged over all stimulus cycles in a run, for subject 3, the subject with lowest signal to noise ratio of the subjects studied. It shows the gradual decrease of r during the first 3-4 seconds of a bar cycle, but no change during a blank cycle. After the vertical bar stimulus is turned off, the reflectance ratio gradually returns to baseline before the onset of the next stimulus.
Figure 4.
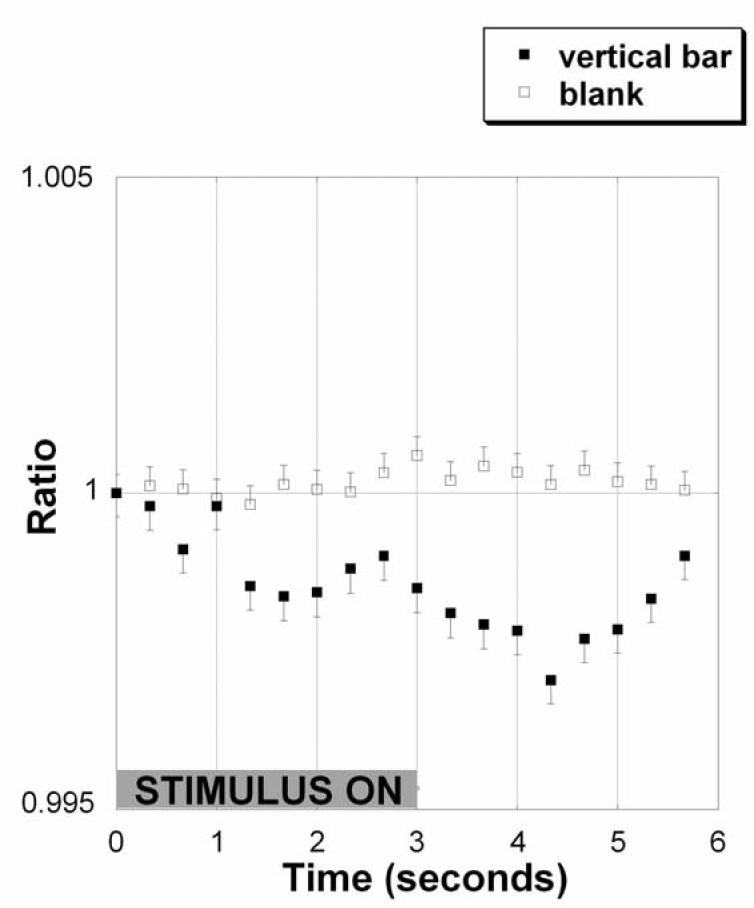
A Single run (10 cycles) time course of the localized reflectance ratio in normal human subject 3. A decrease in the reflectance ratio represents a decrease in the near-infrared reflectance over the stimulated area of retina relative to an unstimulated equal area perpendicular to it. The open squares show the lack of reflectance ratio change for a blank cycle when a ‘blank’ stimulus is presented and the closed squares show the change in reflectance ratio when a bar stimulus is presented from time 0 to 3 seconds (gray bar). This time course example was chosen because of its relatively smooth time course, but the timing of the maximum of the decrease does not fully correspond to that found in the statistical analysis.
To determine the influence of the x- and y-position of the eye on the change of r, their correlation was calculated. The correlation of r with the x-position was −0.0729 (95% confidence interval, −0.144 to −0.008) for bar cycles, and 0.1302 (95% confidence interval, 0.045 to 0.213) for blank cycles, and of r with the y-position was −0.01515 (95% confidence interval, 0.045 to 0.213) for bar cycles and −0.0203 (95% confidence interval, −0.106 to 0.065) for blank cycles, indicating no significant or systematic effect of changes in eye position on the reflectance ratio, r.
Figure 5 shows the spatial distribution of the decrease in reflectance of near-infrared light in a bar cycle, and a blank cycle, occurring in one of the subjects. In this case, there was a clear spatial correlation between the intrinsic signal of the retina and the retinal location where the stimulus bar was placed, with appropriate control. However, the occurrence of a distinct spatial signal correlating with the shape and location of the stimulus was not frequently observed in most runs due to a relatively low signal to noise ratio, in contrast to what we have observed in the cat. The location of the stimulus bar in Figure 5 is slightly offset from the spatial distribution of the optical response, which is similar to the response obtained in the anesthetized cat preparation by our group(11;18).
Figure 5A, 5B.

Spatial distribution of the intrinsic optical signal over the human retina (subject 3) during a bar cycle (A) and blank cycle (B). The approximate retinal location of the projected vertical bar stimulus is shown in A1, and no stimulus was presented on the retina in B1. The dark colors in A2, indicate the relative decrease in the near-infrared light reflected over the stimulated area of retina, comparing pre-stimulus image frames to frames collected during visual stimulation (first frame analysis(14)), while in B2, when no stimulus was given, no localized change was seen. The dark crescents in A2 and B2 are artifacts caused by residual retinal motion within image sequences after motion correction by image registration. These artifacts are caused by the discontinuous intensity of the image at the boundary of the circular camera mask. The scale showing reflectance ratio values of the pseudocolor images is on the right.
Discussion
The results show the existence of a small decrease in near-infrared reflectance from the human retina corresponding to the location of a vertical bar stimulus seen by the subject, and was not present when a blank stimulus was presented. The mixed model analysis shows that this localized decrease in reflectance is small, and was present to some degree in all experiments, in all subjects and in all cycles. However, the response was variable between subjects, possibly related to noise, so that in the per subject ‘individual’ analysis (and therefore over a smaller amount of cycles) a decreasing linear trend in reflectance was found in 3/5 out of subjects for bar but not blank stimuli cycles, but in not in 2/5 out of subjects. The magnitude, polarity and time course are similar to the cortical response found in optical imaging of neocortex of mammals (1). No corresponding change in reflectance was found in non-stimulated areas of the retina or when no stimulus was given, in those subjects in which a linearly decreasing reflectance was observed over time after stimulus onset. The results of this study demonstrated the existence of an intrinsic optical signal in the retina in awake humans, but other potential explanations for the existence of a localized decrease in near-infrared reflectance should also be considered.
First, small eye movements could conceivably change the retinal near-infrared reflectance pattern. For example, if the subject is not fixating properly before the onset of the stimulus and then consistently makes a small, saccadic fixation movement after the stimulus onset for the bar but not for the blank stimulus, there could be a change in retinal reflectance time locked to the stimulus condition. We analyzed the eye movement patterns and found no significant correlation of the x- and y-retinal positions with the reflectance changes r, indicating that eye movements were not contributing to the change in reflectance observed. The time course of the reflectance ratio of the intrinsic signal showed a slow decrease after the stimulus was turned on followed by a slow return to baseline after the stimulus was turned off (Figure 4); these results are also inconsistent with reflectance changes due to microsaccadic eye movements.
Second, inadequate filtering allowing the visible stimulus light reflected from the retina to “bleed” through the dichroic cold mirror and subsequent barrier filter to reach the CCD sensor could cause artifactual stimulus-related changes in retinal reflectance time-locked to the stimulus. We found no evidence for this artifact in the artificial eye experiments, and the intrinsic optical signal that we did measure showed a gradual decrease in reflectance and not the abrupt increase that would be expected from a visible light leak onto the sensor.
Third, non-retinal physiologic factors such as variation in heart rate, respiration, or blood pressure could be influenced by an alerting visual stimulus such as the onset of the bar stimulus and could potentially alter the retinal reflectance of near-infrared light. These physiologic factors were not routinely monitored for the data reported here. However, we performed a separate series of experiments in which the cardiac cycle was synchronized to stimulus presentation/data collection and found the results to be similar to those that were not synchronized (data not shown). It is also difficult to conceive of how such variables would give rise to the localized changes in retinal reflectance that we observed, as opposed to global changes uniformly spread over the retina.
Because there are important similarities between the retina and brain cortex, the origin of the signal described in this study may be similar to the intrinsic optical signal from visual cortex. In primate and human neo-cortex, the intrinsic optical signal is thought to be derived from stimulus related changes in local hemoglobin volume, the oxygenated state of hemoglobin and/or light scattering properties of activated tissue. Light scattering changes are thought to be related to stimulus induced changes in extracellular and intracellular fluids of neurons and glial cells and to changes in the optical properties of membranes due to electrical activity(2;4). In the retina, evidence has also been found recently for the existence of blood flow and light scattering changes in response to visual stimuli. Riva and coworkers have described in-vivo blood flow changes and visible light reflectance changes at the optic nerve head in response to visual stimuli projected onto the retina(7;19;20), Duarte and coworkers have described in-vitro increases in 543nm and 632nm laser light scattering (i.e., decreased reflectance) of the inner plexiform layer in response to electrical activation of the chicken retina(21), and Tsunoda has found the existence of a visually evoked reflectance change in macaque monkeys(8). The novelty of the present study reported here lies in the documentation of a localized reflectance change in the macula in response to a localized visual stimulus in awake humans. At this time, the exact substrate(s) for the intrinsic optical signals recorded in this study has yet to be defined..
The reflectance decrease in response to the visual stimulus is small and difficult to detect in this first series of experiments, even using sophisticated image and signal processing techniques, and may not reveal statistically significant stimulus-related changes in some subjects. We are currently improving the acquisition device and image and signal analysis techniques to increase the signal to noise ratio so that the intrinsic optic signal in response to visual stimulation can be more consistently detected and the origin and location of the signal source within the retinal layers can be defined.
In summary, we have recorded from the retina of normal, awake human subjects a small, localized decrease in reflectance in response to a localized visual stimulus The signal shows a linearly decreasing (but variable) trend in 3/5 subjects.. The spatial and temporal properties of these signals suggest that they reflect the functional activity of the retina, in a manner parallel to previous optical imaging studies of sensory neocortex. If the signal-to-noise ratio can be improved, imaging these stimulus induced changes in near-infrared fundus reflectance in awake humans may in the future offer novel methods for the study of the physiology of the human visual system, and for the early detection of disease states.
Table 1.
Tabulated results of the overall and individual mixed models, analyzing changes in reflectance ratio from just before stimulus onset (window 0) to 2.33-3.33seconds after stimulus onset (window 3). The third and fifth columns give the changes in reflectance ratio (% from , respectively) for bar and ‘blank’ stimuli respectively, and the fourth and sixth columns give the respective confidence intervals. The first row is the overall linear mixed model effect, showing a significant decrease in reflectance ratio from window 0 to 3 during the stimulus bar cycles, but not in the blank cycles. The next five rows show the results of the ‘individual’ mixed model for each of the five subjects, corrected for different numbers of runs for each subject and for the ordering of cycles in runs. This table demonstrates a significant effect of stimulus on reflectance ratio over all subjects, however, these changes in reflectance were highly variable for both bar and blank stimuli across individuals (subjects 1,3, and 5 showed a stimulus related decrease in the reflectance ratio, r).
| Subject | Mixed model | Bar stimulus Change from window 0 to window 3 | 95% CI | ‘Blank’ stimulus Change from window 0 to window 3 | 95% CI |
|---|---|---|---|---|---|
| 1,2,3,4,5 | ‘overall’ | −0.14% | −0.25% - −0.03% | +0.04% | −0.11% - +0.19% |
| 1 | ‘individual’ | −1.25% | −2.62% - +0.13% | +0.07% | −1.87% - +2.02% |
| 2 | ‘individual’ | +0.14% | −0.17% - +0.44% | −0.05% | −0.59% - +0.48% |
| 3 | ‘individual’ | −0.16% | −0.23% - −0.09% | 0.00% | −0.10% - +0.10% |
| 4 | ‘individual’ | +0.13% | −0.09% - + 0.35% | +0.11% | −0.11% - + 0.33% |
| 5 | ‘individual’ | −0.31% | −0.72% - + 0.11% | −0.19% | −0.79% - +0.40% |
Acknowledgment
Simon Barriga, University of New Mexico, Albuquerque, NM, assisted with the data analysis.
Footnotes
Presented in part at the 2004 Meeting of the Association for Research in Vision and Ophthalmology, Fort Lauderdale, FL.
Disclosure: Michael D. Abràmoff: N Young H. Kwon: P Dan Ts'o: P Peter Soliz: E Kestrel Co. Joel Pokorny: N Randy Kardon: P
Support
Michael Abràmoff: K-12 Career Development Award, University of Iowa; Netherlands Organization for Health Related Research, Research to Prevent Blindness, NY,NY (RPB). Young Kwon: National Eye Institute Phase II SBIR NIH/NEI (NEI), RPB; Dan Ts'o NIH/NIBIB, NEI; Peter Soliz NEI; Joel Pokorny NIH/NEI EY00901, RPB Senior Scientific Investigator; Randy Kardon RPB, NEI, and Veterans Administration Merit Review and Rehabilitation grants.
References
- 1.Ts'o DY, Frostig RD, Lieke EE, Grinvald A. Functional organization of primate visual cortex revealed by high resolution optical imaging. Science. 1990;249:417–420. doi: 10.1126/science.2165630. [DOI] [PubMed] [Google Scholar]
- 2.Grinvald A, Shoham D, Glaser D, Vanzette I, Shtoyerman E, Slovin H, Sterkin A, Wijnbergen C, Hildesheim R, Arieli A. In-vivo optical imaging of cortical architecture and dynamics. In: Windhorts U, Johansson H, editors. Modern Techniques in Neuroscience Research. Springer Verlag; Berlin: 2001. [Google Scholar]
- 3.Malonek D, Grinvald A. Interactions between electrical activity and cortical microcirculation revealed by imaging spectroscopy: implications for functional brain mapping. Science. 1996;272:551–554. doi: 10.1126/science.272.5261.551. [DOI] [PubMed] [Google Scholar]
- 4.Cohen LB. Changes in neuron structure during action potential propagation and synaptic transmission. Physiol Rev. 1973;53:373–418. doi: 10.1152/physrev.1973.53.2.373. [DOI] [PubMed] [Google Scholar]
- 5.Holthoff K, Witte OW. Intrinsic optical signals in rat neocortical slices measured with near-infrared dark-field microscopy reveal changes in extracellular space. J.Neurosci. 1996;16:2740–2749. doi: 10.1523/JNEUROSCI.16-08-02740.1996. [DOI] [PMC free article] [PubMed] [Google Scholar]
- 6.Riva CE, Logean E, Falsini B. Visually evoked hemodynamical response and assessment of neurovascular coupling in the optic nerve and retina. Prog.Retin.Eye Res. 2005;24:183–215. doi: 10.1016/j.preteyeres.2004.07.002. [DOI] [PubMed] [Google Scholar]
- 7.Crittin M, Riva CE. Functional imaging of the human papilla and peripapillary region based on flicker-induced reflectance changes. Neurosci.Lett. 2004;360:141–144. doi: 10.1016/j.neulet.2004.02.063. [DOI] [PubMed] [Google Scholar]
- 8.Tsunoda K, Oguchi Y, Hanazono G, Tanifuji M. Mapping cone- and rod-induced retinal responsiveness in macaque retina by optical imaging. Invest Ophthalmol Vis Sci. 2004;45:3820–3826. doi: 10.1167/iovs.04-0394. [DOI] [PubMed] [Google Scholar]
- 9.DeLint PJ, Berendschot TT, van de Kraats J, van Norren D. Slow optical changes in human photoreceptors induced by light. Invest Ophthalmol Vis Sci. 2000;41:282–289. [PubMed] [Google Scholar]
- 10.Bonhoeffer T, Grinvald A. Optical imaging based on intrinsic signals: the methodology. In: Toga AW, Mazziota JC, editors. Brain Mapping. Academic Press; San Diego: 2004. pp. 55–97. [Google Scholar]
- 11.Ts'o D, Kwon YH, Kardon R, Soliz P, Li H, Abràmoff MD, Zarella M. Signal Sources Observed With Intrinsic Signal Optical Imaging Of Retina. Invest Ophthalmol.Vis.Sci. 2004;45 ARVO E-abstract 3495. [Google Scholar]
- 12.Kardon R, Kwon YH, Ts'o D, Soliz P. Ophthalmic technologies XII. The International Society of Optical Engineering; Photonics West: 2002. Optical Imaging Device of Retinal Function; pp. 4611–4640. [Google Scholar]
- 13.Abràmoff MD, Kardon R, Ts'o D, Soliz P, Barriga ES, Li H, Kwon YH. Intrinsic optical imaging of the retina in awake humans. Invest Ophthalmol.Vis.Sci. 2004;45 ARVO E-Abstract 5472. [Google Scholar]
- 14.Abràmoff MD, Kwon YH, Ts'o DY, Li H, Barriga ES, Kardon R. A spatial truncation approach to the analysis of optical imaging of the retina in humans and cats. Proc IEEE International Symposium on Biomedical Imaging 2004. 2004;2:1115–1118. [Google Scholar]
- 15.Abràmoff MD, Magalhães PJ, Ram S. Image Processing with ImageJ. Biophotonics. 2004;11:36–42. [Google Scholar]
- 16.Ritter N, Owens R, Cooper J, Eikelboom RH, van Saarloos PP. Registration of stereo and temporal images of the retina. IEEE Trans.Med.Imaging. 1999;18:404–418. doi: 10.1109/42.774168. [DOI] [PubMed] [Google Scholar]
- 17.Kowalchuk RK, Keselman HJ, Algina J, Wolfinger RD. The Analysis of Repeated Measurements with Mixed-Model Adjusted F Tests. Educational and Psychological Measurement. 2004;64(2):224–242. [Google Scholar]
- 18.Ts'o D, Li H, Kwon YH, Truitt P, Soliz P. Intrinsic signal optical imaging of retinal responses to patterned stimuli. Invest Ophthalm Vis Sci [ARVO abstract] 2003:43. [Google Scholar]
- 19.Riva CE, Harino S, Shonat RD, Petrig BL. Flicker evoked increase in optic nerve head blood flow in anesthetized cats. Neurosci.Lett. 1991;128:291–296. doi: 10.1016/0304-3940(91)90282-x. [DOI] [PubMed] [Google Scholar]
- 20.Falsini B, Riva CE, Logean E. Flicker-evoked changes in human optic nerve blood flow: relationship with retinal neural activity. Invest Ophthalmol.Vis.Sci. 2002;43:2309–2316. [PubMed] [Google Scholar]
- 21.Duarte MA, Almeida AC, Infantosi AF, Bassani JW. Functional imaging of the retinal layers by laser scattering: an approach for the study of Leao's spreading depression in intact tissue. J Neurosci Methods. 2003;123:139–151. doi: 10.1016/s0165-0270(02)00346-1. [DOI] [PubMed] [Google Scholar]