

Abstract
Understanding the genes that contribute to reproductive isolation is essential to understanding speciation, but isolating such genes has proven very difficult. In this study I apply a multilocus test statistic to >10,000 SNP markers assayed in wild-derived inbred strains of house mice to identify genomic regions of elevated differentiation between two subspecies of house mice, Mus musculus musculus and M. m. domesticus. Differentiation was high through ∼90% of the X chromosome. In addition, eight regions of high differentiation were identified on the autosomes, totaling 7.5% of the autosomal genome. Regions of high differentiation were confirmed by direct sequencing of samples collected from the wild. Some regions of elevated differentiation have an overrepresentation of genes with host–pathogen interactions and olfaction. The most strongly differentiated region on the X has previously been shown to fail to introgress across a hybrid zone between the two subspecies. This survey indicates autosomal regions that should also be examined for differential introgression across the hybrid zone, as containing potential genes causing hybrid unfitness.
Speciation in sexual organisms occurs as barriers to gene flow evolve between previously interbreeding populations. Part of a research program to elucidate the origin of species therefore requires an understanding of how and why new traits arise that reproductively isolate populations and to identify the genes controlling these traits (Coyne 1992). The genetic basis underlying the origin of new species has been studied mainly in Drosophila. Results of these studies suggest that the genes generally evolved under the influence of positive selection (Barbash et al. 2003; Presgraves et al. 2003; Ting et al. 2004; Greenberg et al. 2006) and involve various normal functions in the organism. While not studied in detail on the molecular level, one gene has also been isolated that is involved in reproductive isolation between two species of mouse, Mus musculus and Mus spretus (Fossella et al. 2000).
A prerequisite to study the process of speciation and eventually identify the genes involved in it is a close relationship among the taxa. Close relationships among taxa imply that the identified genetic differences are more likely to be involved in the speciation process rather than accumulating after speciation is completed. The house mouse provides an ideal study system. At least three different subspecies are distinguished, which diverged from each other between 0.8 and 1 million years ago (Mya) (Boursot et al. 1993; Guenet and Bonhomme 2003). M. m. domesticus and M. m. musculus are the best studied subspecies. M. m. domesticus ranges across western Europe, northern Africa, and the middle East, whereas musculus extends throughout eastern Europe and northern Asia. The two subspecies meet in a narrow hybrid zone, which most likely is maintained by a balance between selection against hybrids and dispersal (Hunt and Selander 1973; Payseur et al. 2004).
One general approach toward the identification of genes involved in speciation relies on identifying regions of the genome that are strongly differentiated between populations or species (Cavalli-Sforza 1966). Regions of elevated genetic differentiation can then be used to search for candidate genes (Akey et al. 2002; Payseur et al. 2002; Kayser et al. 2003; Storz et al. 2004; Storz 2005).
Previously, this approach has been applied in the hybrid zone between the two subspecies of house mice along a transect in eastern Germany (Tucker et al. 1992; Payseur et al. 2004; Payseur and Nachman 2005) and Denmark (Dod et al. 1993). The expectation is that genes causing reproductive isolation introgress at lower rates than genes not involved in reproductive isolation (Barton and Hewitt 1981). However, the number of markers was very limited in these studies (Tucker et al. 1992; Dod et al. 1993) or restricted to a single chromosome (Payseur et al. 2004; Payseur and Nachman 2005). Thus, a more systematic overview over patterns of differentiation over the whole genome is desirable.
In this report I used genomic resources publicly available as thousands of SNP markers typed by The Wellcome Trust Center for Human Genetics in wild-derived inbred strains of the house mouse to systematically identify genomic regions that are highly differentiated between subspecies. I confirm that the X chromosome is strongly differentiated, as expected from previous hybrid zone work (Tucker et al. 1992; Dod et al. 1993), but also identify several regions on the autosomes that are similarly highly differentiated. I consider how these regions might have originated and the genes they contain.
Results
Taxa
The genetic makeup of laboratory strains of the house mouse, from which the SNPs available from The Wellcome Trust Center for Human Genetics are derived, is a mixture with the largest contribution from Mus musculus domesticus (∼60%), an intermediate contribution from Mus musculus musculus (∼30%), and a small contribution from Mus musculus castaneus (∼10%) (Wade et al. 2002; Wade and Daly 2005). The tree based on all 13,000 SNPs showed that most wild-derived inbred strains cluster into three well supported clades (Fig. 1). Combined with the information in Table 1, all three clades were unambiguously assigned to one of the three subspecies of Mus musculus or to Mus spretus. For three strains (PWK/Rbrc, PWK/Ros, PWK/Pas), no information was available from The Jackson Laboratory Web site (http://jaxmice.jax.org/query). However, Gregorova and Forejt (2000) state their origin is in the Czech Republic. These strains are substrains derived from PWK/Ph and they all clearly cluster within other strains of the subspecies musculus. Four of the wild-derived inbred strains were assigned to the subspecies castaneus (Table 1). These strains did not cluster together but are located dispersed and more ancestrally between the sister species Mus spretus and the strains from the Mus musculus subspecies musculus. One explanation for this pattern is ascertainment bias stemming from the selection process of the SNP markers. Since most mutations are polymorphic in domesticus, because this is the subspecies with the highest genetic contribution to laboratory strains, castaneus is expected to harbor the ancestral state. Thus, these strains are placed more toward the common ancestor of all subspecies, Mus spretus. The few SNPs that are polymorphic in castaneus provide too little resolution to cluster all four strains together on one branch. An alternative explanation for the position of castaneus strains on the tree could be that they stem from localities that are closer to the assumed ancestral origin of all house mouse subspecies (i.e., India and Thailand [Boursot et al. 1993), which could mean that they represent a larger and more ancestral diversity range.
Figure 1.

Maximum likelihood phylogenetic tree showing the relationships among wild-derived inbred strains of Mus musculus and Mus spretus. The tree was graphically represented in TreeView (Page 1996).
Table 1.
Geographic origin and other strain characteristics as obtained from The Jackson Laboratory Web site for the inbred strains included in the SNP survey

aOrigin of strains given in Gregorova and Forejt (2000).
As expected from the ascertainment bias during the selection process of SNP markers, the branch lengths for members of subspecies domesticus were longer than branches for other subspecies. However, within musculus strains there was still a substantial amount of variation evident, which was roughly proportional to the contribution of this subspecies to the genetic makeup of laboratory strains.
Only strains clustering within musculus and within domesticus were used for further analysis (seven domesticus and eight musculus). Among the 13,000 SNPs, 10,265 were polymorphic in either domesticus (6281 SNPs) or musculus (1146 SNPs) or both subspecies (1650 SNPs) or showed a fixed difference between the subspecies (1188 SNPs). These 10,265 “variable” SNPs were used for further analysis. The number of SNPs per chromosome was correlated with chromosome size (Pearson r = 0.767, N = 20 chromosomes, P < 0.0001). The largest chromosome (chromosome 1) contained 804 SNPs, and the smallest (chromosome 19) contained 235 SNPs. The total number of variable SNPs was used to generate the expected values for the χ2 test. The ratio of SNPs showing a fixed difference between strains to those that were polymorphic in at least one strain was 1188/9077 = 0.13, which yields an expected number of fixed SNPs of 7.9 and polymorphic SNPs of 52.1 in a 60-SNP sliding window.
Differentiation based on SNP analysis from lab strains
I searched for significant regions of differentiation using a χ2 test and a permutation test, as explained in the Methods. In the Supplemental material I describe analyses using SNP windows from 20–100 SNPs in size. In the main text I confine the discussion to the results obtained from a sliding window size of 60 SNPs, which provides a resolution similar to that obtained from smaller window sizes, whereas windows of >60 SNPs give results that are inconsistent with the permutation test (see Supplemental material).
Figure 2 shows heterogeneity in differentiation along those chromosomes where both the χ2 test and the permutation test identified at least one region to be significantly highly differentiated between the two subspecies. The permutation test identifies three additional chromosomes (3, 7, 9) over the χ2 test with a window of larger differentiation than expected (see Supplemental Table 2). In the following, however, I consider only regions for which both tests were significant.
Figure 2.

Signed ln-transformed P-values from a χ2 analysis of a sliding window plotted against chromosomal position (midpoint of a sliding window). Positive values on the y-axis indicate a deficiency in the number of fixed differences between the subspecies while negative values indicate more fixed differences than expected. Sliding windows consist of 60 SNPs moved for five SNP each step. (Dashed line) Significance level for a surplus of fixed differences among subspecies, (arrows) regions of significantly elevated differentiation, (short horizontal gray bars) regions that were chosen for direct sequencing of independent samples of M. m. musculus and M. m. domesticus. Only chromosomes where significant differentiation was found are shown. Note that the y-axis of the X chromosome differs from those of the autosomes because of the overall much higher differentiation of the X. Base positions on the x-axis need to be multiplied by 107.
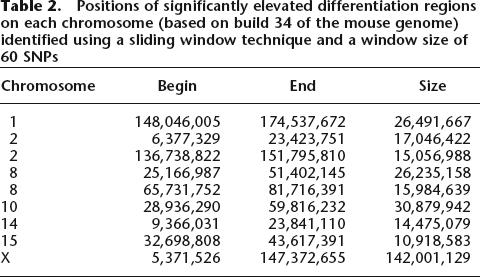
Eight regions of elevated differentiation are present on the autosomes (Fig. 2). Their exact genomic position based on the most recent assembly of the mouse genome (build 34) is given in Table 2. Two chromosomes contained more than one region where sliding windows of high differentiation (P > 0.015) did not overlap (chromosome 2 and 8). Most chromosomes showed no region of elevated differentiation (chromosomes 3–7, 9, 11–13, 16–19). Regions of significant differentiation covered ∼7.5% of the autosomes in total, with an average length of 20 Mb (from ∼11 Mb [chromosome 15] to 31 Mb [chromosome 10]). In contrast to the autosomes, elevated differentiation spanned almost across the entire X chromosome (88%, Fig. 2), with two large regions of elevated differentiation separated by a region of lower differentiation. However, the sliding windows of both high differentiation regions overlap on the X chromosome. Thus, a contiguous region of elevated differentiation on the X chromosome is given in Table 2.
Table 2.
Positions of significantly elevated differentiation regions on each chromosome (based on build 34 of the mouse genome) identified using a sliding window technique and a window size of 60 SNPs
Natural populations
The results from direct sequencing of natural populations of musculus (from the Czech Republic, 14 chromosomes sequenced) and domesticus (from Germany, 16 chromosomes sequenced) are shown in Figure 3 and Table 3. The average Gst value within the sequenced fragments, which is based on based on polymorphic sites only, was significantly higher for fragments located in the candidate regions of high differentiation (as identified from the SNP survey of wild-derived inbred strains) than for fragments that are located outside of these regions (P = 0.0003, t-test, df = 12). Thus, regions identified by the SNP analysis were confirmed in an independent sample. Nei’s statistic (Nei 1987) is based on the average pairwise divergence across all sites, including those that are identical in each species, and appears less powerful. Although not significant, Nei’s average divergence averages 22% higher for high differentiation regions than for low differentiation regions (average divergence in high differentiation region = 0.011, average divergence in reference region = 0.008, Table 3). Also, sequences from each individual more often coalesce within the assigned subspecies for the loci located in high differentiation regions than for loci located in low differentiation regions (Supplemental Fig. 1).
Figure 3.

Mean and 95% confidence interval of average Gst based on direct sequencing of fragments within high (N = 8) and low (N = 6) differentiation regions in natural population of house mice.
Table 3.
Summary of polymorphism data from natural populations of M. m. musculus and M. m. domesticus

div: divergence according to Nei (1987)
Seg Sites: number of segregating sites
I found no measurable differences in divergence to M. famulus between regions of high and low differentiation (P = 0.551, t-test, df = 11: Of the 14 genomic fragments sequenced, I was unable to amplify one fragment in famulus, hence the number of degrees of freedom is 11).
Functional annotation of candidate regions
The full list of functional themes that were significantly (P ≤ 0.05, binomial test) overrepresented among the genes located in the high differentiation regions is available as Supplemental Table 3. The most significant entry in this list was found for chromosome 1, where genes related to immunity and defense were strongly (P < 0.000001) overrepresented. Next most overrepresented functional categories in the highly differentiated regions are genes related to proteolysis on chromosome 2 (P = 0.00004) and olfactory genes on chromosome 1 (P = 0.00011). These three identified categories of genes are also significant when corrected for testing of multiple categories (Bonferroni P < 0.0002, 244 functional categories tested).
Recombination rates
Previously, it has been shown that elevated differentiation was confined to regions of reduced recombination (Turner et al. 2005). Recombination rates are available only for a cross between a laboratory strain (B6-Ob) and M. m. castaneus (Dietrich et al. 1996), which limits the comparison between musculus and domesticus. Using these rates, the association between recombination rate and differentiation in my study is very low (r = 0.047; Fig. 4).
Figure 4.

Correlation between recombination rate and average Gst in a sliding window size of 60 SNPs.
Discussion
Genetic changes that lead to the split of one species into two are of major interest in evolutionary biology. The house mouse is an ideal model system because it consists of three “incipient” species, i.e., subspecies. Initial differentiation of these subspecies probably took place on the Indian subcontinent ∼0.5–1 Mya (Boursot et al. 1993; Guenet and Bonhomme 2003). It is thought that house mice started to colonize most of the Eurasian continent and Northern Africa ∼10,000 yr ago, in association with the origin of human commensalism. Each subspecies followed its own colonization route, and the resulting distribution is nearly non-overlapping. Where the subspecies come into contact they form hybrid zones (Boursot et al. 1993).
My survey of ∼10,265 SNP loci on all chromosomes except the Y is the first to address the question of how genetic differences between subspecies of the house mouse are distributed across the genome. I found several “genomic islands” of large differentiation between strains derived from musculus and domesticus. The largest difference between the two subspecies was along the X chromosome, but some regions of the autosomes were also strongly differentiated. Some potential sources of bias can be eliminated. Within domesticus a number of chromosomal races are known, which possess different combinations of two chromosomes joined together in Robertsonian fusions (Nachman and Searle 1995). It is therefore possible that the result is an artifact of considering one or other chromosomal race. However, four of the seven domesticus strains contained different Robertsonian fusions (Table 1), while the other three contained the standard karyotype. This heterogeneity should increase the variance within domesticus, making it harder to detect fixed differences between the subspecies. In addition, I was able to confirm the pattern of high and low differentiation regions using independent animal samples collected from nature.
While I found several regions of high differentiation on the autosomes, the overall proportion of the autosomal genome that showed strong differentiation was relatively small (∼7.5%). Similarity across most regions of the autosomal genome could reflect (1) significant introgression of genetic material across the subspecies boundaries, (2) ancestral polymorphism, and (3) lower mutation rates in the region without significant differentiation. To examine this I analyzed the 10,265 SNP loci in three individuals of the closely related species Mus spretus. 9% (897) of the SNPs that were polymorphic within at least one of the musculus subspecies were also polymorphic in spretus. Ideraabdullah et al. (2004) sequenced 62 genomic fragments from 14 chromosomes in several wild-derived strains of the species musculus, spretus, and spicilegus and also found a relatively high frequency of ancestral polymorphisms (∼13%). Thus, ancestral polymorphism likely contributes to a fraction of the sites that are not fixed between the subspecies.
Under neutral expectations, divergence should be proportional to the mutation rate in a region. Since the mutation rate of the X chromosome is lower than the mutation rate on the autosomes (it is thought that the mutation rate of the X chromosome is ∼70% that of the autosomes [McVean and Hurst 1997]), the X chromosome is expected to show lower differentiation. However, I observe the opposite: The level of differentiation between the subspecies is greatly elevated on the X chromosome relative to the autosomes. In addition, mutation rate effects are unlikely to explain differences between regions of high and low differentiation along the autosomes. I tested this by calculating the average divergence between natural populations of the musculus subspecies and the outgroup Mus famulus for each of the sequenced fragments. I found divergence from M. famulus was similar in the regions of high and low differentiation.
Divergent selection between the subspecies is the most likely cause of regional differentiation. Genes located in the regions of elevated differentiation are candidate targets for selection. Although there are many genes in these regions, the most overrepresented category is genes related to immune response and proteolysis (proteolysis occurs during immune response [Liu 2004]). Genes such as these may be involved in host–pathogen interaction; based on comparisons of non-synonymous/synonymous (dN/dS) divergence, these genes have been shown to be common targets of directional selection (Tanaka and Nei 1989; Schlenke and Begun 2003). The other genes most strongly overrepresented in regions of high differentiation are those related to olfaction. A high dN/dS ratio observed among members of the olfactory gene clusters in mice also suggests positive selection for these genes, possibly favoring taxon-specific pheromone detection (Zhang et al. 2004). Immune defense genes and genes related to olfaction were also found in a recent survey of human and chimpanzee genomes to be evolving particularly fast under positive selection (Bustamante et al. 2005; Nielsen et al. 2005).
Evidence for high regional differentiation within and among chromosomes does not directly address the question of whether these regions are involved in reproductive isolation. In mice, olfaction is known to be important for pre-mating isolation (Talley et al. 2001). In general, only a few genes involved in post-mating isolation have been identified (Orr et al. 2004), and their normal functions within populations are still largely unknown (e.g., Sun et al. 2004). In mice, two methods have recently been used in an attempt to narrow down regions that may contain candidate genes causing hybrid unfitness. First, Payseur and Hoekstra (2005) screened multiple laboratory inbred strains of house mice for physically unlinked SNP pairs that are in linkage disequilibrium. In this way, they identified 14 pairs of gene complexes that could be causing reproductive incompatibilities. While suggesting candidate regions, their approach has the complication that the unknown breeding history of the strains plus selection in the laboratory cannot completely be ruled out as a cause of the linkage disequilibrium (Payseur and Hoekstra 2005).
The proximal part of chromosome 17 has been associated with hybrid male sterility in crosses between laboratory strains of house mice and certain Mus musculus strains (Forejt and Ivanyi 1974). The responsible locus (Hst1) has recently been narrowed down to a region encompassing two candidate genes (Trachtulec et al. 2005). Interestingly, neither the study by Payseur and Hoekstra (2005) nor my analysis of genome-wide differentiation highlighted this region as being significant. While Payseur and Hoekstra (2005) found one SNP on chromosome 17 to be in disequilibrium with a SNP on chromosome 5, this SNP mapped 10 Mb distal to the Hst1 locus. One explanation for the absence of significant differentiation of the proximal part of chromosome 17 is that the Hst1 alleles, which are causing hybrid sterility, are still segregating in natural populations of both subspecies (Forejt 1996).
A second method to identify regions involved in post-mating isolation is to study introgression across a natural hybrid zone; portions of the genome that do not introgress may carry genes causing post-mating incompatibilities. Dod et al. (1993) and Tucker et al. (1992) used a small number of markers and found a lower rate of introgression across the hybrid zone for X-linked markers. Among the three X-linked loci that were analyzed by Dod et al. (1993), one locus showed especially low introgression rates across the hybrid zone. The exact physical position of this anonymous marker is not known. However, the genetic map position is available from The Jackson Laboratory Web site. The marker is very closely linked to the Pgk1 (phosphoglycerate kinase 1) gene. The physical position of the Pgk1 gene (as determined from the Ensembl Web site) is within 1 Mb to the most strongly differentiated region on the X chromosome discovered in my SNP differentiation screen. Also, Payseur et al. (2004), using 13 microsatellite markers on the X, identified this general region on the X chromosome as being especially retarded in its movement across the zone, and the same region harbors the Hstx1 hybrid sterility locus (Storchova et al. 2004). The region of highest differentiation on the X chromosome in the SNP scan described here (from mice largely taken far from the hybrid zone) is thus identical with the region identified previously as showing the lowest introgression and containing a gene involved in reproductive isolation.
The autosomal regions of high differentiation identified in SNP scan should now be examined for differential introgression across the hybrid zone. Those regions showing limited introgression are particularly likely to contain genes involved in reproductive isolation.
Methods
SNP database
The Wellcome Trust Center for Human Genetics provides information on 13,370 Single Nucleotide Polymorphisms (SNPs) from 480 Mus musculus inbred strains that have been maintained by sibling matings for 20 or more consecutive generations. Most of the SNPs were identified by direct sequence comparisons between five strains (DBA/2J, A/J, C57BL/6J, 129S1/SvImJ, 129X1/SvJ), and some SNPs were included from other studies (see Web site: http://www.well.ox.ac.uk/mouse/INBREDS/). The SNPs are more or less equally distributed over all chromosomes, but no SNPs are available that map close to the centromeres and telomeres of each chromosome. The strains from which the SNPs were identified are all laboratory inbred strains, which are mixtures between different subspecies of the house mouse but with a predominant influence of Mus musculus domesticus (Wade et al. 2002; Wade and Daly 2005). Most of the strains are rather artificial laboratory lines from multiple sources, but the data set also includes 22 wild-derived strains, among them three strains from the sister species Mus spretus. These 22 strains formed the focus of this study. Using the Web interface of the Web site given above, I downloaded all SNPs where at least one of the strains showed a different nucleotide state from the others.
Phylogenetic clustering of the strains based on SNP data
Information about subspecies affiliation of most of the 22 strains is available on The Jackson Laboratory Web site (Table 1). For some strains, the subspecies affiliation was not available on The Jackson Laboratory Web site. To both confirm the subspeciesaffiliation of each strain and identify those whose identification was uncertain, I estimated the phylogenetic relationships of the strains. I used the maximum likelihood program tree-puzzle version 5.2 (Schmidt et al. 2002), having first concatenated the nucleotide states of each SNP locus to obtain a single sequence. Based on the phylogenetic grouping and available strain information (Table 1), I assigned the genotyped wild-derived strains to individual subspecies of house mice. A sufficient number of strains was available for further analysis only for the subspecies domesticus (seven strains) and musculus (eight strains).
SNP polymorphism analysis
I employ a multilocus test statistic, which searches for a clustering of sites showing a fixed difference between the subspecies when compared with the genome-wide average. To search for a regional clustering of fixed differences, a sliding window technique was used. The window size ranged from 20 SNPs to 100 SNPs in each window, and the window was moved five SNPs at each step along each chromosome. A χ2 statistic was used to test whether the number of fixed SNPs in each window was more than expected by chance. The expectation is based on the overall frequency of fixed SNPs in the whole data set. I selected all windows with χ2 test P-values ≤ 0.015 as candidate regions for regional high differentiation.
I also used a second test to detect regional elevated differentiation based on permutation. For this test I set up a null hypothesis based on the distribution of SNPs along each chromosome, rather than the whole genome as was the case for the χ2 test. I randomized SNPs within a chromosome and performed the sliding window analysis (as before using window sizes between 20 and 100 SNPs) on the randomized data (1000 random data sets per chromosome). For each chromosome, the window with the highest number of fixed SNPs in each permutated data set was recorded and compared with the window with the highest number of fixed SNPs in the observed (non-randomized) data set. The number of times where I found a window with higher differentiation in the randomized data set compared with the most differentiated window in the observed data divided by the number of permutations corresponds to the P-value. Chromosomes with a P-value ≤ 0.015 were considered to harbor at least one region of significant elevated differentiation. All statistical analyses were performed using Perl scripts available from the author upon request.
Sequencing
In order to confirm the results from the SNP analysis, I sequenced wild-caught individuals. I used seven individuals from a natural M. m. musculus population collected in Kazakhstan in 2002 and eight individuals from a natural M. m. domesticus population (Germany, collected in 2001) for direct sequencing. All individuals were collected >400 km away from the hybrid zone using a sampling strategy that eliminates the chance of collecting related animals (Ihle et al. 2006). As an outgroup I sequenced one animal of Mus famulus collected in India and kindly provided by F. Bonhomme. I chose M. famulus as the outgroup for sequencing because its more distant relationship to M. musculus (estimated 2.8 Myr [Chevret et al. 2003]) means that it is less likely to share ancestral polymorphisms with Mus musculus than Mus spretus (see Results; Ideraabdullah et al. [2004).
I sequenced eight genomic fragments located in five of the regions that were identified by the SNP analysis to be highly differentiated and an additional six fragments located outside of highly differentiated regions. Each fragment consisted of 700–800 bp of non-coding sequence (either 5′ or 3′ flanking regions or from an intron). Information about the sequenced fragments can be found in Supplemental Table 4.
I used a 50-μL PCR containing 100 ng of genomic DNA, 1.5 mM MgCl2, 200 μM dNTPs, 1 μM of each primer, and 0.5 U Taq polymerase (Eppendorf Master Taq). A typical cycling profile consisted of 30 cycles with 50 sec at 94°C, 50 sec at 60°C, and 2 min at 72°C. PCR products were purified using 96-well plates (Millipore Montagé) according to the manufacturer’s protocol. All PCR products were directly sequenced in both directions using the BigDye sequencing chemistry on an ABI3700 automated sequencer. In the case of individuals being heterozygous for an insertion/deletion, I cloned both alleles (TA cloning kit, Invitrogen) and sequenced eight clones per individual. Sequencing reactions were purified using Sephadex columns (Millipore). All sequence data is downloadable in aligned Nexus format from the author’s Web site (http://www.genetik.uni-koeln.de/groups/Tautz/meg/).
DNA sequence data analysis
DNA sequences were aligned using MUSCLE (Edgar 2004). As an estimate of differentiation between the subspecies, I calculated the Gst value (Nei 1973) for each polymorphic site in the sample of both subspecies and took the average over each fragment. These averages were compared between the loci from inside the identified differentiated regions to those from outside these regions by means of a t-test. I also calculated the nucleotide divergence (average proportion of nucleotide differences) between both subspecies according to Nei (1987) using the program DNAsp (Rozas et al. 2003).
Identification of functional categories
I used the Ensembl Web site (www.ensembl.org) to download all genes located in regions with significantly elevated differentiation. The gene lists were subsequently submitted to PANTHER (http://www.pantherdb.org), which identifies overrepresented functional categories among the significant regions (Mi et al. 2005). Significance is established by comparing the gene list with a reference list (in this case the full gene content of the mouse genome) by means of a binomial test (Cho and Campbell 2000).
Recombination rates
Reduced recombination might be an important cause of large blocks of the genome being restricted to one or other subspecies (Turner et al. 2005). To test this I used recombination rates estimated for each chromosome in the mouse genome in 5-Mb non-overlapping windows (Jensen-Seaman et al. 2004). The midpoint of each window together with the respective recombination rate can be downloaded from http://www.genome.org/content/vol14/issue4/images/data/528/DC1/Jensen-Seaman-19703_ SupTable_B.txt. These data were used to extract recombination rates for each sliding window analyzed in the SNP differentiation scan. To test whether genomic regions of elevated differentiation are located in areas of reduced recombination, I calculated the correlation coefficient between the average Gst value (Nei 1973) of all SNPs located within a sliding window and the recombination rate in this window.
Acknowledgments
I am especially thankful to B. Schmitz for expert technical assistance and to T. Price for helpful discussion. I thank J. Baines for contributing some unpublished data. T. Price and D. Tautz helped to improve the manuscript. T. Bayer helped with some programming issues, and L. Bunger first pointed me to the Wellcome Trust SNP database resource. I am thankful to S. Ihle and S. Kipp for providing wild mouse samples. I also thank three anonymous reviewers who provided insightful comments on the manuscript. This work has been funded by an Emmy-Noether fellowship by the DFG to B. Harr.
Footnotes
[Supplemental material is available online at www.genome.org.]
Article published online before print. Article and publication date are at http://www.genome.org/cgi/doi/10.1101/gr.5045006
References
- Akey J.M., Zhang G., Zhang K., Jin L., Shriver M.D., Zhang G., Zhang K., Jin L., Shriver M.D., Zhang K., Jin L., Shriver M.D., Jin L., Shriver M.D., Shriver M.D. Interrogating a high-density SNP map for signatures of natural selection. Genome Res. 2002;12:1805–1814. doi: 10.1101/gr.631202. [DOI] [PMC free article] [PubMed] [Google Scholar]
- Barbash D.A., Siino D.F., Tarone A.M., Roote J., Siino D.F., Tarone A.M., Roote J., Tarone A.M., Roote J., Roote J. A rapidly evolving MYB-related protein causes species isolation in Drosophila. Proc. Natl. Acad. Sci. 2003;100:5302–5307. doi: 10.1073/pnas.0836927100. [DOI] [PMC free article] [PubMed] [Google Scholar]
- Barton N.H., Hewitt G.M., Hewitt G.M.1981. Hybrid zones and speciation. In Evolution and speciation: Essays in honor of M.J.D. White (eds. W.R. Atchley and D.S. Woodruff), pp. 109–145. Cambridge University Press; Cambridge, UK [Google Scholar]
- Boursot P., Auffray J.C., Brittondavidian J., Bonhomme F., Auffray J.C., Brittondavidian J., Bonhomme F., Brittondavidian J., Bonhomme F., Bonhomme F. The evolution of house mice. Annu. Rev. Ecol. Syst. 1993;24:119–152. [Google Scholar]
- Bustamante C.D., Fledel-Alon A., Williamson S., Nielsen R., Hubisz M.T., Glanowski S., Tanenbaum D.M., White T.J., Sninsky J.J., Hernandez R.D., Fledel-Alon A., Williamson S., Nielsen R., Hubisz M.T., Glanowski S., Tanenbaum D.M., White T.J., Sninsky J.J., Hernandez R.D., Williamson S., Nielsen R., Hubisz M.T., Glanowski S., Tanenbaum D.M., White T.J., Sninsky J.J., Hernandez R.D., Nielsen R., Hubisz M.T., Glanowski S., Tanenbaum D.M., White T.J., Sninsky J.J., Hernandez R.D., Hubisz M.T., Glanowski S., Tanenbaum D.M., White T.J., Sninsky J.J., Hernandez R.D., Glanowski S., Tanenbaum D.M., White T.J., Sninsky J.J., Hernandez R.D., Tanenbaum D.M., White T.J., Sninsky J.J., Hernandez R.D., White T.J., Sninsky J.J., Hernandez R.D., Sninsky J.J., Hernandez R.D., Hernandez R.D., et al. Natural selection on protein-coding genes in the human genome. Nature. 2005;437:1153–1157. doi: 10.1038/nature04240. [DOI] [PubMed] [Google Scholar]
- Cavalli-Sforza L.L. Population structure and human evolution. Proc. R. Soc. Lond. B. Biol. Sci. 1966;164:362–379. doi: 10.1098/rspb.1966.0038. [DOI] [PubMed] [Google Scholar]
- Chevret P., Jenkins P., Catzeflis F., Jenkins P., Catzeflis F., Catzeflis F. Evolutionary systematics of the Indian mouse Mus famulus Bonhote, 1898: Molecular (DNA/DNA hybridization and 12S rRNA sequences) and morphological evidence. Zool. J. Linn. Soc. 2003;137:385–401. [Google Scholar]
- Cho R.J., Campbell M.J., Campbell M.J. Transcription, genomes, function. Trends Genet. 2000;16:409–415. doi: 10.1016/s0168-9525(00)02065-5. [DOI] [PubMed] [Google Scholar]
- Coyne J.A. Genetics and speciation. Nature. 1992;355:511–515. doi: 10.1038/355511a0. [DOI] [PubMed] [Google Scholar]
- Dietrich W.F., Miller J., Steen R., Merchant M.A., Damron-Boles D., Husain Z., Dredge R., Daly M.J., Ingalls K.A., O’Connor T.J., Miller J., Steen R., Merchant M.A., Damron-Boles D., Husain Z., Dredge R., Daly M.J., Ingalls K.A., O’Connor T.J., Steen R., Merchant M.A., Damron-Boles D., Husain Z., Dredge R., Daly M.J., Ingalls K.A., O’Connor T.J., Merchant M.A., Damron-Boles D., Husain Z., Dredge R., Daly M.J., Ingalls K.A., O’Connor T.J., Damron-Boles D., Husain Z., Dredge R., Daly M.J., Ingalls K.A., O’Connor T.J., Husain Z., Dredge R., Daly M.J., Ingalls K.A., O’Connor T.J., Dredge R., Daly M.J., Ingalls K.A., O’Connor T.J., Daly M.J., Ingalls K.A., O’Connor T.J., Ingalls K.A., O’Connor T.J., O’Connor T.J. A comprehensive genetic map of the mouse genome. Nature. 1996;380:149–152. doi: 10.1038/380149a0. [DOI] [PubMed] [Google Scholar]
- Dod B., Jermiin L.S., Boursot P., Chapman V.H., Nielsen J.T., Bonhomme F., Jermiin L.S., Boursot P., Chapman V.H., Nielsen J.T., Bonhomme F., Boursot P., Chapman V.H., Nielsen J.T., Bonhomme F., Chapman V.H., Nielsen J.T., Bonhomme F., Nielsen J.T., Bonhomme F., Bonhomme F. Counterselection on sex-chromosomes in the Mus musculus European hybrid zone. J. Evol. Biol. 1993;6:529–546. [Google Scholar]
- Edgar R.C. MUSCLE: Multiple sequence alignment with high accuracy and high throughput. Nucleic Acids Res. 2004;32:1792–1797. doi: 10.1093/nar/gkh340. [DOI] [PMC free article] [PubMed] [Google Scholar]
- Forejt J. Hybrid sterility in the mouse. Trends Genet. 1996;12:412–417. doi: 10.1016/0168-9525(96)10040-8. [DOI] [PubMed] [Google Scholar]
- Forejt J., Ivanyi P., Ivanyi P. Genetic studies on male sterility of hybrids between laboratory and wild mice (Mus musculus L). Genet. Res. 1974;24:189. doi: 10.1017/s0016672300015214. [DOI] [PubMed] [Google Scholar]
- Fossella J., Samant S.A., Silver L.M., King S.M., Vaughan K.T., Olds-Clarke P., Johnson K.A., Mikami A., Vallee R.B., Pilder S.H., Samant S.A., Silver L.M., King S.M., Vaughan K.T., Olds-Clarke P., Johnson K.A., Mikami A., Vallee R.B., Pilder S.H., Silver L.M., King S.M., Vaughan K.T., Olds-Clarke P., Johnson K.A., Mikami A., Vallee R.B., Pilder S.H., King S.M., Vaughan K.T., Olds-Clarke P., Johnson K.A., Mikami A., Vallee R.B., Pilder S.H., Vaughan K.T., Olds-Clarke P., Johnson K.A., Mikami A., Vallee R.B., Pilder S.H., Olds-Clarke P., Johnson K.A., Mikami A., Vallee R.B., Pilder S.H., Johnson K.A., Mikami A., Vallee R.B., Pilder S.H., Mikami A., Vallee R.B., Pilder S.H., Vallee R.B., Pilder S.H., Pilder S.H. An axonemal dynein at the Hybrid Sterility 6 locus: Implications for t haplotype-specific male sterility and the evolution of species barriers. Mamm. Genome. 2000;11:8–15. doi: 10.1007/s003350010003. [DOI] [PubMed] [Google Scholar]
- Greenberg A.J., Moran J.R., Fang S., Wu C.I., Moran J.R., Fang S., Wu C.I., Fang S., Wu C.I., Wu C.I. Adaptive loss of an old duplicated gene during incipient speciation. Mol. Biol. Evol. 2006;23:401–410. doi: 10.1093/molbev/msj045. [DOI] [PubMed] [Google Scholar]
- Gregorova S., Forejt J., Forejt J. PWD/Ph and PWK/Ph inbred mouse strains of Mus m. musculus subspecies–A valuable resource of phenotypic variations and genomic polymorphisms. Folia Biol. (Praha) 2000;46:31–41. [PubMed] [Google Scholar]
- Guenet J.L., Bonhomme F., Bonhomme F. Wild mice: An ever-increasing contribution to a popular mammalian model. Trends Genet. 2003;19:24–31. doi: 10.1016/s0168-9525(02)00007-0. [DOI] [PubMed] [Google Scholar]
- Hunt W.G., Selander R.K., Selander R.K. Biochemical genetics of hybridization in European house mice. Heredity. 1973;31:11–33. doi: 10.1038/hdy.1973.56. [DOI] [PubMed] [Google Scholar]
- Ideraabdullah F.Y., de la Casa-Esperon E., Bell T.A., Detwiler D.A., Magnuson T., Sapienza C., de Villena F.P., de la Casa-Esperon E., Bell T.A., Detwiler D.A., Magnuson T., Sapienza C., de Villena F.P., Bell T.A., Detwiler D.A., Magnuson T., Sapienza C., de Villena F.P., Detwiler D.A., Magnuson T., Sapienza C., de Villena F.P., Magnuson T., Sapienza C., de Villena F.P., Sapienza C., de Villena F.P., de Villena F.P. Genetic and haplotype diversity among wild-derived mouse inbred strains. Genome Res. 2004;14:1880–1887. doi: 10.1101/gr.2519704. [DOI] [PMC free article] [PubMed] [Google Scholar]
- Ihle S., Ravaoarimanana I., Thomas M., Tautz D., Ravaoarimanana I., Thomas M., Tautz D., Thomas M., Tautz D., Tautz D. An analysis of signatures of selective sweeps in natural populations of the house mouse. Mol. Biol. Evol. 2006;23:790–797. doi: 10.1093/molbev/msj096. [DOI] [PubMed] [Google Scholar]
- Jensen-Seaman M.I., Furey T.S., Payseur B.A., Lu Y., Roskin K.M., Chen C.F., Thomas M.A., Haussler D., Jacob H.J., Furey T.S., Payseur B.A., Lu Y., Roskin K.M., Chen C.F., Thomas M.A., Haussler D., Jacob H.J., Payseur B.A., Lu Y., Roskin K.M., Chen C.F., Thomas M.A., Haussler D., Jacob H.J., Lu Y., Roskin K.M., Chen C.F., Thomas M.A., Haussler D., Jacob H.J., Roskin K.M., Chen C.F., Thomas M.A., Haussler D., Jacob H.J., Chen C.F., Thomas M.A., Haussler D., Jacob H.J., Thomas M.A., Haussler D., Jacob H.J., Haussler D., Jacob H.J., Jacob H.J. Comparative recombination rates in the rat, mouse, and human genomes. Genome Res. 2004;14:528–538. doi: 10.1101/gr.1970304. [DOI] [PMC free article] [PubMed] [Google Scholar]
- Kayser M., Brauer S., Stoneking M., Brauer S., Stoneking M., Stoneking M. A genome scan to detect candidate regions influenced by local natural selection in human populations. Mol. Biol. Evol. 2003;20:893–900. doi: 10.1093/molbev/msg092. [DOI] [PubMed] [Google Scholar]
- Liu Y.C. Ubiquitin ligases and the immune response. Annu. Rev. Immunol. 2004;22:81–127. doi: 10.1146/annurev.immunol.22.012703.104813. [DOI] [PubMed] [Google Scholar]
- McVean G.T., Hurst L.D., Hurst L.D. Evidence for a selectively favourable reduction in the mutation rate of the X chromosome. Nature. 1997;386:388–392. doi: 10.1038/386388a0. [DOI] [PubMed] [Google Scholar]
- Mi H., Lazareva-Ulitsky B., Loo R., Kejariwal A., Vandergriff J., Rabkin S., Guo N., Muruganujan A., Doremieux O., Campbell M.J., Lazareva-Ulitsky B., Loo R., Kejariwal A., Vandergriff J., Rabkin S., Guo N., Muruganujan A., Doremieux O., Campbell M.J., Loo R., Kejariwal A., Vandergriff J., Rabkin S., Guo N., Muruganujan A., Doremieux O., Campbell M.J., Kejariwal A., Vandergriff J., Rabkin S., Guo N., Muruganujan A., Doremieux O., Campbell M.J., Vandergriff J., Rabkin S., Guo N., Muruganujan A., Doremieux O., Campbell M.J., Rabkin S., Guo N., Muruganujan A., Doremieux O., Campbell M.J., Guo N., Muruganujan A., Doremieux O., Campbell M.J., Muruganujan A., Doremieux O., Campbell M.J., Doremieux O., Campbell M.J., Campbell M.J., et al. The PANTHER database of protein families, subfamilies, functions and pathways. Nucleic Acids Res. 2005;33:D284–D288. doi: 10.1093/nar/gki078. [DOI] [PMC free article] [PubMed] [Google Scholar]
- Nachman M.W., Searle J.B., Searle J.B. Why is the house mouse karyotype so variable? Trends Ecol. Evol. 1995;10:397–402. doi: 10.1016/s0169-5347(00)89155-7. [DOI] [PubMed] [Google Scholar]
- Nei M. Analysis of gene diversity in subdivided populations. Proc. Natl. Acad. Sci. 1973;70:3321–3323. doi: 10.1073/pnas.70.12.3321. [DOI] [PMC free article] [PubMed] [Google Scholar]
- Nei M.1987. . Molecular evolutionary genetics. Columbia University Press, New York. [Google Scholar]
- Nielsen R., Bustamante C., Clark A.G., Glanowski S., Sackton T.B., Hubisz M.J., Fledel-Alon A., Tanenbaum D.M., Civello D., White T.J., Bustamante C., Clark A.G., Glanowski S., Sackton T.B., Hubisz M.J., Fledel-Alon A., Tanenbaum D.M., Civello D., White T.J., Clark A.G., Glanowski S., Sackton T.B., Hubisz M.J., Fledel-Alon A., Tanenbaum D.M., Civello D., White T.J., Glanowski S., Sackton T.B., Hubisz M.J., Fledel-Alon A., Tanenbaum D.M., Civello D., White T.J., Sackton T.B., Hubisz M.J., Fledel-Alon A., Tanenbaum D.M., Civello D., White T.J., Hubisz M.J., Fledel-Alon A., Tanenbaum D.M., Civello D., White T.J., Fledel-Alon A., Tanenbaum D.M., Civello D., White T.J., Tanenbaum D.M., Civello D., White T.J., Civello D., White T.J., White T.J., et al. A scan for positively selected genes in the genomes of humans and chimpanzees. PLoS Biol. 2005;3:e170. doi: 10.1371/journal.pbio.0030170. [DOI] [PMC free article] [PubMed] [Google Scholar]
- Orr H.A., Masly J.P., Presgraves D.C., Masly J.P., Presgraves D.C., Presgraves D.C. Speciation genes. Curr. Opin. Genet. Dev. 2004;14:675–679. doi: 10.1016/j.gde.2004.08.009. [DOI] [PubMed] [Google Scholar]
- Page R.D. TREEVIEW: An application to display phylogenetic trees on personal computers. Comput. Appl. Biosci. 1996;12:357–358. doi: 10.1093/bioinformatics/12.4.357. [DOI] [PubMed] [Google Scholar]
- Payseur B.A., Hoekstra H.E., Hoekstra H.E. Signatures of reproductive isolation in patterns of single nucleotide diversity across inbred strains of mice. Genetics. 2005;171:1905–1916. doi: 10.1534/genetics.105.046193. [DOI] [PMC free article] [PubMed] [Google Scholar]
- Payseur B.A., Nachman M.W., Nachman M.W. The genomics of speciation: Investigating the molecular correlates of X chromosome introgression across the hybrid zone between Mus domesticus and Mus musculus. Biol. J. Linn. Soc. Lond. 2005;84:523–534. [Google Scholar]
- Payseur B.A., Cutter A.D., Nachman M.W., Cutter A.D., Nachman M.W., Nachman M.W. Searching for evidence of positive selection in the human genome using patterns of microsatellite variability. Mol. Biol. Evol. 2002;19:1143–1153. doi: 10.1093/oxfordjournals.molbev.a004172. [DOI] [PubMed] [Google Scholar]
- Payseur B.A., Krenz J.G., Nachman M.W., Krenz J.G., Nachman M.W., Nachman M.W. Differential patterns of introgression across the X chromosome in a hybrid zone between two species of house mice. Evolution Int. J. Org. Evolution. 2004;58:2064–2078. doi: 10.1111/j.0014-3820.2004.tb00490.x. [DOI] [PubMed] [Google Scholar]
- Presgraves D.C., Balagopalan L., Abmayr S.M., Orr H.A., Balagopalan L., Abmayr S.M., Orr H.A., Abmayr S.M., Orr H.A., Orr H.A. Adaptive evolution drives divergence of a hybrid inviability gene between two species of Drosophila. Nature. 2003;423:715–719. doi: 10.1038/nature01679. [DOI] [PubMed] [Google Scholar]
- Rozas J., Sanchez-DelBarrio J.C., Messeguer X., Rozas R., Sanchez-DelBarrio J.C., Messeguer X., Rozas R., Messeguer X., Rozas R., Rozas R. DnaSP, DNA polymorphism analyses by the coalescent and other methods. Bioinformatics. 2003;19:2496–2497. doi: 10.1093/bioinformatics/btg359. [DOI] [PubMed] [Google Scholar]
- Schlenke T.A., Begun D.J., Begun D.J. Natural selection drives Drosophila immune system evolution. Genetics. 2003;164:1471–1480. doi: 10.1093/genetics/164.4.1471. [DOI] [PMC free article] [PubMed] [Google Scholar]
- Schmidt H.A., Strimmer K., Vingron M., von Haeseler A., Strimmer K., Vingron M., von Haeseler A., Vingron M., von Haeseler A., von Haeseler A. TREE-PUZZLE: Maximum likelihood phylogenetic analysis using quartets and parallel computing. Bioinformatics. 2002;18:502–504. doi: 10.1093/bioinformatics/18.3.502. [DOI] [PubMed] [Google Scholar]
- Storchova R., Gregorova S., Buckiova D., Kyselova V., Divina P., Forejt J., Gregorova S., Buckiova D., Kyselova V., Divina P., Forejt J., Buckiova D., Kyselova V., Divina P., Forejt J., Kyselova V., Divina P., Forejt J., Divina P., Forejt J., Forejt J. Genetic analysis of X-linked hybrid sterility in the house mouse. Mamm. Genome. 2004;15:515–524. doi: 10.1007/s00335-004-2386-0. [DOI] [PubMed] [Google Scholar]
- Storz J.F. Using genome scans of DNA polymorphism to infer adaptive population divergence. Mol. Ecol. 2005;14:671–688. doi: 10.1111/j.1365-294X.2005.02437.x. [DOI] [PubMed] [Google Scholar]
- Storz J.F., Payseur B.A., Nachman M.W., Payseur B.A., Nachman M.W., Nachman M.W. Genome scans of DNA variability in humans reveal evidence for selective sweeps outside of Africa. Mol. Biol. Evol. 2004;21:1800–1811. doi: 10.1093/molbev/msh192. [DOI] [PubMed] [Google Scholar]
- Sun S., Ting C.T., Wu C.I., Ting C.T., Wu C.I., Wu C.I. The normal function of a speciation gene, Odysseus, and its hybrid sterility effect. Science. 2004;305:81–83. doi: 10.1126/science.1093904. [DOI] [PubMed] [Google Scholar]
- Talley H.M., Laukaitis C.M., Karn R.C., Laukaitis C.M., Karn R.C., Karn R.C. Female preference for male saliva: Implications for sexual isolation of Mus musculus subspecies. Evolution Int. J. Org. Evolution. 2001;55:631–634. doi: 10.1554/0014-3820(2001)055[0631:fpfmsi]2.0.co;2. [DOI] [PubMed] [Google Scholar]
- Tanaka T., Nei M., Nei M. Positive Darwinian selection observed at the variable-region genes of immunoglobulins. Mol. Biol. Evol. 1989;6:447–459. doi: 10.1093/oxfordjournals.molbev.a040569. [DOI] [PubMed] [Google Scholar]
- Ting C.T., Tsaur S.C., Sun S., Browne W.E., Chen Y.C., Patel N.H., Wu C.I., Tsaur S.C., Sun S., Browne W.E., Chen Y.C., Patel N.H., Wu C.I., Sun S., Browne W.E., Chen Y.C., Patel N.H., Wu C.I., Browne W.E., Chen Y.C., Patel N.H., Wu C.I., Chen Y.C., Patel N.H., Wu C.I., Patel N.H., Wu C.I., Wu C.I. Gene duplication and speciation in Drosophila: Evidence from the Odysseus locus. Proc. Natl. Acad. Sci. 2004;101:12232–12235. doi: 10.1073/pnas.0401975101. [DOI] [PMC free article] [PubMed] [Google Scholar]
- Trachtulec Z., Mihola O., Vlcek C., Himmelbauer H., Paces V., Forejt J., Mihola O., Vlcek C., Himmelbauer H., Paces V., Forejt J., Vlcek C., Himmelbauer H., Paces V., Forejt J., Himmelbauer H., Paces V., Forejt J., Paces V., Forejt J., Forejt J. Positional cloning of the Hybrid sterility 1 gene: Fine genetic mapping and evaluation of two candidate genes. Biol. J. Linn. Soc. Lond. 2005;84:637–641. [Google Scholar]
- Tucker P.K., Sage R.D., Warner J., Wilson A.C., Eicher E.M., Sage R.D., Warner J., Wilson A.C., Eicher E.M., Warner J., Wilson A.C., Eicher E.M., Wilson A.C., Eicher E.M., Eicher E.M. Abrupt cline for sex-chromosomes in a hybrid zone between 2 species of mice. Evolution Int. J. Org. Evolution. 1992;46:1146–1163. doi: 10.1111/j.1558-5646.1992.tb00625.x. [DOI] [PubMed] [Google Scholar]
- Turner T.L., Hahn M.W., Nuzhdin S.V., Hahn M.W., Nuzhdin S.V., Nuzhdin S.V. Genomic islands of speciation in Anopheles gambiae. PLoS Biol. 2005;3:e285. doi: 10.1371/journal.pbio.0030285. [DOI] [PMC free article] [PubMed] [Google Scholar]
- Wade C.M., Daly M.J., Daly M.J. Genetic variation in laboratory mice. Nat. Genet. 2005;37:1175–1180. doi: 10.1038/ng1666. [DOI] [PubMed] [Google Scholar]
- Wade C.M., Kulbokas E.J., III, Kirby A.W., Zody M.C., Mullikin J.C., Lander E.S., Lindblad-Toh K., Daly M.J., Kulbokas E.J., III, Kirby A.W., Zody M.C., Mullikin J.C., Lander E.S., Lindblad-Toh K., Daly M.J., Kirby A.W., Zody M.C., Mullikin J.C., Lander E.S., Lindblad-Toh K., Daly M.J., Zody M.C., Mullikin J.C., Lander E.S., Lindblad-Toh K., Daly M.J., Mullikin J.C., Lander E.S., Lindblad-Toh K., Daly M.J., Lander E.S., Lindblad-Toh K., Daly M.J., Lindblad-Toh K., Daly M.J., Daly M.J. The mosaic structure of variation in the laboratory mouse genome. Nature. 2002;420:574–578. doi: 10.1038/nature01252. [DOI] [PubMed] [Google Scholar]
- Zhang X., Rodriguez I., Mombaerts P., Firestein S., Rodriguez I., Mombaerts P., Firestein S., Mombaerts P., Firestein S., Firestein S. Odorant and vomeronasal receptor genes in two mouse genome assemblies. Genomics. 2004;83:802–811. doi: 10.1016/j.ygeno.2003.10.009. [DOI] [PubMed] [Google Scholar]