

Abstract
Expression microarrays hybridized with RNA can simultaneously provide both phenotypic (gene expression) and genotypic (marker) data. We developed two types of genetic markers from Affymetrix GeneChip expression data to generate detailed haplotypes for 148 recombinant inbred lines (RILs) derived from Arabidopsis thaliana accessions Bayreuth and Shahdara. Gene expression markers (GEMs) are based on differences in transcript levels that exhibit bimodal distributions in segregating progeny, while single feature polymorphism (SFP) markers rely on differences in hybridization to individual oligonucleotide probes. Unlike SFPs, GEMs can be derived from any type of DNA-based expression microarray. Our method identifies SFPs independent of a gene’s expression level. Alleles for each GEM and SFP marker were ascertained with GeneChip data from parental accessions as well as RILs; a novel algorithm for allele determination using RIL distributions capitalized on the high level of genetic replication per locus. GEMs and SFP markers provided robust markers in 187 and 968 genes, respectively, which allowed estimation of gene order consistent with that predicted from the Col-0 genomic sequence. Using microarrays on a population to simultaneously measure gene expression variation and obtain genotypic data for a linkage map will facilitate expression QTL analyses without the need for separate genotyping. We have demonstrated that gene expression measurements from microarrays can be leveraged to identify polymorphisms across the genome and can be efficiently developed into genetic markers that are verifiable in a large segregating RIL population. Both marker types also offer opportunities for massively parallel mapping in unsequenced and less studied species.
Comprehensive gene expression microarrays have enabled transcriptome profiling in a wide variety of organisms. When the expression levels of individual genes are considered as quantitative traits, their variation can be described as expression level polymorphisms (ELPs) and their determinants can be mapped with molecular markers as expression QTLs (eQTLs) (Jansen and Nap 2001; Doerge 2002; Schadt et al. 2003). Since the availability of genetic markers is a crucial limitation to estimating a genetic map for any population, developing methods for efficiently obtaining novel marker information enhances our ability to conduct comprehensive QTL and eQTL studies.
Several different types of molecular markers have been developed over the past three decades (Kumar 1999; Gupta and Rustgi 2004), motivated by requirements for increased throughput, decreased cost per data point, and greater map resolution. Recently, oligonucleotide-based gene expression microarrays have been used to identify DNA sequence polymorphisms using genomic DNA as the target (Hazen and Kay 2003). Winzeler et al. (1998) pioneered the hybridization of labeled genomic DNA to oligonucleotide microarrays to identify sequence polymorphisms in haploid yeast. Borevitz et al. (2003) showed that this approach can be applied to organisms with more complex genomes, such as Arabidopsis thaliana, to analyze sequence polymorphisms termed single feature polymorphisms (SFPs). To reduce target complexity, Cui et al. (2005) and Rostoks et al. (2005) hybridized barley expression microarrays with cRNA, allowing for detection of thousands of potential SFPs. Ronald et al. (2005) extended the concept of genotyping with expression microarrays by hybridizing with cRNA instead of genomic DNA, allowing for simultaneous genotyping and gene expression analyses in yeast. These microarray studies rely on the use of short oligonucleotide probes, which can have reduced binding to DNA or cRNA targets if a sequence polymorphism is present (Winzeler et al. 1998). Since SFP detection is not feasible using longer (50- to 70-mer) probes or spotted cDNA microarrays, which are less sensitive to small regions of sequence mismatch, it is limited to species for which short oligonucleotide microarrays are available.
Gene expression markers (GEMs) can be obtained from expression microarrays based on long oligonucleotide probes, spotted cDNAs, or short oligonucleotides, because they are based on gene expression differences, not on individual probe hybridization. GEMs, characterized by large differences in transcript levels between the parents of a segregating population, provide expression data that are distinctly bimodal in distribution when surveyed in a recombinant inbred line (RIL) population.
We demonstrate that data derived from gene expression microarrays can also be used at little or no extra expense to develop large numbers of robust molecular markers. We used two different approaches (GEMs and SFPs) and two methods to define markers and their alleles. The first method was based on parental polymorphisms detected with replicated microarray data. The second method capitalized on the high level of replication available for each locus in the RIL population to identify robust polymorphisms in the progeny microarray data. We validated these novel markers by using a large segregating A. thaliana RIL population. Sequencing studies have demonstrated the existence of hundreds of SNPs between accessions Bayreuth (Bay-0) and Shahdara (Sha), but these polymorphisms had not been developed into tractable genetic markers (Nordborg et al. 2005). To add markers to the existing genotypic data for the Bay-0 × Sha RIL population (Loudet et al. 2002), we used gene expression microarray data that had been generated as part of a larger experiment to measure transcriptional variation in these RILs to assess genotypes and produce detailed haplotypes. The SFP markers and GEMs we identified were used to construct a detailed genetic linkage map that was consistent with the gene order predicted by the genomic sequence of the Col-0 accession (The Arabidopsis Genome Initiative 2000) with minimal missing data.
Results
Gene expression markers
We conducted two factorial experiments (i.e., biological replication of different treatments and time points) using Bay-0 and Sha plants in order to assess differences in gene expression between these two genotypes (unpublished data). Labeled RNA from the control plants was hybridized to Affymetrix ATH1 GeneChip microarrays, resulting in 16 Bay-0 and 16 Sha parental GeneChips. To identify potential GEMs, we compared gene expression values averaged over the 16 GeneChips per accession and identified 1431 genes that exhibited an empirically chosen twofold or greater expression difference between the two genotypes. Subsequently, to identify genes with non-overlapping expression value distributions, a “gap” value was determined for each gene: The minimum expression value of the higher expressing allele was divided by the maximum expression value of the lower expressing allele. A gap of ≥1.0 indicates non-overlapping distributions; the larger the gap, the greater the distance between the distributions. Of the 1431 genes, 324 had a gap ≥1.0 and were used as our candidate GEMs.
Genotypes were assigned to 148 Bay-0 × Sha F9 RILs for each of the 324 candidate GEMs by comparing RIL gene expression values from replicated GeneChips with the parental expression level distributions. For each GEM, RILs with expression values that fell within the range of the 16 Bay-0 parental values were assigned a Bay-0 genotype; Sha parental values were likewise used to assign Sha genotypes to the RILs. RILs with gene expression levels that fell between the two parental distributions could not initially be assigned a genotype. To minimize the number of ambiguous “missing data” genotype scores, we incrementally adjusted the parental distributions used for allele assignments by utilizing a slicing procedure (see Methods). Because bimodal distributions can sometimes be caused by complex genetic inheritance, we filtered the GEMs to remove those markers that showed severe segregation distortion (allele segregation ratios > 1:3) or had >10% missing data scores, as these would suggest nonqualitative inheritance of the GEM polymorphism. A total of 188 markers (corresponding to 187 genes) remained after filtering.
These 188 GEMs, plus 38 previously genotyped microsatellite markers (Loudet et al. 2002), provided data for the estimation of a genetic map that spanned 393 cM, with a maximum gap size of 14.8 cM (Supplemental Fig. 1). While the average resolution afforded by the original 38 microsatellite markers was one marker every 10.8 cM, the GEMs increased resolution to one marker every 1.7 cM. The map order of almost all GEMs (182 of 188 markers) was consistent with the genomic sequence of Col-0 (Supplemental Fig. 1), implying that GEMs are robust genetic markers. This also indicated that there are no large chromosomal rearrangements between Col-0 and the Bay-0 and Sha accessions.
Six GEMs did not map to the expected chromosomal locations (Supplemental Fig. 1a). For example, At2g26630 and At2g38520 exhibit anomalous red segments off the diagonal; their expected physical location is in linkage group 2, but they are genetically linked to linkage group 5. Markers At1g29410 and At4g01350 are represented by probe sets that recognize alternate gene family members whose chromosomal locations are consistent with their genetic linkages (Supplemental Fig. 1). Markers At2g26630, At2g38520, and At5g34920 correspond to genes with transposon-related functions. Only marker At3g60980 showed a linkage that cannot be readily explained and may reflect a small translocation relative to Col-0 in either the Bay-0 or Sha accession. At3g60980 also contains a SFP which shows genetic linkage consistent with the GEM marker position for the same gene (see SFP section below).
Graphical genotypes (haplotypes) were generated for each of the 148 RILs by using the GEMs and microsatellite markers (Supplemental Fig. 2). The 188 GEMs define haplotypes that are consistent with, and more detailed than, the haplotypes generated by the 38 microsatellite markers alone (http://www.inra.fr/qtlat). Whereas 836 crossovers are apparent when the 38 microsatellite markers are used to genotype these 148 RILs, the haplotypes defined by the 188 GEMs identify 1264 recombination breakpoints.
SFP markers
To obtain additional markers and more detailed haplotypes, instead of using each gene’s expression level derived from the entire probe set on the ATH1 GeneChip, we identified SFPs by using the hybridization values for single oligonucleotide probes (Winzeler et al. 1998; Borevitz et al. 2003). We developed a “SFPdev” summary measure in order to focus on probe values independent of a gene’s expression level. We searched for probes that had a difference in the SFPdev value between Bay-0 and Sha in two ways. The first approach identified SFPs by using parental data from the factorial experiments; the second relied on replicated GeneChip data from the RILs.
SFP detection with parental data
By using the hybridization values for all ∼251,000 Perfect Match (PM) probes for each of the 32 parental GeneChips, we calculated SFPdev, which maximizes the difference between two genotypes to detect instances where one genotype has reduced hybridization to an individual probe within a probe set (see Methods). The use of the SFPdev summary measure allows SFPs to be detected in genes expressed at similar levels in two genotypes (Supplemental Fig. 3a) and in genes exhibiting ELPs (Supplemental Fig. 3b). The SFPs are therefore independent of a gene’s expression level. A SFP was declared if Bay-0 and Sha had non-overlapping ranges of SFPdev values separated by an empirically chosen gap >2.0 (see Methods, Supplemental Fig. 4). By using this stringent criterion, 2245 SFPs between Bay-0 and Sha were detected (Table 1).
Table 1.
Comparison of two SFP marker detection methods for numbers of markers obtained
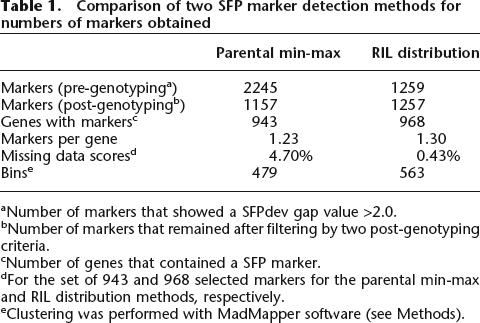
aNumber of markers that showed a SFPdev gap value >2.0.
bNumber of markers that remained after filtering by two post-genotyping criteria.
cNumber of genes that contained a SFP marker.
dFor the set of 943 and 968 selected markers for the parental min-max and RIL distribution methods, respectively.
eClustering was performed with MadMapper software (see Methods).
The SFPdev distributions were used to assign genotypes to the 148 RILs, using the same RIL GeneChips described previously and a “parental min-max” algorithm (see Methods). After genotyping the RILs, SFP markers were discarded if there was >10% missing data or if a deviation of allele frequency >1:4 was observed. After this filtering process, 1157 SFP markers remained, with an average frequency of 1.23 SFP markers per probe set (Table 1). One SFP marker per probe set with the least missing data was selected, resulting in 943 SFP markers with an average of 4.7% missing data. An analysis of the 148 RIL genotypes clustered these 943 SFP markers plus the 38 microsatellite markers into 479 bins, with an average of 2.05 SFP markers per bin (Table 1).
To investigate how the parental min-max algorithm impacted missing genotype scores, we randomly selected 10 SFP markers with ∼24% missing scores and compared the distribution of their SFPdev values from the 296 RIL GeneChips (two replications of 148 RILs) with the SFPdev values from the 32 parental GeneChips. The range of SFPdev values from Bay-0 and Sha did not always accurately encompass the range of SFPdev values in the RIL population, thus leading to unassigned genotypes (e.g., Fig. 1). We also observed distributions that were non-overlapping in the parental data but overlapped in the RILs, which likewise resulted in frequent missing genotype scores (data not shown), indicating that the range of SFPdev values derived from 16 parental GeneChips per genotype was suboptimal for assigning genotypes to the RILs.
Figure 1.

Comparison of SFPdev distributions between RIL and parental GeneChips. The distribution of SFPdev values (x-axis) in the RIL population (gray bars) are compared to distributions in the parental Bay-0 and Sha GeneChips from the factorial experiments (black and white bars, respectively) for SFP marker At1g74090-8 with 24.3% missing data (when scored with the parental min-max algorithm).
SFP detection with RIL data
To reduce the frequency of missing genotype data, we capitalized on the high level of replication available for each allele in the RIL population. Our “RIL distribution” algorithm (see Methods) searched for bimodal distributions of SFPdev values in the 296 RIL GeneChips and then assigned alleles based on these distributions in the progeny. For the SFP marker illustrated in Figure 1, the RIL distribution algorithm resulted in 0% missing scores, compared with the 24.3% missing scores obtained using the parental min-max algorithm. The RIL distribution algorithm identified 1259 SFPs between Bay-0 and Sha (Table 1). Because of limited segregation distortion and minimal missing scores, the post-genotyping filtering process eliminated only two of these 1259 SFP markers. The 1257 markers represented 968 probe sets (1.30 SFP markers per probe set) (Table 1). One SFP marker was selected per probe set, resulting in a data set with only 0.43% genotype scores missing. Cluster analysis grouped the 968 SFP markers plus the 38 microsatellite markers into 563 bins, with an average of 1.79 markers per bin. If a bin with multiple markers did not contain any markers with 0% missing data, two SFP markers were selected to represent that bin in order to avoid loss of information due to missing genotype scores, resulting in a set of 599 SFP markers.
A heat map was generated by using pair-wise recombination values for the 599 SFP markers plus the 38 microsatellite markers (Fig. 2, Supplemental Fig. 5a). The genetic map spanned 409 cM with an average resolution of one marker every 0.64 cM (187 kb) and a maximum gap size of 7.2 cM. Each linkage group was also analyzed separately with JoinMap (Supplemental Fig. 5); the average estimated intervals between markers for each linkage group are as follows: AT1, 0.62 cM; AT2, 0.73 cM; AT3, 0.56 cM; AT4, 0.67 cM; and AT5, 0.66 cM, providing a near-saturated genetic map for this size of population.
Figure 2.

Heat map showing a matrix of pair-wise recombination values for SFPs and microsatellite markers assayed on 148 RILs. Pair-wise comparisons between markers were used to assign recombination scores, which are plotted as a heat map matrix of all markers (top to bottom) against all markers (left to right). Lowest recombination scores, suggesting marker linkage, are indicated by red boxes, while blue boxes indicate high recombination scores, suggesting no linkage. The 599 SFP and 38 microsatellite markers are ordered by their physical location in the Col-0 genomic sequence; heavy lines demarcate the five linkage groups. (Supplemental Fig. 5a shows a high resolution version of this figure, including marker details.)
The linkage of 595 of the 599 SFP markers was consistent with the positions expected from the genomic sequence of Col-0. In agreement with the GEM results, there are no major rearrangements of the genes containing these SFP markers between Col-0 and Bay-0 and Sha. However, when the order of the SFP markers was determined with JoinMap, small local deviations from the Col-0 gene order were observed (Supplemental Fig. 5), which could be due to small inversions or translocations relative to Col-0, multipoint recombination estimates, or sampling error. The segregation data for four out of 599 SFP markers were inconsistent with the Col-0 sequence (indicated by red segments off the diagonal in Fig. 2, Supplemental Fig. 5a). The genes corresponding to these four markers (At1g10380, At3g60980, At5g49250, and At5g55530) do not belong to multi-gene families, are not associated with transposable elements, and have no known function. Their map locations in this population may be indicative of small translocations relative to the Col-0 sequence. At3g60980 is also represented by a GEM, which likewise shows linkage to the same inconsistent position evidenced by the SFP marker (see Supplemental Fig. 1).
Using of the 599 SFP and 38 microsatellite markers, graphical genotypes were generated for each of the 148 RILs and the parental controls (Fig. 3; for individual linkage groups, see Supplemental Fig. 6). These 637 markers identified a total of 1533 recombination breakpoints, in comparison with the 1264 breakpoints detected with the 188 GEMs plus 38 microsatellite markers. Only 33% of the genes identified as GEMs overlapped with the set of genes for which we identified SFP markers. This small degree of overlap was not surprising as calculations of gene expression levels average the hybridization intensities for all probes of a probe set and specifically eliminate the outlier probe values (http://www.affymetrix.com). Individual SFPs have only a small effect on quantifying gene expression levels (Kliebenstein et al. 2006), and >95% of Arabidopsis genes with a SFP contain fewer than three SFPs per probe set (Borevitz et al. 2003). Both the GEMs and SFP markers were randomly distributed throughout the genome with no evidence of clustering. Consequently, the SFPs provide independent markers from the genes exhibiting transcript level differences (ELPs).
Figure 3.

Haplotypes of 148 RILs plus parental genotypes. Each column represents a RIL (first 148 columns) or parental genotype (last four columns). Rows correspond to SFP and microsatellite markers, arranged (top to bottom) in physical order based on the Col-0 genomic sequence. The five Arabidopsis linkage groups are laid end-to-end and are separated by horizontal gray lines. Red boxes indicate Sha genotypes, blue boxes indicate Bay-0 genotypes, and gray boxes indicate markers scored as missing data. The final column depicts the physical distances between the markers. Below the haplotypes, the proportions of Sha (red bars) and Bay-0 (blue bars) alleles in each RIL are depicted. (A high resolution version of this figure, with marker names included, is available in Supplemental Fig. 6a).
GEM detection with RIL data
We tested the utility of the RIL distributions of gene expression levels to identify potential GEMs. When the same RIL distribution algorithm was applied to the scaled gene expression data for all genes from the 296 RIL GeneChips, only 42 or 70 GEMs were identified with a gap value of 2.0 or 1.5, respectively. Filtering markers after genotyping did not eliminate any markers; 93% of the markers were previously identified with the parental distribution method. Therefore, identifying GEMs based on the RIL rather than parental distributions resulted in fewer markers; however, there were few missing scores with GEMs identified from RIL distributions (0.5% missing scores for the 42 GEMs with gap >2.0 and 0.6% missing scores for the 70 GEMs with gap >1.5) (Supplemental Fig. 7).
Discussion
We demonstrated that hybridization of gene expression microarrays with RNA allows the simultaneous phenotyping and genotyping of a segregating RIL population without requiring an independent analysis of the genomic DNA for each line. This dual use of the data saves both time and expense and allows confirmation of the source for each analyzed RNA. The ATH1 GeneChip, containing multiple 25-mer probes per gene, allowed the determination of marker genotypes at the level of gene expression with GEMs, as well as at the level of hybridization to individual probes with SFP markers. These dominant markers facilitated efficient high-density haplotyping of homozygous inbred RILs and identification of the majority of recombination breakpoints in this sample of 148 lines. These new markers enabled the construction of a high-density genetic map of the Bay-0 × Sha RIL population.
Both types of dominant markers are applicable to species other than Arabidopsis, including those for which genomics resources may be limited. However, their accessibility depends on the microarray technology available. Since GEMs can be developed by using either short or long oligonucleotide microarrays, they provide an alternative for identifying microarray-based markers, which previously required short oligonucleotide probes (Winzeler et al. 1998; Borevitz et al. 2003; Cui et al. 2005; Ronald et al. 2005; Rostoks et al. 2005).
Gene Expression Markers
The first method used to identify GEMs utilized parental microarray expression values to identify differentially expressed genes with distinctly bimodal expression distributions. The fact that <1% of the genes represented on the microarray were found to be suitable candidates for GEMs may be explained by the following considerations: This percentage may be an accurate reflection of the amount of large-effect single locus expression polymorphisms in A. thaliana; a fraction of differentially expressed genes (potential GEMs) may not be expressed in 6-wk-old foliar tissue; and our selection and filtering strategies likely discarded differentially expressed genes whose expression levels were controlled by more than one genetic locus.
In contrast to SFPs, the use of RIL distributions for GEM marker identification was not an improvement over the parental min-max method (Table 1). This is likely due to transgressive segregation, epistasis, and genotype × environment interactions that influence gene expression patterns in segregating populations (Mackay 2001; Brem and Kruglyak, 2005). Another potential complication of GEMs is that bimodal distributions can be influenced by complex inheritance. However, our filtering process eliminated these GEMs by removing any gene showing segregation distortion that would result from multigenic inheritance. Because GEMs rely on transcriptional differences that can be influenced by various factors, GEMs should be integrated with a framework set of DNA-based markers, such as microsatellite markers (http://www.inra.fr/qtlat), which are not influenced by the conditions under which the experiment is conducted.
The genetic map order of the vast majority of GEMs was consistent with the expected physical order of the genes represented on the microarray (see Supplemental Fig. 1). Therefore, for this subset of genes showing distinct bimodal parental distributions, most of the eQTLs are cis to the gene being analyzed and thus represent an extreme class of ELPs (Supplemental Fig. 1). If this is a common phenomenon, a GEM-derived genetic map provides the opportunity to approximate the physical order of such genes in less intensively studied species.
A disadvantage of markers that rely on quantifying transcript levels is that gene expression can be influenced by the environment. A GEM that is robust under one set of experimental conditions (e.g., tissue, developmental stage) may not perform similarly under a different set of conditions. This is not a major issue for genotypically stable populations such as advanced generation RILs, where genotypes of the homozygous lines need to be determined only once, and the haplotypes and a linkage map can be subsequently used to explore additional traits of interest. For less genetically stable experimental population structures, if expression microarrays have already been used to obtain expression profile data, GEM-derived genotypes can be leveraged from the existing data. Any candidate markers can be tested for phenotypic instability so that the most stable markers can be selected.
SFP markers
Using two data sets and two different methods, we developed a new strategy to identify SFP markers that differs from previously published approaches and is independent of ELPs. Employing a conventional marker development approach, we initially identified a large number of SFP markers by comparing the SFPdev ratio between two parental genotypes (16 replicates each). Since the high cost of microarrays for a large number of parental replications may diminish the widespread utility of this approach, we analyzed the effect of the number of replicated parental microarrays (3, 6, 9, 12, and 16) on the number and quality of SFP markers identified. The number of potential SFP markers increased when fewer parental GeneChips were used, but these markers showed an increase in “missing” scores upon genotyping the RILs (data not shown). After filtering, the final number of SFP markers was similar, regardless of how many parental microarrays had been originally used to detect the SFPs. Essentially, fewer parental replications gave rise to a similar number of SFP markers, but with more missing genotype assignments.
Because the boundaries of the allele-specific SFPdev ratio distributions could not be fully delineated by using parental microarray data, we developed a second approach to identify SFP markers. This approach queried the progeny data for polymorphisms, taking advantage of the higher level of replication available per locus in a RIL population: Microarray data from two biological replicates for each of 148 RILs provided ∼148 replications of each allele at every locus, based on an expected 1:1 segregation ratio. The 599 SFP markers resulting from analyzing the RIL distributions provided high-density haplotypes with a very low percentage of missing marker data, thus giving a superior high resolution map (Fig. 3). While the three marker techniques (GEMs, SFP parental min-max, and SFP RIL distribution) provide comparable genetic haplotypes (see Supplemental Fig. 8), SFP markers offer more complete genome coverage than do GEMs, and SFPs developed by using the RIL distribution method offer greater marker precision because of fewer missing genotype scores.
Marker number and population size
We employed conservative marker identification algorithms and filtering steps to emphasize marker quality (i.e., low percentage of missing genotype scores) over quantity. Our SFP identification method may be too conservative in situations where thousands of markers are desirable, for example, when mapping as many genes as possible. Our method gave a sufficient number of markers and detailed haplotypes for this mapping population of 148 lines. Additional putative markers could have been identified by employing less stringent criteria. However, because of near saturation of the detection of recombination break-points, unless the population size is expanded to provide additional recombination events, increasing the number of markers is uninformative.
High-density dominant markers and residual heterozygosity
Since both GEMs and SFP markers are dominant markers, they cannot be used reliably to identify heterozygous loci. Our highly homozygous F9 RILs are expected to contain <1% residual heterozygosity (3.05% heterozygosity was present in the F6 generation) (Loudet et al. 2002). These rare heterozygous regions might be evident in individual RILs either as contiguous regions of missing data for markers that were robust in other RILs, or as regions with multiple markers showing high frequencies of apparent double crossovers. Since either parent can provide the dominant allele, the haplotype in a heterozygous region could alternate between the two parental allele genotypes, resulting in a haplotype with numerous apparent crossovers. In the 148 Bay-0 × Sha F9 RILs, there are only a few regions with anomalous levels of missing data and double crossovers. Examples of each type of anomalous region suggesting residual heterozygosity can be seen in linkage group 1 of lines 85 (near marker nga128) and 88 (between markers nga128 and F5I14) in Supplemental Figure 6b.
Future directions
We are using the high-density haplotypes and the genetic map to dissect the genetic determinants of ELPs via expression QTL mapping. The large number of markers available to us will allow selection of the most informative (i.e., evenly spaced and unique) markers. Since markers are no longer a limiting factor, researchers can now devote their resources to performing studies with adequate numbers of recombinant individuals, in order to increase the statistical power for the accurate detection of eQTLs (de Koning and Haley, 2005).
Methods
Plant material and experimental conditions
Seeds for A. thaliana accessions Bayreuth (Bay-0), Shahdara (Sha), and a Bay-0 × Sha F8 RIL population were obtained from TAIR (http://www.arabidopsis.org; this population was originally developed by Loudet et al. (2002) http://www.inra.fr/qtlat). The RIL F8 plants and parental accessions were grown in a single growth chamber to produce sufficient F9 seed for replicated experiments.
Preliminary replicated factorial experiments were conducted with Bay-0 and Sha plants grown on three separate dates in a growth chamber under short day conditions (8 h light at 100–120 μEi, 20°C day/ 20°C night) to maintain plants in the vegetative phase. As part of a larger experiment investigating differential gene expression, at 6 wk these plants were sprayed to run-off with 0.02% Silwet L77, a surfactant (Lehle Seeds; http://www.arabidopsis.com) as a control treatment. All rosette leaves of three plants per genotype-time point combination were bulk harvested 4, 28, or 52 h post-treatment and quick-frozen in liquid nitrogen. The same tissue and developmental stage was used for all of the experiments described here.
Subsequently, the Bay-0 × Sha RIL experiment was conducted. Five plants for each replicate of 148 RILs, plus parental controls, were grown in growth chambers under short day conditions (8 h light at 100–120 μEi, 20°C day/ 20°C night) for 6 wk. At 6 wk, the plants were sprayed to run-off with 0.02% Silwet L77 and harvested 28 h later. All rosette leaves of three plants per genotype were bulk harvested and quick-frozen in liquid nitrogen. Because of limitations in growth chamber space, the two biological replications of 148 RILs plus controls were grown sequentially, one complete replication at a time.
RNA isolation and microarray hybridization
RNA was extracted, labeled, and hybridized to Affymetrix ATH1 GeneChips representing 22,810 genes, as previously described (Kliebenstein et al. 2006). GeneChips were scanned on an Affymetrix GeneArray Scanner using GCOS software (Affymetrix). Two microarray data sets from independent experiments were generated: Bay-0 and Sha parental data from factorial (treatment × time × genotype) experiments, and a RIL data set consisting of two biological replicates of 148 RILs plus Bay-0 and Sha parental controls.
Microarray quality control
The scanned image of each GeneChip was visually inspected for artifacts and standard quality control parameters were checked in accordance with the manufacturer’s recommendations (GeneChip Expression Analysis Data Analysis Fundamentals; http://www.affymetrix.com). In addition, the RIL assignment for each GeneChip data set was confirmed by examining the expression levels of 192 genes with allele-specific expression levels and clustering the microarrays based on genotype (Python MadMapper RECBIT V248, http://cgpdb.ucdavis.edu/XLinkage/MadMapper) to ensure that biological replicates clustered together as true replicates. The haplotypes determined with the GEMs and SFP markers were consistent with those determined previously by microsatellite analysis of genomic DNA for each of these 148 RILs (http://www.inra.fr/qtlat), thus confirming that the data for each GeneChip was derived from the designated RIL.
Microarray data analysis for genotyping with GEMs
Selecting candidate GEMs from the factorial experiment GeneChips
To allow comparisons of gene expression values across GeneChips, global scaling was used to adjust the trimmed mean signal of each GeneChip probe array to a target signal value of 600 (GeneChip Operating Software User’s Guide, version 1.3, http://www.affymetrix.com/support/technical/index.affx). Scaled gene expression values were obtained for all 22,810 ATH1 probe sets for the 16 Bay-0 and 16 Sha GeneChips from the factorial experiments. For each gene, 16 expression values were averaged for each parental genotype, and the mean Bay-0 gene expression values were compared to the mean Sha expression values to identify differentially expressed genes. The average gene expression comparison identified 1431 genes with a twofold or higher differential expression ratio between the two genotypes. This twofold ratio was empirically chosen through an iterative process to balance the number of potential markers identified with the robustness of the final markers after genotyping and filtering.
In addition to examining differences in gene expression levels, we also considered the distributions of parental gene expression values. For each gene, the minimum and maximum gene expression values within the 16 GeneChips from a given parental genotype were used to define the end-points of the parental expression distribution for that gene (Bay-0min/Bay-0max and Shamin/Shamax) and to compare the expression value distributions from the two genotypes. We estimated the distance between the parental gene expression value distributions by calculating the “gap” for each differentially expressed gene, by dividing the minimum value from the higher expressing parent by the maximum value for the lower expressing parent. For example, in genes where the average Sha expression values were greater than the average Bay-0 expression values, gap = Shamin/Bay-0max. If the parental expression value distributions did not overlap, the gap calculation yielded a value >1. Inclusion of the gap criterion enforces selection of genes whose expression levels exhibit bimodal distributions in the parents, since our goal was to use these genes as markers. Of the 1431 differentially expressed genes, 324 had a gap value ≥1.0; these 324 were potential GEMs.
Defining allele scoring rules for genotyping the RILs
Scaled gene expression values were obtained for the 324 genes from two GeneChips for each of 148 RILs (representing two independent Silwet-treated biological replications of each RIL) and four Silwet-treated replications of each parent, grown concurrently with the RILs as controls. Genotypes for each of the 324 potential GEMs were scored as Bay-0 or Sha in the RILs using the RIL microarray data and the boundaries defined by the endpoints of the parental gene expression value distributions from the factorial experiment. Inclusion of Bay-0 and Sha controls grown concurrently with the RILs provided an internal control for the genotyping methodology.
If RIL gene expression values fell between the factorial experiment parental distributions, this created ambiguous genotypes in the RILs, resulting in missing scores. To minimize the number of missing genotype scores in the RILs that resulted from using only 16 replicates of each parental genotype, we developed a slicing approach, in which each parental distribution was sliced into 1000 segments (see Supplemental Fig. 9). If the Bay-0 and Sha gene expression value distributions showed a gap >1.1, one segment was added sequentially to the appropriate end of each parental distribution until the adjusted gap was equal to 1.1. For example, for genes where Sha is the higher expressing parent, slices were iteratively added to the lower end of the Sha distribution to decrease the Shamin value, resulting in an adjusted Shamin value, Shamin-adj. Slices were likewise added to the higher end of the Bay-0 distribution. If the Bay-0 and Sha parental distributions were close together, with a gap <1.1, slices were subtracted iteratively from each parental distribution until the gap was equal to 1.1. Again, this resulted in adjusted distribution endpoints. By dividing each parental distribution into 1000 segments, the slicing approach conservatively and incrementally refined the parental distribution boundaries to better fit the boundaries of the RIL data and minimize missing marker data (allele assignments) in the RILs. The slicing approach is in effect a model optimization algorithm that attempts to maximize the use of the full data set for allele assignments.
GEM allele scoring
The adjusted parental gene expression value boundaries were used to develop genotype scoring rules for each of the 324 potential GEMs. For genes where Bay-0 is the higher expressing parent, RILs were assigned a Bay-0 genotype if the gene expression value was greater than Bay-0min-adj and a Sha genotype if the gene expression value was less than Shamax-adj. RILs exhibiting a gene expression value between Shamax-adj and Bay-0min-adj were scored as missing for that GEM. In the case of GEMs where Sha is the higher expressing parent, the opposite genotype assignments were made. The biological replicates were scored independently, resulting in two genotype scores per RIL for each of the 324 potential GEMs.
A custom Python script was written to use the slicing approach to adjust the parental distributions and then to assign genotype scores based on RIL GeneChip expression data (http://elp.ucdavis.edu/data/analysis/elp_map/). A “master locus” file was generated with raw expression marker genotypes, in which Bay-0 (B) or Sha (A) genotypes were assigned only if both replicate RIL GeneChips gave identical genotypes for a GEM; otherwise the marker was scored as a missing genotype for that RIL.
The master locus file was processed by the Python MadMapper RECBIT program version V248 (http://cgpdb.ucdavis.edu/XLinkage/MadMapper/) to filter the data set. GEMs with >10% missing data were excluded, as were markers displaying pronounced distortion (1:3 or greater) from the expected 1:1 allele distribution in the RILs.
Microarray data analysis for SFP marker genotyping
For the detection of SFPs as genetic markers, we analyzed the hybridization data from each of the 11 Perfect Match (PM) oligonucleotide probes per gene from each ATH1 GeneChip. The raw .CEL files generated by GCOS software (http://www.affymetrix.com) were subjected to a background correction by using the Robust Multichip Average (RMA) method (Irizarry et al. 2003) of the affy package (Gautier et al. 2004) with Bioconductor software (Gentleman et al. 2004; http://www.bioconductor.org/). To identify SFPs, we developed a summary measure to describe each probe in relation to the other 10 probes within the probe set. This summary measure, termed SFPdev, is calculated by using the formula: SFPdev = |hybridization signal probe #1 − average hybridization signal other 10 probes|/hybridization signal probe #1. The numerator measures the difference between an individual probe and the average across the other probes for that probe set; SFPs will have a larger difference from the probe average. This summary measure minimizes variation due to differential gene expression that impacts the probe set as a whole. The use of the probe of interest as the divisor enhances the spread of values such that extremes will be biased toward true SFPs. A Perl script was used to calculate the SFPdev ratio for all PM probes in each probe set for every probe set on the GeneChip.
Two different methods and algorithms were developed to use SFPdev values to detect and use SFPs as genetic markers. The first algorithm identified SFPs by using the 32 parental GeneChips from the factorial experiments and then assigned marker genotypes to the 148 RILs based on the parental SFPdev distributions. The second algorithm identified SFPs by using the RIL GeneChips and used the RIL SFPdev distributions, in conjunction with the parental SFPdev distributions, to assign marker genotypes.
Acknowledgments
We thank Rebecca Walker and Tanya Tang for technical assistance and Steve Edberg for assistance with data management and dissemination. This research was supported by the National Science Foundation 2010 Project, grant MCB-0115109 to D.A.S., R.W.M., and R.W.D.
Footnotes
[Supplemental material is available online at www.genome.org. The microarray data from this study have been submitted to ArrayExpress under accession nos. E-TABM-60, E-TABM-61, and E-TABM-62. Algorithms and scripts are available at http://elp.ucdavis.edu/data/analysis/elp_map/ and at http://elp.ucdavis.edu/data/analysis/sfp_map/SFPscan.html.]
Article published online before print. Article and publication date are at http://www.genome.org/cgi/doi/10.1101/gr.5011206
References
- Altschul S.F., Madden T.L., Schaffer A.A., Zhang J., Zhang Z., Miller W., Lipman D.J., Madden T.L., Schaffer A.A., Zhang J., Zhang Z., Miller W., Lipman D.J., Schaffer A.A., Zhang J., Zhang Z., Miller W., Lipman D.J., Zhang J., Zhang Z., Miller W., Lipman D.J., Zhang Z., Miller W., Lipman D.J., Miller W., Lipman D.J., Lipman D.J. Gapped BLAST and PSI-BLAST: A new generation of protein database search programs. Nucleic Acids Res. 1997;25:3389–3402. doi: 10.1093/nar/25.17.3389. [DOI] [PMC free article] [PubMed] [Google Scholar]
- The Arabidopsis Genome Initiative Analysis of the genome sequence of the flowering plant Arabidopsis thaliana. Nature. 2000;408:796–815. doi: 10.1038/35048692. [DOI] [PubMed] [Google Scholar]
- Borevitz J.O., Liang D., Plouffe D., Chang H.-S., Zhu T., Weigel D., Berry C.C., Winzeler E., Chory J., Liang D., Plouffe D., Chang H.-S., Zhu T., Weigel D., Berry C.C., Winzeler E., Chory J., Plouffe D., Chang H.-S., Zhu T., Weigel D., Berry C.C., Winzeler E., Chory J., Chang H.-S., Zhu T., Weigel D., Berry C.C., Winzeler E., Chory J., Zhu T., Weigel D., Berry C.C., Winzeler E., Chory J., Weigel D., Berry C.C., Winzeler E., Chory J., Berry C.C., Winzeler E., Chory J., Winzeler E., Chory J., Chory J. Large-scale identification of single-feature polymorphisms in complex genomes. Genome Res. 2003;13:513–523. doi: 10.1101/gr.541303. [DOI] [PMC free article] [PubMed] [Google Scholar]
- Brem R.B., Kruglyak L., Kruglyak L. The landscape of genetic complexity across 5700 gene expression traits in yeast. Proc. Natl. Acad. Sci. 2005;102:1572–1577. doi: 10.1073/pnas.0408709102. [DOI] [PMC free article] [PubMed] [Google Scholar]
- Cui X., Xu J., Asghar R., Condamine P., Svensson J.T., Wanamaker S., Stein N., Roose M., Close T.J., Xu J., Asghar R., Condamine P., Svensson J.T., Wanamaker S., Stein N., Roose M., Close T.J., Asghar R., Condamine P., Svensson J.T., Wanamaker S., Stein N., Roose M., Close T.J., Condamine P., Svensson J.T., Wanamaker S., Stein N., Roose M., Close T.J., Svensson J.T., Wanamaker S., Stein N., Roose M., Close T.J., Wanamaker S., Stein N., Roose M., Close T.J., Stein N., Roose M., Close T.J., Roose M., Close T.J., Close T.J. Detecting single-feature polymorphisms using oligonucleotide arrays and robustified projection pursuit. Bioinformatics. 2005;21:3852–3859. doi: 10.1093/bioinformatics/bti640. [DOI] [PubMed] [Google Scholar]
- de Koning D.-J., Haley C.S., Haley C.S. Genetical genomics in humans and model organisms. Trends Genet. 2005;21:377–381. doi: 10.1016/j.tig.2005.05.004. [DOI] [PubMed] [Google Scholar]
- Doerge R.W. Mapping and analysis of quantitative trait loci in experimental populations. Nat. Rev. Genet. 2002;3:43–52. doi: 10.1038/nrg703. [DOI] [PubMed] [Google Scholar]
- Gautier L., Cope L., Bolstad B.M., Irizarry R.A., Cope L., Bolstad B.M., Irizarry R.A., Bolstad B.M., Irizarry R.A., Irizarry R.A. Affy: Analysis of Affymetrix GeneChip data at the probe level. Bioinformatics. 2004;20:307–315. doi: 10.1093/bioinformatics/btg405. [DOI] [PubMed] [Google Scholar]
- Gentleman R.C., Carey V.J., Bates D.M., Bolstad B., Dettling M., Dudoit S., Ellis B., Gautier L., Ge Y., Gentry J., Carey V.J., Bates D.M., Bolstad B., Dettling M., Dudoit S., Ellis B., Gautier L., Ge Y., Gentry J., Bates D.M., Bolstad B., Dettling M., Dudoit S., Ellis B., Gautier L., Ge Y., Gentry J., Bolstad B., Dettling M., Dudoit S., Ellis B., Gautier L., Ge Y., Gentry J., Dettling M., Dudoit S., Ellis B., Gautier L., Ge Y., Gentry J., Dudoit S., Ellis B., Gautier L., Ge Y., Gentry J., Ellis B., Gautier L., Ge Y., Gentry J., Gautier L., Ge Y., Gentry J., Ge Y., Gentry J., Gentry J., et al. Bioconductor: Open software development for computational biology and bioinformatics. Genome Biol. 2004;5:R80. doi: 10.1186/gb-2004-5-10-r80. [DOI] [PMC free article] [PubMed] [Google Scholar]
- Gupta P.K., Rustgi S., Rustgi S. Molecular markers from the transcribed/expressed region of the genome in higher plants. Funct. Integr. Genomics. 2004;4:139–162. doi: 10.1007/s10142-004-0107-0. [DOI] [PubMed] [Google Scholar]
- Hazen S.P., Kay S.A., Kay S.A. Gene arrays are not just for measuring gene expression. Trends Plant Sci. 2003;8:413–416. doi: 10.1016/S1360-1385(03)00186-9. [DOI] [PubMed] [Google Scholar]
- Irizarry R.A., Bolstad B.M., Collin F., Cope L.M., Hobbs B., Speed T.P., Bolstad B.M., Collin F., Cope L.M., Hobbs B., Speed T.P., Collin F., Cope L.M., Hobbs B., Speed T.P., Cope L.M., Hobbs B., Speed T.P., Hobbs B., Speed T.P., Speed T.P. Summaries of Affymetrix GeneChip probe level data. Nucleic Acids Res. 2003;31:e15. doi: 10.1093/nar/gng015. [DOI] [PMC free article] [PubMed] [Google Scholar]
- Jansen R.C., Nap J.-P., Nap J.-P. Genetical genomics: The added value from segregation. Trends Genet. 2001;17:388–391. doi: 10.1016/s0168-9525(01)02310-1. [DOI] [PubMed] [Google Scholar]
- Kliebenstein D.J., West M.A.L., van Leeuwen H., Kim K., Doerge R.W., Michelmore R.W., St Clair D.A., West M.A.L., van Leeuwen H., Kim K., Doerge R.W., Michelmore R.W., St Clair D.A., van Leeuwen H., Kim K., Doerge R.W., Michelmore R.W., St Clair D.A., Kim K., Doerge R.W., Michelmore R.W., St Clair D.A., Doerge R.W., Michelmore R.W., St Clair D.A., Michelmore R.W., St Clair D.A., St Clair D.A. Genomic survey of gene expression diversity in Arabidopsis thaliana. Genetics. 2006;172:1179–1189. doi: 10.1534/genetics.105.049353. [DOI] [PMC free article] [PubMed] [Google Scholar]
- Kumar L.S. DNA markers in plant improvement: An overview. Biotechnol. Adv. 1999;17:143–182. doi: 10.1016/s0734-9750(98)00018-4. [DOI] [PubMed] [Google Scholar]
- Loudet O., Chaillou S., Camilleri C., Bouchez D., Daniel-Vedele F., Chaillou S., Camilleri C., Bouchez D., Daniel-Vedele F., Camilleri C., Bouchez D., Daniel-Vedele F., Bouchez D., Daniel-Vedele F., Daniel-Vedele F. Bay-0 × Shahdara recombinant inbred line population: A powerful tool for the genetic dissection of complex traits in Arabidopsis. Theor. Appl. Genet. 2002;104:1173–1184. doi: 10.1007/s00122-001-0825-9. [DOI] [PubMed] [Google Scholar]
- Mackay T.F.C. The genetic architecture of quantitative traits. Annu. Rev. Genet. 2001;35:303–339. doi: 10.1146/annurev.genet.35.102401.090633. [DOI] [PubMed] [Google Scholar]
- Nordborg M., Hu T.T., Ishino Y., Jhaveri J., Toomajian C., Zheng H., Bakker E., Calabrese P., Gladstone J., Goyal R., Hu T.T., Ishino Y., Jhaveri J., Toomajian C., Zheng H., Bakker E., Calabrese P., Gladstone J., Goyal R., Ishino Y., Jhaveri J., Toomajian C., Zheng H., Bakker E., Calabrese P., Gladstone J., Goyal R., Jhaveri J., Toomajian C., Zheng H., Bakker E., Calabrese P., Gladstone J., Goyal R., Toomajian C., Zheng H., Bakker E., Calabrese P., Gladstone J., Goyal R., Zheng H., Bakker E., Calabrese P., Gladstone J., Goyal R., Bakker E., Calabrese P., Gladstone J., Goyal R., Calabrese P., Gladstone J., Goyal R., Gladstone J., Goyal R., Goyal R., et al. The pattern of polymorphism in Arabidopsis thaliana. PLoS Biol. 2005;3:e196. doi: 10.1371/journal.pbio.0030196. [DOI] [PMC free article] [PubMed] [Google Scholar]
- Ronald J., Akey J.M., Whittle J., Smith E.N., Yvert G., Kruglyak L., Akey J.M., Whittle J., Smith E.N., Yvert G., Kruglyak L., Whittle J., Smith E.N., Yvert G., Kruglyak L., Smith E.N., Yvert G., Kruglyak L., Yvert G., Kruglyak L., Kruglyak L. Simultaneous genotyping, gene-expression measurement, and detection of allele-specific expression with oligonucleotide arrays. Genome Res. 2005;15:284–291. doi: 10.1101/gr.2850605. [DOI] [PMC free article] [PubMed] [Google Scholar]
- Rostoks N., Borevitz J.O., Hedley P.E., Russell J., Mudie S., Morris J., Cardle L., Marshall D.F., Waugh R., Borevitz J.O., Hedley P.E., Russell J., Mudie S., Morris J., Cardle L., Marshall D.F., Waugh R., Hedley P.E., Russell J., Mudie S., Morris J., Cardle L., Marshall D.F., Waugh R., Russell J., Mudie S., Morris J., Cardle L., Marshall D.F., Waugh R., Mudie S., Morris J., Cardle L., Marshall D.F., Waugh R., Morris J., Cardle L., Marshall D.F., Waugh R., Cardle L., Marshall D.F., Waugh R., Marshall D.F., Waugh R., Waugh R. Single-feature polymorphism discovery in the barley transcriptome. Genome Biol. 2005;6:R54. doi: 10.1186/gb-2005-6-6-r54. [DOI] [PMC free article] [PubMed] [Google Scholar]
- Schadt E.E., Monks S.A., Drake T.A., Lusis A.J., Che N., Colinayo V., Ruff T.G., Milligan S.B., Lamb J.R., Cavet G., Monks S.A., Drake T.A., Lusis A.J., Che N., Colinayo V., Ruff T.G., Milligan S.B., Lamb J.R., Cavet G., Drake T.A., Lusis A.J., Che N., Colinayo V., Ruff T.G., Milligan S.B., Lamb J.R., Cavet G., Lusis A.J., Che N., Colinayo V., Ruff T.G., Milligan S.B., Lamb J.R., Cavet G., Che N., Colinayo V., Ruff T.G., Milligan S.B., Lamb J.R., Cavet G., Colinayo V., Ruff T.G., Milligan S.B., Lamb J.R., Cavet G., Ruff T.G., Milligan S.B., Lamb J.R., Cavet G., Milligan S.B., Lamb J.R., Cavet G., Lamb J.R., Cavet G., Cavet G., et al. Genetics of gene expression surveyed in maize, mouse and man. Nature. 2003;422:297–302. doi: 10.1038/nature01434. [DOI] [PubMed] [Google Scholar]
- Winzeler E.A., Richards D.R., Conway A.R., Goldstein A.L., Kalman S., McCullough M.J., McCusker J.H., Stevens D.A., Wodicka L., Lockhart D.J., Richards D.R., Conway A.R., Goldstein A.L., Kalman S., McCullough M.J., McCusker J.H., Stevens D.A., Wodicka L., Lockhart D.J., Conway A.R., Goldstein A.L., Kalman S., McCullough M.J., McCusker J.H., Stevens D.A., Wodicka L., Lockhart D.J., Goldstein A.L., Kalman S., McCullough M.J., McCusker J.H., Stevens D.A., Wodicka L., Lockhart D.J., Kalman S., McCullough M.J., McCusker J.H., Stevens D.A., Wodicka L., Lockhart D.J., McCullough M.J., McCusker J.H., Stevens D.A., Wodicka L., Lockhart D.J., McCusker J.H., Stevens D.A., Wodicka L., Lockhart D.J., Stevens D.A., Wodicka L., Lockhart D.J., Wodicka L., Lockhart D.J., Lockhart D.J., et al. Direct allelic variation scanning of the yeast genome. Science. 1998;281:1194–1197. doi: 10.1126/science.281.5380.1194. [DOI] [PubMed] [Google Scholar]