

Abstract
Rett syndrome (RTT) is a neurodevelopmental disorder caused by mutations in the X-linked gene methyl-CpG-binding protein 2 (MECP2) that encodes a DNA binding protein involved in gene silencing. Selective deletion of Mecp2 in post-mitotic neurons in mice results in a Rettlike phenotype characterized by disturbances in motor activity and body weight, suggesting that these symptoms are exclusively caused by neuronal deficiency. Included in the RTT phenotype are episodes of respiratory depression that follow hyperventilation. Here we show that the respiratory phenotype depends on the organ distribution of Mecp2 deficiency. Both female mice heterozygous for a null mutation in Mecp2 (Mecp2+/−) and those with selective deletion of the protein in neurons (Mecp2+/nestin-Cre lox), showed an initial response to hypoxia that exceeded that in wild type (WT). However, marked respiratory depression following hypoxic hyperventilation was only seen in Mecp2+/− animals. Addition of carbon dioxide to the hypoxic exposure eliminated the respiratory depression. Tidal volume and lung volume were larger in Mecp2+/− and respiratory depression was directly related to tidal volume. Taken together these results indicate that the depression is due to hypocapnia. Respiratory depression in this mouse model of Rett Syndrome is seen in with ubiquitous deficiency in Mecp2 but not when it is confined to neurons.
Abbreviations: Mecp2, methyl-CpG-binding protein 2; RTT, Rett syndrome; VE, minute ventilation; VT, tidal volume
The gene that encodes the DNA binding protein, Mecp2, is mutated in the majority of individuals with Rett syndrome (1). The CreloxP system has been used to generate mouse models of RTT (2,3). In both studies the Cre transgene under the control of the nestin gene promoter was used to demonstrate that the phenotype could be achieved by selective deletion of Mecp2 in neurons. Chen et al. (2) extended these results by generating mice with deletion in the forebrain, hippocampus and brainstem that started at the perinatal stage. These mice developed a similar phenotype although delayed in onset. Both studies found that the mice had respiratory disturbances but these were not fully characterized. The hypothesis that Rett symptoms are exclusively caused by a neuronal Mecp2 deficiency has been further supported by the demonstration that Mecp2 under control of a neuron-specific promoter rescues the phenotype in Mecp2 null mice (4).
Respiratory disturbances characterized by depression including apnea following hyperventilation are a common feature of RTT (5–10). Almost 200 different mutations have been found in Rett syndrome (11–14). Inactivation of the X-chromosome does not favor either the wild type or mutated allele so that approximately half of neurons express the gene in affected individuals (15,16). In general, no specific mutation has been found to correlate with the respiratory disturbances (15), however one study found that patients with truncating mutations had a higher incidence of respiratory dysfunction than those with missense mutations (16). Measurements of carbon dioxide levels in RTT patients during episodes of hyperventilation show significant hypocapnia before apnea (6,8). Mecp2 is heavily expressed in human (17) and mouse lung (18). We hypothesized that differences in lung volume and respiratory pattern contribute to respiratory depression and apnea in RTT. To separate neuronal from pulmonary contributions to respiratory depression, we used mice with ubiquitous deficiency in Mecp2 and those with deficiency confined to neuronal tissue to study the ventilatory response to hypoxia. The results are consistent with tidal volume and lung volume differences that favor CO2 elimination during hyperventilation in Mecp2+/− females, and thus contribute to their respiratory disturbances.
MATERIALS AND METHODS
Animals
The protocols used were approved by the Oregon Health and Science University Institutional Animal Care and Use Committee and were in agreement with the National Institutes of Health “Guide for the Care and Use of Laboratory Animals.” B6.129P2(C)-Mecp2τm1.1Bird (stock number: 003890) heterozygous females and wild type females from the colony were obtained from the Jackson Laboratory, Bar Harbor, ME, at two months of age and were used for the initial experiments. Additional Mecp2+/− females and wild type littermates were obtained by crossing Mecp2+/− females with C57BL/6J males. Animals were genotyped by polymerase chain reaction (PCR) according to the protocol of the supplier (http://aretha.jax.org/pub-cgi/protocols/protocols.sh?obitype=protocol&protocol_id=468). This strain was originally generated by insertion of loxP sites around exons 3 and 4, and crossing homozygous floxed females to male CMVCre mice (3). Mice with Mecp2 deficiency confined primarily to neurons were generated by crossing females homozygous for floxed Mecp2 (a kind gift from Adrian Bird, Edinburgh) with males heterozygous for the nestin-Cre transgene (BG.cg-Tg(Nescre)1kln/J; stock number: 00377, Jackson Laboratory). These mice were genotyped by PCR for Cre. Experiments were carried out in adult mice between 2.3 and 12 mo of age.
Behavioral studies
At monthly intervals mice were examined for motor activity and the presence of hind limb clasping. Individual animals were placed in a 12.5 cm diameter glass beaker and observed for 5 min. Immobility was defined as all 4 limbs on the ground without movement. Hind limb clasping was tested by holding the tail up to elevate the back feet.
Measurement of respiratory variables
Respiratory frequency, tidal volume and their product, minute ventilation, were determined in a body plethysmograph. Individual unanesthetized animals were placed in a 65 mL chamber with their head exposed through a close fitting hole in Parafilm®. A pneumotachograph (19) was connected to the chamber and a differential pressure transducer (Model PT5A, Grass Instrument Co., West Warick, RI). The pressure signal was integrated to give tidal volume. Volume changes were calibrated by injecting known amounts of air into the chamber. The analog signal from the transducer was amplified, converted to digital, displayed on a monitor, and stored to disc by computer for later analysis. Three protocols were used in which a loose fitting cone over the animals head allowed switching the inspired gas mixture without disturbing the mouse. Hypoxia consisted of a 5 min control period breathing air followed by a 5 min of 8% oxygen (O2)/92% nitrogen and 5 min of 100% oxygen. Isocapnic hypoxia was similar except that 8% oxygen/4% carbon dioxide/88% nitrogen was used in place of 8% oxygen/92% nitrogen. Carbon dioxide (CO2) sensitivity and the contribution of peripheral chemoreceptors was determined by following a 5 min baseline period in air with, in succession: 5 min 100% O2; 3 min 3% CO2/97% O2; 3 min 5% CO2/95% O2 and 3 min 7% CO2/93% O2. Peripheral chemosensitive drive was estimated by the fall in minute ventilation in the first 5 s after switching from air to 100% oxygen. CO2 sensitivity was determined from the slope of the relationship between minute ventilation and inhaled carbon dioxide level. Only one of the three protocols was performed per day.
Static lung volumes
Animals were deeply anesthetized with an intraperitoneal injection of 0.01 mL/g body weight of a mixture of 30 mg/mL ketamine and 2.9 mg/mL xylezine and tracheostomized. Pressure volume curves were obtained by displaying air in a coiled tube from a water filled reservoir which could be raised or lowered. The tubing was at the animals midthoracic level and the reservoir was calibrated to allow determination of volumes displaced at each pressure from 5 cms below to 30 cms water above midthoracic level.
Volume of the bronchial tree
At the completion of the lung volume measurements, the deflated lungs were filled with Batson’s #17 monomer base solution (Polysciences Inc., Warrington, PA). The lungs were removed from the animals after 1.5 h and placed in a 25% potassium hydroxide solution for 10–14 d, to digest the pulmonary tissue. Saccular structures were trimmed away under a dissecting microscope and the volume of the bronchial tree determined by weighing the plastic cast.
Data analysis
All results are given as mean ± SD. Single comparisons between the four mice strains were made by ANOVA with Newman-Keuls method for post hoc analysis. Multiple comparisons between groups were made using two-way repeated measures ANOVA with strain and either time of exposure to hypoxia or lung pressure as the two factors. All four strains were included in these ANOVAs. Significance was accepted at the 5% level.
RESULTS
Animal characteristics
Mecp2+/− females (n =14) were initially indistinguishable from wild type (WT) animals (n =14). At two months of age their weights (Mecp2+/− = 18.3 ± 1.3 g, WT = 18.4 + 1.8g) were similar as they were at 1 y (Mecp2+/− = 26.4 ± 3.7 g; WT = 26.9 ± 8g). All 14 WT animals were killed between 12.6 and 14.6 mo to obtain lung volumes. Two of 14 Mecp2+/− mice died of unexplained causes at 9.2 and 10.2 mo. The remainder were killed at 12.6 –14.6 mo. With advancing postnatal age Mecp2+/− mice developed characteristic motor abnormalities (2,3) consisting of decreased activity and clasping of their hind limbs when elevated by the tail. At 2.6 mo of age time spent immobile by Mecp2+/− females (1.4 ± 1.0 min/5min) was not different from WT (1.3 ± 0.9 min). By 4 mo, however, Mecp2+/− animals were less active (2.8 ± 0.6 min/5min immobile) than WT (1.6 ± 0.6 min; p = < 0.001), and this persisted. At 2.6 mo of age no animals showed hind limb clasping. This behavior, which is characteristic of Mecp2 deficient mice (2,3) was observed in 10% of Mecp2+/− animals at 3.7 mo and increased to 90% by 12.5 mo.
At one month of age, female mice with a single floxed Mecp2 allele (n = 7) (designated Mecp2+/lox) were heavier than their littermates (n = 8) who had received the nestin-Cre transgene (designated Mecp2+/nestin-Cre lox) (17.1 ± 1.4 versus 14.6 ± 0.6 g; p = 0.048). This difference was not seen at 4.6 mo of age: Mecp2+/lox = 24.6 + 2.2; Mecp2+/nestin-Cre lox = 21.6 ± 2.3 g (p = 0.135). These animals were killed between 4.6 and 5.7 mo, none having previously died.
Hypoxic ventilatory response
Baseline minute ventilation(VE), normalized to body weight, was the same in the four animal strains (Table 1). Their respiratory patterns, however, were different. Mecp2+/− animals breathed slower and had higher tidal volumes (VT ), while Mecp2+/nestin-Cre lox had higher frequencies and lower VT than their respective wild types (Table 1).
Table 1.
Baseline ventilation prior to hypoxia study
| Strain | Number | Minute ventilation (ml/min/gm) | Frequency (bpm) | Tidal volume (μ l) |
|---|---|---|---|---|
| Wild type | 11 | 1.18 ± 0.15 | 226 ± 17 | 110 ± 12 |
| Mecp2+/− | 11 | 1.09 ± 0.16 | 182 ± 17* | 128 ± 19‡ |
| Mecp2+/lox | 7 | 1.07 ± 0.18 | 253 ± 18 | 105 ± 20 |
| Mecp2+/nestin-Cre | 8 | 1.01 ± 0.29 | 275 ± 23† | 69 ± 28§ |
Values are mean ± SD.
bpm, breaths per minute.
Significantly less than other 3 strains (p = < 0.001);
significantly greater than other strains (p =0.001–0.044);
significantly greater than other three strains (p = 0.001–0.045);
significantly less than other three strains (p = 0.001–0.002).
Mecp2+/− and WT animals were 5.2 to 5.4 mo old at the time of the hypoxic studies. The heterozygous females were immobile for 2.37 ± 1.0 min /5 min compared with 1.51 ± min for WT (p = 0.023). 18% of the Mecp2+/− mice had hind limb clasping. Mecp2+/nestin-Cre lox and Mecp2+/lox animals were 4.6 to 5.4 mo old; the former tended to spend more time immobile (2.95 ± 0.35 min) than the latter (1.62 ± 0.79 min) (p = 0.068). None of the Mecp2+/nestin-Cre lox mice had clasping.
The ventilalatory response to hypoxia in all strains was characterized by a rapid rise in minute ventilation (VE) that reached its maximum in the 1st min of exposure. This initial relative increase in VE was larger in Mecp2+/− (148 ± 12% of control) and Mecp2+/nestin-Cre lox (151 ± 19%) mice than WT (125 ± 10) and Mecp2±/lox (132 ±11%) (Mecp2+/− versus. WT p <0.001, Mecp2+/− versus Mecp2+/lox p = 0.005, Mecp2+/− versus Mecp2+/nestin-Cre lox p = 0.573; Mecp2+/nestin-Cre lox versus WT p =<0.001, Mecp2+/nestin-Cre lox versus Mecp2+/lox p = 0.005). Minute ventilation in the first minute of hypoxia was similar in WT and Mecp2+/lox (p =0.157). (Fig. 1A). In the 5th min of hypoxia VE fell to control levels in all strains. In the first 30 s of recovery from hypoxia relative VE fell to a lower level in Mecp2+/− animals (52 ± 9%) than in the other three strains (~70%) (Mecp2+/− versus WT p =< 0.001, Mecp2+/− versus Mecp2+/lox p = 0.022, Mecp2+/− versus Mecp2+/nestin-Cre lox p =< 0.001). (Fig. 1A). Depression in VE during the initial recovery was not augmented in mice with Mecp2 deficiency confined to neurons (Mecp2+/nestin-Cre lox versus WT p = 0.339, Mecp2+/nestin-Cre lox versus Mecp2+/lox p = 0.149). There was significant interaction between strain and duration of exposure to hypoxia or recovery (p = < 0.001). Posthypoxic respiratory depression was directly related to tidal volume: relative VE = 101 – 0.337 × VT; R2 = 0.35; p = <0.001 (Fig. 1B).
Figure 1.
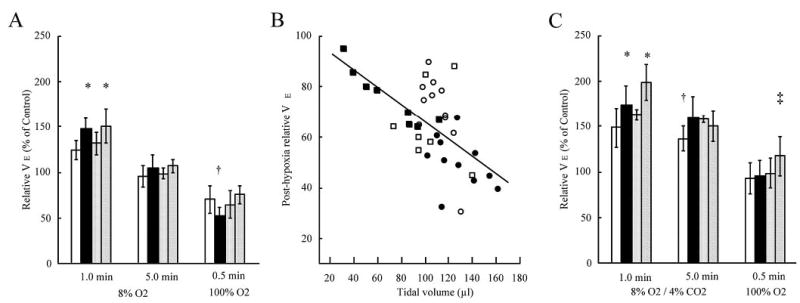
Hypoxic ventilatory response. A) Relative increase in minute ventilation (VE) during and after exposure to 5 min of 8% oxygen. Wild type (WT) (n= 11) open bars; Mecp2+/− (n = 11) solid bars; Mecp2+/lox (n = 7) stippled bars; Mecp2+/nestin-Cre lox (n = 8) diagonal slash bars. Error bars are ± SD* Different from WT and Mecp2+/lox (p = 0.001–0.005); † different from other three strains (p 0.001–0.022). B) Relationship between tidal volume and relative V in first 30 s of recovery for the data in panel A. WT open circles, Mecp2+/− solid circles, Mecp2+/lox open squares, Mecp2+/nestin-Cre lox solid squares C) Relative increase in VE during and after exposure to 5 min of 8% oxygen/4% carbon dioxide. Number of mice and key to bars, same as in panel A. * Different from wild type (WT) and Mecp2+/lox (p =0.001–0.014); † different from other three strains (p =0.002–0.044); ‡ different from WT and Mecp2+/− (p =0.022 and 0.040).
This more pronounced fall in VE following hypoxia-induced hyperventilation in heterozygous Mecp2 females was characterized by episodes of apnea, defined as an expiratory time of 500 ms or greater (Fig. 2). The total duration of apnea during the initial recovery was 7.3 ± 4.1 s/30 s in Mecp2+/− compared with 4.2 ± 2.1 in WT, 4.1 ± 1.8 in Mecp2+/lox and 2.6 ± 2.3 in Mecp2+/nestin-Cre lox (Mecp2+/− versus WT p =0.008, Mecp2+/− versus Mecp2+/lox p = 0.045, Mecp2+/− versus Mecp2+/nestin-Cre lox p = 0.004).
Figure 2.
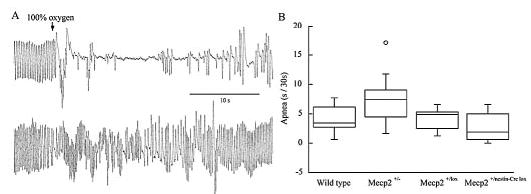
Apnea following hypoxia induced hyperventilation. A) Upper trace from an individual Mecp2+/− mouse and lower trace from an individual Mecp2+/nestin-Cre lox mouse at, and following switch from 8% oxygen to 100% oxygen. B) Box plots of apnea in first 30 s of 100% oxygen after 5 min of hypoxia. Apnea was longer in Mecp2+/− animals than the other three strains (p = 0.004 − 0.045); number of mice same as in Fig. 1.
The respiratory response to hypoxia in male mice was similar to females. In the first min the relative increase in minute ventilation was greater in Mecp2−/y (152 ± 15% of control, n = 4) and Mecp2nestin-Cre lox/y (173 ± 19%, n = 4) than Mecp2+/y (126 ± 8%, n =5), (p =0.024 and 0.002). Respiratory depression in the first 30 s of return to 100% oxygen was greater in Mecp2−/y (50 ± 14%) than Mecp2+/y (72 ± 12%) and Mecp2nestin-Cre lox/y (77 ± 17%), (p = 0.015 and 0.005)
Isocapnic hypoxic ventilatory response
Addition of carbon dioxide altered the ventilatory response to hypoxia (Fig. 1C). The initial response was greater in all four mice strains. As with the hypoxic response, 8% oxygen/4% carbon dioxide resulted in a larger increase in minute ventilation in Mecp2+/− (175 ± 20%) and Mecp2+/nestin-Cre lox (199 ± 19%) than in WT (149 ± 22%). The response in Mecp2+/− did not differ from that in Mecp2+/ox (163 ± 6%), while that in Mecp2+/nestin-Cre lox was greater than that in Mecp2+/−. (Mecp2+/− versus WT p <0.001, Mecp2+/− versus Mecp2+/lox p =0.161, Mecp2+/− versus Mecp2+/nestin-Cre lox p = 0.014; Mecp2+/nestin-Cre lox versus WT p = <0.001, Mecp2+/nestin-Cre lox versus Mecp2+/lox p =0.003). In the 5th min of exposure, VE declined, but remained well above control. On return to 100% oxygen minute ventilation fell to a level not different from control in all strains except Mecp2+/nestin-Cre lox in which VE remained above control and greater than that in the other three strains. It is important to note that addition of carbon dioxide eliminated the exaggerated respiratory depression seen in Mecp2+/− mice after exposure to hypoxia alone. Total apneas in the first 30 s of recovery was less than that seen after hypoxia without added CO2 and similar in all four groups (WT = 1.2 ± 1.1 s/30 s and Mecp2+/− = 1.1 ± 1.3 s/30 s).
Ventilatory response to hyperoxia
To evaluate the contribution of peripheral chemoreceptors to resting respiratory drive the change in VE during the first 5 s of switching from breathing air to breathing 100% oxygen was examined. In WT mice VE fell to 0.87 ± 0.07 of its normoxic level and this decline was not different in Mecp2+/−; 0.88 ± 0.07 (p = 0.643).
Carbon dioxide sensitivity
The ventilatory response to 3, 5 and 7% CO2 was determined in WT and Mecp2+/− animals (Fig. 3). There was a linear increase in VE and the four values were used in measuring CO2 sensitivity. Mecp2+/− mice increased their minute ventilation by 1.71 ± 0.36 mL/min/percent CO2 a result not different from WT: 1.45 ± 0.41 (p = 0.092). Carbon dioxide response in Mecp2+/nestin-Cre lox mice was examined at a single concentration, 5%. Sensitivity (1.51 ± 0.59 mL/min/percent CO2) was similar to wild type.
Figure 3.
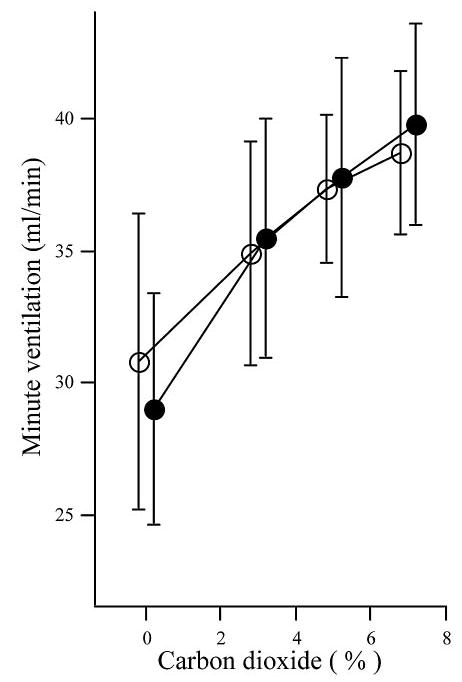
Hypercapnic ventilatory response. Mean (± SD) minute ventilation in 100% oxygen and during successive exposures to 3,5 and 7% carbon dioxide in oxygen. WT (™, n = 14); Mecp2+/− (~, n = 14). Values on x-axis offset for clarity.
Lung volumes and pulmonary compliance
Static lung volumes were measured in deeply anesthetized open thorax mice at 13 to 14.5 mo of age. During inflation lung volumes of Mecp2+/− and WT were not different up to 20 cms H2O (Fig. 4). At 25 and 30 cms H2O inflation and at all deflation pressures Mecp2+/− lung volumes were greater than WT (p = 0.001 − 0.025) (Fig. 4). At 30 cms H2O Mecp2+/− lung volumes were 26.6% larger than WT (1.48 ± 0.24 mL versus 1.17 ± 0.10 mL, p = < 0.001). Pulmonary compliances were determined from the slope of the deflation pressure volume relationship between 7.5 and 0 cms H2O. Mecp2+/− compliance (0.071 ± 0.021 mL/cm H2O), was not different from WT (0.056 ± 0.019 mL/cm H2O) (p = 0.148).
Figure 4.
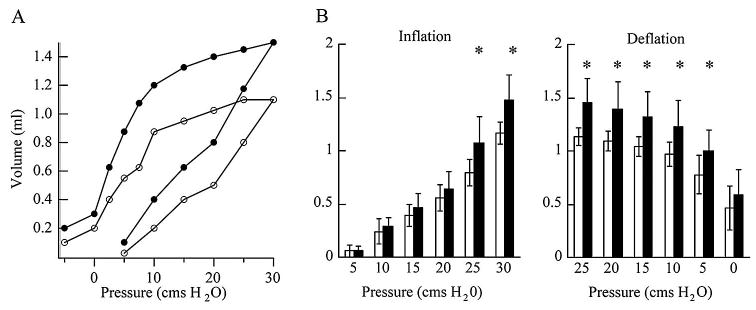
Lung pressure volume relationships. A) Pressure volume curves for individual mice. B) Average inflation and deflation volumes for all animals. WT open circles and open bars (n = 9); Mecp2+/− solid circles and solid bars (n = 10). Error bars are ± SD. * denotes significant differences, (p = 0.001 − 0.025).
Volume of the bronchial tree
The weights of plastic casts of the bronchial tree were used to estimate the anatomical dead space in lungs removed at 13 to 14.5 mo of age. The casts showed bronchial branching to the sixth generation. The volume of Mecp2+/− bronchial trees (0.089 ± 0.014 mL) was the same as WT (0.099 ± 0.016 mL) (p = 0.232).
DISCUSSION
There are two principal findings from these experiments: 1) Post-hyperventilation respiratory depression requires ubiquitous deficiency in Mecp2 and 2) Mecp2 deficiency confined to neurons is sufficient to generate an augmented response to hypoxia. The initial characterizations of mice deficient in Mecp2 found that the phenotype of animals with deficiency confined to neuronal cells (nestin-Cre conditional) was indistinguishable from that of Mecp2-null mice (2,3). These characteristics included: reduced movement, abnormal gait, limb clasping, low weight (3), nervousness, body trembling, pilar erection and occasional hard respiration (2). Respiratory activity was not reported in detail and there was no specific mention of respiratory depression following hyperventilation. In contrast to the phenotypic features mentioned above, deficiency of Mecp2 confined to neurons is not sufficient to produce respiratory depression and prolonged apnea following hyperventilation (Figs. 1A and 2). Male mice carrying the nestin-Cre transgene and the floxed allele of Mecp2 showed a 67% Cre-mediated recombination in the brain (minus the cerebellum) and 85% recombination in the cerebellum (3). If it is assumed that the recombination rate is the same for Mecp2+/nestin-Cre lox mice and their X inactivation is 50%, then the proportion of Mecp2 deficiency may be somewhat greater in Mecp2+/− than in Mecp2+/nestin-Cre lox, and this could contribute to the differences in respiratory responses to hypoxia. At 5 mo of age when the hypoxic studies were performed, however, motor symptoms were similar in the females with ubiquitous Mecp2 deficiency and those with deficiency confined to neurons. Thus the differences in respiratory phenotype are unique.
When 4% carbon dioxide was added to the hypoxic gas mixture (Fig. 1 C), the larger decline in minute ventilation and augmented apnea following hyperventilation was no longer seen in Mecp2+/− mice. The small animal size and experimental approach designed to study animals under a number of protocols, precluded blood gas sampling in these studies. In spontaneously breathing rats, 3.0 to 3.5% CO2 added to a hypoxic gas mixture maintained arterial CO2 at control levels (20). In addition tidal volumes (Table 1) and lung volumes in Mecp2+/− animals were significantly larger than wild type (Fig. 4), and the volume of the bronchial tree in Mecp2 deficient mice did not differ from WT. Since alveolar ventilation is the product of respiratory frequency and tidal volume minus dead space, the smaller dead space: tidal volume ratio in Mecp2+/− mice would lead to a larger alveolar ventilation during hyperventilation. This in turn would result in a greater elimination of CO2 resulting in hypocapnic apnea. This argument is strengthened by the observation that post hyperventilation respiratory depression varied directly with tidal volume (Fig. 1B). Measurement of end tidal and transcutaneous carbon dioxide in RTT patients has shown hypocapnia during episodes of hyperventilation (6,8). In one report this finding was confirmed by measuring arterial CO2 tension (6).
Lung volume at 30cms H2O for the WT mice, which are predominantly C57BL/6J, determined in this study (1.167 ± 0.100 mL) is similar to that previously reported for this strain (21,22). Larger lung volumes have been found in other inbred mouse strains (21,22). As recently shown by Soutiere and Mitzner (23) the inflation curve (Fig. 4A) does not have a plateau. These authors have demonstrated that lung volume in the mouse continues to increase with inflation pressures up to 60 cm H2O. Thus the volumes determined here, while valid over the physiologic range of inflation pressures, do not represent total lung capacity.
Volumes of the bronchial tree in WT and Mecp+/− mice were smaller than that reported for the house mouse (mus musculus), 0.155 mL (24). This may represent strain differences. Alternately the method used by Valerius (24), which involved freezing the lung under constant inflation pressure and then filling them with silicone rubber, may give different results than the plastic installation method used here.
At two months of age Mecp2 protein is heavily expressed in the mouse lung, with levels that exceed those in brain (18). Interestingly, pulmonary RNA expression is less than that seen in other tissues indicating that Mecp2 transcripts are post-transcriptionally controlled. The developmental timetable and cell type specificity for Mecp2 has not been determined in the lung. Lung development involves interaction between epithelial cells that originate from the endoderm and cells of the mesenchyme. This process involves a number of transcription factors, which have roles in cell proliferation, differentiation, migration and fate in both epithelium and mesenchyme (25–28). Currently, the role of Mecp2 in lung growth has not been characterized. The present finding: that Mecp2 deficiency in the lung results in a significant increase in lung volume demonstrates that this DNA binding protein will have to be considered in future work. This is underscored by the finding that lung volume contributes to post-hyperventilation respiratory depression and apnea in Mecp2+/− mice.
While respiratory depression was anticipated in this mouse model of Rett Syndrome the enhanced initial response to hypoxia is surprising. The observation that carbon dioxide sensitivity in Mecp2+/− is similar to WT, indicates that the hypoxic response is not part of a generalized augmented respiratory response. The effect of brain-derived neurotrophic factor (BDNF) on development of nodosepetrosal ganglion (NPG) chemoafferent cells may underlie this finding. Sensory neurons in the NPG relay the response to hypoxia from the carotid body to the nucleus of the solitary tract. In BDNF null mice the dopaminergic subpopulation of NPG cells is depleted by 60% (29,30). These mice have decreased weight specific minute ventilation, which does not significantly decline when they are exposed to 100% oxygen indicating impaired oxygen sensitivity (30). Cortical neurons cultured from P1 Mecp2 deficient mice show a 2-fold increase in expression of the BDNF promoter for axon III (31). Thus it is not unreasonable to propose that an elevated BDNF expression in the NPG during development would result in an enhanced population of chemoafferent neurons in Mecp2 deficient animals. This in turn would lead to their augmented response to hypoxia. When the protein deficiency is confined to neurons and tidal volume is not augmented the greater response to hypoxia persists for the duration of the hypoxic exposure (Fig. 1A). When deficiency includes the lungs, the resultant larger tidal volume and lung volume leads to hypocapnic respiratory depression that masks the enhanced hypoxic response.
Acknowledgments
We thank A. Roger Hohimer and James Maylie for thoughtful comments on the manuscript; Adrian Bird for the Mecp2 lox/lox female mice, Malcolm Low for the Mecp2 nestin-Cre male mice; Veronique Devignot, Althea Hayden and Shane Hentges for genotyping mice; and Judie McDonald for preparation of the manuscript.
Footnotes
Support received from the International Rett Syndrome Association and HD 044453 from NIH.
References
- 1.Amir RE, Van den Veyver IB, Wan M, Tran CQ, Francke U, Zoghbi HY. Rett syndrome is caused by mutations in X-linked MECP2, encoding methyl-CpG-binding protein 2. Nat Genet. 1999;23:185–188. doi: 10.1038/13810. [DOI] [PubMed] [Google Scholar]
- 2.Chen RZ, Akbarian S, Tudor M, Jaenisch R. Deficiency of methyl-CpG binding protein-2 in CNS neurons results in a Rett-like phenotype in mice. Nat Genet. 2001;27:327–331. doi: 10.1038/85906. [DOI] [PubMed] [Google Scholar]
- 3.Guy J, Hendrich B, Holmes M, Martin JE, Bird A. A mouse Mecp2-null mutation causes neurological symptoms that mimic Rett syndrome. Nat Genet. 2001;27:322–326. doi: 10.1038/85899. [DOI] [PubMed] [Google Scholar]
- 4.Luikenhuis S, Giacometti E, Beard CF, Jaenisch R. Expression of MeCP2 in postmitotic neurons rescues Rett syndrome in mice. Proc Natl Acad Sci U S A. 2004;101:6033–6038. doi: 10.1073/pnas.0401626101. [DOI] [PMC free article] [PubMed] [Google Scholar]
- 5.Glaze DG, Frost JD, Zoghbi HY, Percy AK. Rett’s syndrome: characterization of respiratory patterns and sleep. Ann Neurol. 1987;21:377–382. doi: 10.1002/ana.410210410. [DOI] [PubMed] [Google Scholar]
- 6.Southall DP, Kerr AM, Tirosh E, Amos P, Lang MH, Stephenson JB. Hyperventilation in the awake state: potentially treatable component of Rett syndrome. Arch Dis Child. 1988;63:1039–1048. doi: 10.1136/adc.63.9.1039. [DOI] [PMC free article] [PubMed] [Google Scholar]
- 7.Marcus CL, Carroll JL, McColley SA, Loughlin GM, Curtis S, Pyzik P, Naidu S. Polysomnographic characteristics of patients with Rett syndrome. J Pediatr. 1994;125:218–224. doi: 10.1016/s0022-3476(94)70196-2. [DOI] [PubMed] [Google Scholar]
- 8.Schluter B, Aguigah G, Buschatz D, Trowitzsch E, Aksu F. Polysomnographic recordings of respiratory disturbances in Rett syndrome. J Sleep Res. 1995;4:203–207. doi: 10.1111/j.1365-2869.1995.tb00216.x. [DOI] [PubMed] [Google Scholar]
- 9.Kerr AM, Julu PO. Recent insights into hyperventilation from the study of Rett syndrome. Arch Dis Child. 1999;80:384–387. doi: 10.1136/adc.80.4.384. [DOI] [PMC free article] [PubMed] [Google Scholar]
- 10.Julu PO, Kerr AM, Apartopoulos F, Al-Rawas S, Engerstrom IW, Engerstrom L, Jamal GA, Hansen S. Characterisation of breathing and associated central autonomic dysfunction in the Rett disorder. Arch Dis Child. 2001;85:29–37. doi: 10.1136/adc.85.1.29. [DOI] [PMC free article] [PubMed] [Google Scholar]
- 11.Shahbazian MD, Zoghbi HY. Rett syndrome and MeCP2: linking epigenetics and neuronal function. Am J Hum Genet. 2002;71:1259–1272. doi: 10.1086/345360. [DOI] [PMC free article] [PubMed] [Google Scholar]
- 12.Kriaucionis S, Bird A. DNA methylation and Rett syndrome. Hum Mol Genet. 2003;12:R221–R227. doi: 10.1093/hmg/ddg286. [DOI] [PubMed] [Google Scholar]
- 13.Hoffbuhr KC, Moses LM, Jerdonek MA, Naidu S, Hoffman EP. Associations between MeCP2 mutations, X-chromosome inactivation, and phenotype. Ment Retard Dev Disabil Res Rev. 2002;8:99–105. doi: 10.1002/mrdd.10026. [DOI] [PubMed] [Google Scholar]
- 14.Van den Veyver IB, Zoghbi HY. Genetic basis of Rett syndrome. Ment Retard Dev Disabil Res Rev. 2002;8:82–86. doi: 10.1002/mrdd.10025. [DOI] [PubMed] [Google Scholar]
- 15.Van den Veyver IB, Zoghbi HY. Methyl-CpG-binding protein 2 mutations in Rett syndrome. Curr Opin Genet Dev. 2000;10:275–279. doi: 10.1016/s0959-437x(00)00083-6. [DOI] [PubMed] [Google Scholar]
- 16.Amir RE, Van den Veyver IB, Schultz R, Malicki DM, Tran CQ, Dahle EJ, Philippi A, Timar L, Percy AK, Motil KJ, Lichtarge O, Smith EO, Glaze DG, Zoghbi HY. Influence of mutation type and X chromosome inactivation on Rett syndrome phenotypes. Ann Neurol. 2000;47:670–679. [PubMed] [Google Scholar]
- 17.LaSalle JM, Goldstine J, Balmer D, Greco CM. Quantitative localization of heterogeneous methyl-CpG-binding protein 2 (MeCP2) expression phenotypes in normal and Rett syndrome brain by laser scanning cytometry. Hum Mol Genet. 2001;10:1729–1740. doi: 10.1093/hmg/10.17.1729. [DOI] [PubMed] [Google Scholar]
- 18.Shahbazian MD, Antalffy B, Armstrong DL, Zoghbi HY. Insight into Rett syndrome: MeCP2 levels display tissue- and cell-specific differences and correlate with neuronal maturation. Hum Mol Genet. 2002;11:115–124. doi: 10.1093/hmg/11.2.115. [DOI] [PubMed] [Google Scholar]
- 19.Mortola JP, Noworaj A. Two-sidearm tracheal cannula for respiratory airflow measurements in small animals. J Appl Physiol. 1983;55:250–253. doi: 10.1152/jappl.1983.55.1.250. [DOI] [PubMed] [Google Scholar]
- 20.Janssen PL, Fregosi RF. No evidence for long-term facilitation after episodic hypoxia in spontaneously breathing, anesthetized rats. J Appl Physiol. 2000;89:1345–1351. doi: 10.1152/jappl.2000.89.4.1345. [DOI] [PubMed] [Google Scholar]
- 21.Tankersley CG, Rabold R, Mitzner W. Differential lung mechanics are genetically determined in inbred murine strains. J Appl Physiol. 1999;86:1764–1769. doi: 10.1152/jappl.1999.86.6.1764. [DOI] [PubMed] [Google Scholar]
- 22.Reinhard C, Eder G, Fuchs H, Ziesenis A, Heyder J, Schulz H. Inbred strain variation in lung function. Mamm Genome. 2002;13:429–437. doi: 10.1007/s00335-002-3005-6. [DOI] [PubMed] [Google Scholar]
- 23.Soutiere SE, Mitzner W. On defining total lung capacity in the mouse. J Appl Physiol. 2004;96:1658–1664. doi: 10.1152/japplphysiol.01098.2003. [DOI] [PubMed] [Google Scholar]
- 24.Valerius KP. Size-dependent morphology of the conductive bronchial tree in four species of myomorph rodents. J Morphol. 1996;230:291–297. doi: 10.1002/(SICI)1097-4687(199612)230:3<291::AID-JMOR4>3.0.CO;2-H. [DOI] [PubMed] [Google Scholar]
- 25.Whitsett J. A lungful of transcription factors. Nat Genet. 1998;20:7–8. doi: 10.1038/1654. [DOI] [PubMed] [Google Scholar]
- 26.Hogan BL. Morphogenesis. Cell. 1999;96:225–233. doi: 10.1016/s0092-8674(00)80562-0. [DOI] [PubMed] [Google Scholar]
- 27.Perl AK, Whitsett JA. Molecular mechanisms controlling lung morphogenesis. Clin Genet. 1999;56:14–27. doi: 10.1034/j.1399-0004.1999.560103.x. [DOI] [PubMed] [Google Scholar]
- 28.Warburton D, Bellusci S, Del Moral PM, Kaartinen V, Lee M, Tefft D, Shi W. Growth factor signaling in lung morphogenetic centers: automaticity, stereotypy and symmetry. Respir Res. 2003;4:5. doi: 10.1186/1465-9921-4-5. [DOI] [PMC free article] [PubMed] [Google Scholar]
- 29.Ernfors P, Lee KF, Jaenisch R. Mice lacking brain-derived neurotrophic factor develop with sensory deficits. Nature. 1994;368:147–150. doi: 10.1038/368147a0. [DOI] [PubMed] [Google Scholar]
- 30.Erickson JT, Conover JC, Borday V, Champagnat J, Barbacid M, Yancopoulos G, Katz DM. Mice lacking brain-derived neurotrophic factor exhibit visceral sensory neuron losses distinct from mice lacking NT4 and display a severe developmental deficit in control of breathing. J Neurosci. 1996;16:5361–5371. doi: 10.1523/JNEUROSCI.16-17-05361.1996. [DOI] [PMC free article] [PubMed] [Google Scholar]
- 31.Chen WG, Chang Q, Lin Y, Meissner A, West AE, Griffith EC, Jaenisch R, Greenberg ME. Derepression of BDNF transcription involves calcium-dependent phosphorylation of MeCP2. Science. 2003;302:885–889. doi: 10.1126/science.1086446. [DOI] [PubMed] [Google Scholar]