

Abstract
Kar3 is a minus-end-directed microtubule motor that is implicated in meiotic and mitotic spindle function in Saccharomyces cerevisiae. To date, the only truncated protein of Kar3 that has been reported to promote unidirectional movement in vitro is GSTKar3. This motor contains an NH2-terminal glutathione S-transferase (GST) tag followed by the Kar3 sequence that is predicted to form an extended α-helical coiled-coil. The α-helical domain leads into the neck linker and COOH-terminal motor domain. Kar3 does not homodimerize with itself but forms a heterodimer with either Cik1 or Vik1, both of which are non-motor polypeptides. We evaluated the microtubule-GSTKar3 complex in comparison to the microtubule-Kar3 motor domain complex to determine the distinctive mechanistic features required for GSTKar3 motility. Our results indicate that ATP binding was significantly faster for GSTKar3 than that observed previously for the Kar3 motor domain. In addition, microtubule-activated ADP release resulted in an intermediate that bound ADP weakly in contrast to the Kar3 motor domain, suggesting that after ADP release, the microtubule-GSTKar3 motor binds ATP in preference to ADP. The kinetics also showed that GST-Kar3 readily detached from the microtubule rather than remaining bound for multiple ATP turnovers. These results indicate that the extended α-helical domain NH2-terminal to the catalytic core provides the structural transitions in response to the ATPase cycle that are critical for motility and that dimerization is not specifically required. This study provides the foundation to define the mechanistic contributions of Cik1 and Vik1 for Kar3 force generation and function in vivo.
Kar3 is one of six kinesin-related proteins found in the budding yeast Saccharomyces cerevisiae (1–3). It is essential for nuclear fusion during mating (karyogamy) and meiosis I, but Kar3 also has specific mitotic functions during vegetative growth (1, 4). Like Drosophila Ncd, Kar3 is classified as a KinC kinesin (Kinesin-14), because the motor domain is at the carboxyl terminus, and it promotes minus-end-directed microtubule motility (5, 6). In addition, Kar3 possesses microtubule-depolymerizing activity (5). The Kar3 amino-terminal globular domain contains a second microtubule-binding site, followed by a central α-helical domain of ~300 amino acids (7). Kar3 interacts with either Cik1 or Vik1 forming a stable parallel coiled-coil (7–11). These non-motor polypeptides only show 24% sequence identity, but each has a centrally located α-helical domain of ~300 amino acids that results in dimerization with Kar3 (7). This unique heterodimeric structure suggests that Kar3Cik1 and Kar3Vik1 cross-link and slide microtubules relative to each other for their in vivo functions (3).
Fluorescence imaging and genetic studies have implicated Kar3 in multiple microtubule functions during the life cycle of budding yeast (2, 3). These diverse functions are modulated in part by Cik1 and Vik1 for cytoplasmic or nuclear localization because the nuclear envelope remains intact during conjugation, meiosis, and mitosis. In response to mating pheromone, budding yeast initiate polarized cell growth to form a rounded mating projection or “shmoo” tip. In these cells, Cik1 appears to target Kar3 to cytoplasmic or astral microtubules (7–10). Kar3 and Cik1 are interdependent for their localization to the astral microtubules and spindle pole body, and mating cells that lack either Kar3 or Cik1, fail to interdigitate their microtubules and pull their nuclei together after cell fusion (1, 8, 9). More recently, Maddox et al. (12) reported that during conjugation Kar3 couples the microtubule plus-ends to the cortical shmoo tip during microtubule depolymerization and that the Bim1-Kar9 protein complex maintains attachment of the microtubule plus-ends during microtubule polymerization. These studies have localized Kar3 at both the microtubule plus-ends as well as at the minus-ends that are at the spindle pole body (9, 10, 12, 13). Cik1 is also involved in some of the vegetative functions of Kar3 (1, 8–11). Cik1 requires Kar3 for its mitotic spindle localization, and cik1 deletion mutants like kar3 mutants have spindle-assembly defects including enhanced cytoplasmic microtubules and very short mitotic spindles (1, 8–10, 14).
In contrast, Vik1 is not present in pheromone-treated mating cells, and Vik1 is dependent upon Kar3 for its nuclear localization in vegetatively growing cells because it lacks the nuclear localization signal present in both Kar3 and Cik1 proteins (10). In vegetative cells, vik1 deletion mutants exhibit normal spindles. However, Vik1 appears to target Kar3 to the spindle pole body, where microtubule minus-ends are located. In vik1 deletion mutants, Kar3 accumulates on the mitotic spindle microtubules, yet in vik1-cik1 double deletion mutants, Kar3 localizes diffusely throughout the nucleus (10). In addition, Kar3Vik1 is thought to antagonize the function of Cin8 and Kip1, both of which are plus-end-directed microtubule kinesins, and thereby maintain the bipolar mitotic spindle through a balance of forces (10, 11, 14–20). Although Kar3, Cik1, and Vik1 are present throughout meiosis, Cik1 and Vik1 have different meiotic roles and are not functionally redundant despite their secondary structure similarity (4, 21, 22).
Kar3 functions in the nucleus and cytoplasm. There is evidence for Kar3 localization at the minus-end of microtubules at the spindle poles, and Kar3 localization at the plus-end of shmoo tip microtubules during microtubule depolymerization. In addition, there are obvious roles for microtubule cross-linking and minus-end-directed microtubule sliding of one microtubule relative to another. Although Cik1 and Vik1 are thought to be involved in targeting Kar3 spatially and temporally, this hypothesis has not been explored by in vitro experiments to evaluate an alternative hypothesis that Cik1 and Vik1 also modulate Kar3 mechanochemistry. In addition, we do not understand mechanistically how Kar3 can promote both microtubule sliding and microtubule shortening because microtubule sliding requires microtubule lattice binding by Kar3, whereas microtubule shortening requires Kar3 binding at the microtubule end(s).
To begin to understand the mechanistic basis of Kar3 motor activity for its varying functions in vivo, we need a better understanding of Kar3 mechanochemistry independent of Cik1 or Vik1. For our studies, we have chosen the truncated Kar3 motor, GSTKar3,1 because it promotes both ATP-dependent microtubule gliding and microtubule depolymerization (5). This protein contains an NH2-terminal GST tag followed by the Kar3 sequence, which is predicted to form an extended α-helix followed by the neck linker and the COOH-terminal motor domain (Fig. 1A , inset).
Fig. 1. Steady-state ATPase of GSTKar3.

A, inset, domain structure of the Kar3MD and GSTKar3 motors. The Mt·GSTKar3 complex was preformed and reacted with MgATP. Final concentrations: 1 μm GSTKar3, 50 μm tubulin, 20 μm Taxol, 1–1000 μm MgATP, trace [α-32P]ATP. The rate of [α-32P]ATP turnover was plotted as a function of ATP concentration, and the data were fit to the Michaelis-Menten equation: k cat = 0.24 ± 0.004 s−1 with K m ,ATP = 12.2 ± 1.3 μm. B, microtubule concentration dependence. Final concentrations: 1 μm GSTKar3, 0–55 μm tubulin, 20 μm Taxol, 1 mm MgATP, trace [α-32P]ATP. The fit of the data to Equation 1 yields k cat = 0.19 ± 0.004 s−1; K 1/2,Mt = 0.27 ± 0.10 μm. Inset, GSTKar3 at 2 μm was incubated with microtubules (0–20 μm tubulin, 20 μm Taxol) for 30 min in the absence of added nucleotide. The fraction of GSTKar3 sedimenting with the microtubule pellet was plotted as a function of the total microtubule concentration. The fit of the data to quadratic Equation 2 yields the K d ,Mt = 0.33 ± 0.04 μm with maximum fractional binding at 1.04 ± 0.01.
Our mechanistic analysis of GSTKar3 provides insight into the modular design of the kinesin polypeptides because we can now distinguish functional contributions because of structural elements outside of the catalytic core as compared with cooperative interactions that are provided by dimerization. We compared GSTKar3 to the minimal catalytic core motors of Kar3 (Kar3MD), monomeric Ncd (MC6), monomeric conventional kinesin (K341), and monomeric Eg5 (Eg5–367) and to the well characterized dimers of kinesin (K401) and Ncd (MC1) (23–33).
Our results show that GSTKar3, like dimeric Ncd and dimeric kinesin, releases ADP upon microtubule association, and the motor domain returns to a conformation that is more likely to bind ATP rather than rebind ADP. In contrast, the catalytic core monomers (Kar3MD, Ncd MC6, kinesin K341, and Eg5–367) release ADP upon microtubule binding but readily rebind ADP (24, 27, 28, 30, 32–34). These results imply that the characteristic of a more open active site with ADP rebinding does not result because of being monomeric. In addition, ATP did promote detachment of GSTKar3 from the Mt·GSTKar3 complex with kinetics more similar to those of dimeric Ncd. The GSTKar3 motor did not appear to remain bound to the microtubule for multiple ATP turnovers, a hallmark characteristic of catalytic core monomers where ATP turnover is uncoupled from force generation and motility. The results presented here, evaluated in the context of the kinetics for Kar3MD, Ncd, kinesin, and Eg5, indicate that the additional sequence outside of the catalytic core is critical for the complete conformational change of the motor head in response to nucleotide at the active site during the cyclic interactions with the microtubule.
EXPERIMENTAL PROCEDURES
Protein Purification
The GSTKar3 construct was expressed from bacterial strain MR2754, and the clone was generously provided by Dr. Mark Rose, Princeton University (5). The expressed protein has an NH2-terminal GST tag followed by Kar3 sequence containing His277–Lys729. The GSTKar3 protein was purified as described with slight modifications (5). Comparative experiments were performed with the conserved Kar3 motor domain, designated here as Kar3MD. This construct, pMW/Kar3, encodes residues 383–729 of Kar3, and the clone was generously provided by Dr. Sharyn Endow, Duke University (35). Leu383 was changed to Met383 during the plasmid construction. The protein was purified as described (35, 36). Microtubules were assembled from soluble tubulin (cold depolymerized and clarified) and stabilized with 20 μm Taxol. GSTKar3 has been reported to have a microtubule-destabilizing activity at low Taxol concentrations (5). However, at the conditions of the experiments reported here (20 μm Taxol), there was no evidence of GSTKar3 ATP-dependent formation of soluble tubulin based on SDS-PAGE analysis of Mt·GSTKar3 reactions after centrifugation (data not shown).
Buffer Conditions
The kinetic and equilibrium binding experiments were performed at 25 °C in ATPase buffer (50 mm HEPES, pH 7.2, with potassium hydroxide, 5 mm magnesium acetate, 0.1 mm EDTA, 0.1 mm EGTA, 50 mm potassium acetate, 1 mm dithiothreitol, and 5% sucrose).
Steady-state ATPase Kinetics
The rate of ATP turnover was measured by following the hydrolysis of [α-32P]ATP to [α-32P]ADP·Pi as described previously (37). The rate of ATP turnover as a function of microtubule concentration (Fig. 1B ) was fit to the quadratic equation,
| (Eq. 1) |
where Rate is the amount of product formed per second per active site, k cat is the maximum rate constant of steady-state ATP turnover, E 0 is the enzyme concentration, K 1/2,Mt is the steady-state Michaelis constant, and Mt0 is the microtubule concentration (μm tubulin).
Microtubule Equilibrium Binding Experiments
GSTKar3 at 2 μm was incubated with microtubules (0–12 μm) in the absence of any added nucleotide for 30 min, and centrifuged to obtain a supernatant and pellet as described (37). The pellet samples were resuspended in ATPase buffer, resulting in supernatant and pellet samples of equal volume. The samples were treated with 5× Laemmli sample buffer and electrophoresed on an 8% acrylamide, 2 m urea, SDS gel. The gel was stained with Coomassie Blue, and analyzed using NIH Image version 1.62 to determine the concentration of GSTKar3 in the supernatant and pellet at each microtubule concentration. Fractional binding, defined as the ratio of sedimented GSTKar3 to total GSTKar3, is presented in Fig. 1B , inset, as a function of microtubule concentration. The data were fit to the quadratic equation,
| (Eq. 2) |
where Mt·E/E 0 is the fraction of GSTKar3 sedimenting with the microtubule pellet, E 0 is total GSTKar3 concentration, Mt0 is the total tubulin concentration as microtubules, and K d is the dissociation constant.
Analytical Ultracentrifugation
Sedimentation velocity experiments were conducted on Kar3MD at 45,000 rpm and 235 nm, and on GST-Kar3 at 34,000 rpm and 280 nm in a Beckman Optima XLA analytical ultracentrifuge equipped with absorbance optics and an An60Ti rotor. These experiments were performed in ATPase buffer at 24.7 °C. Solution density (1.01959 gm/ml) and viscosity (1.0666 centipoise) were measured as described (38). Velocity data were analyzed by Sedfit (version 1.88 (39)) to produce c(s) plots. C(s) analysis on non-interacting systems is more sensitive to low levels of aggregated species. Quantitative analysis of the data was performed by Sedanal (40) direct boundary fitting to determine the best model, which in this case was a non-interacting two species model (A + B, ideal).
Sedimentation equilibrium experiments on GSTKar3 were conducted in ATPase buffer with 50 μm MgADP at 3.6 °C and 15,000 rpm in charcoal-filled Epon 6 channel centerpieces using a short column technique (65-μl samples in 6-channel centerpieces (41, 42)). Equilibrium data were collected at a spacing of 0.001 cm with 9 averages in a step scan mode at 280 nm. Data sets were edited with REEDIT to extract each channel of data and fit jointly by NONLIN (41) to a single species model as described (38).
Stopped-flow Experiments
The pre-steady-state kinetics of mant-ATP binding, mantADP binding, mantADP release, GSTKar3 binding to microtubules, and detachment of GSTKar3 from microtubules were measured using a KinTek Stopped-Flow instrument (Kintek Corp., Austin, TX) at 25 °C in ATPase buffer. The preparation, purification, and characterization of the N-methylanraniloyl adenosine nucleotides used in this study were described previously (31). For the experiments with these analogs, the fluorescence emission was measured at 450 nm using a 400-nm cutoff long wave pass filter with excitation at 360 nm (Hg arc lamp). The mantATP binding data in Fig. 3B were fit to the following equation,
Fig. 3. Kinetics of mantATP binding.
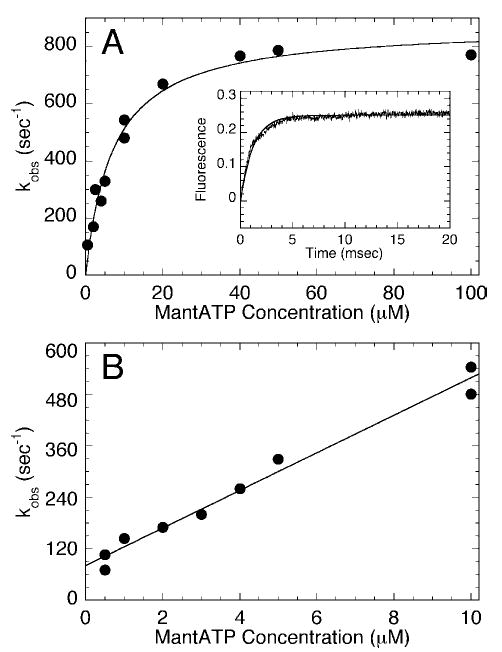
A, a preformed Mt·GSTKar3 complex was rapidly mixed with varying concentrations of mantATP. Final concentrations: 2 μm GSTKar3, 10 μm tubulin, 20 μm Taxol, 0–100 μm mantATP. The inset shows a representative transient at 20 μm mantATP with the fit to a single exponential function (k obs = 670 ± 8.6 s−1). The observed rate of the fluorescence enhancement increased as a function of mantATP concentration, and the fit of the data to a hyperbola provided the maximum rate constant k +1′ = 875 ± 36 s−1; K 1/2,mantATP = 7.1 ± 1.0 μm. B, the data at low mantATP concentration fit to Equation 3 provided the second-order rate constant for mantATP binding, k +1 = 44 ± 2.4 μm −1 s−1. The y intercept provided the off-rate of 81 ± 13 s−1. Final concentrations for the reactions at 0.5–4 μm mantATP were 0.5 μm GSTKar3, 10 μm tubulin, 20 μm Taxol.
| (Eq. 3) |
k obs is the rate constant obtained from the initial exponential phase of the fluorescence enhancement, k + 1 defines the second-order rate constant for mantATP binding, and k off corresponds to the observed rate constant of mantATP dissociation, as determined by the y intercept. The ATP-promoted dissociation kinetics of the Mt·GSTKar3 complex were determined by the change in turbidity monitored at 340 nm.
Acid Quench Experiments
The pre-steady-state kinetic experiments to determine the rate constant for ATP hydrolysis were performed with a rapid chemical quench-flow instrument (Kintek Corp.) at 25 °C in ATPase buffer. GSTKar3 (or Kar3MD) and Taxol-stabilized microtubules were preincubated for 30 min to form the Mt·motor complex and then reacted with [α-32P]ATP for times ranging from 5 ms to 5 s. The reaction was then quenched with 5 m formic acid, expelled from the instrument, and aliquots of each reaction were spotted on thin layer chromatography plates and developed to separate radiolabeled ADP + Pi from ATP. The time course of ATP hydrolysis was determined by the acid quench experiments where the acid-labile products ADP and Pi are formed at the active site of the enzyme during the first turnover. The data were fit to the burst equation,
| (Eq. 4) |
where A is the amplitude of the burst, which represents the formation of [α-32P]ADP·Pi on the active site during the first turnover; k b is the rate constant of the exponential burst phase; t is time in seconds; and k ss is the rate constant of the linear phase (μm product s−1) and corresponds to steady-state turnover.
ADP Equilibrium Binding Experiments
These experiments were designed to determine the relative affinity of ADP for GSTKar3 when the motor was bound to the microtubule. GSTKar3 at 2 μm was incubated with trace amounts of Mg-[α-32P]ATP for 30 min at room temperature. During this incubation, all radiolabeled ATP was converted to [α-32P]ADP·Pi (data not shown). MgADP (0.1–100 μm) plus microtubules (10 μm tubulin + 20 μm Taxol) were added to the motor, which would result in formation of Mt·GSTKar3· [α-32P]ADP intermediate if [α-32P]ADP were tightly bound to active site at these conditions. The reaction mixture was centrifuged at 100,000 × g for 30 min (Beckman Airfuge). The supernatant was removed, and the pellet was resus-pended in 110 μl of 4 n NaOH, followed by addition of 110 μl of ATPase buffer to obtain supernatant and pellet samples of equal volume. The pellets were not rinsed with additional ATPase buffer. Aliquots of the reaction mixture, the supernatant, and the pellet were evaluated by liquid scintillation counting. Control reactions at each ADP concentration were performed with microtubules + [α-32P]ATP in the absence of GSTKar3 to correct for radiolabeled nucleotide that partitioned with the microtubules nonspecifically. Multiple aliquots of 5 μl were used to determine total counts for the calculation of ADP concentration. The data were plotted and fit to the quadratic equation,
| (Eq. 5) |
where Mt·E·ADP is the concentration of ADP bound to Mt·GSTKar3 complex, E 0 is the total GSTKar3 concentration, ADP is the total nucleotide present, and K d is the dissociation constant for ADP.
RESULTS
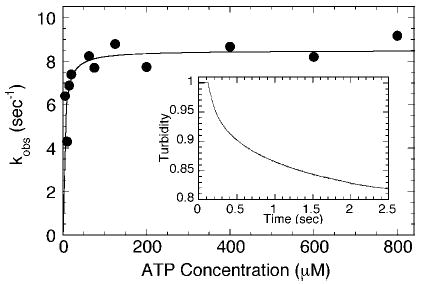
Kar3 and Ncd are both characterized members of the KinC subfamily of the kinesin superfamily. Both promote minus-end-directed motility, but only Kar3 has been shown to depolymerize microtubules (5). Table I includes the experimentally determined constants for GSTKar3 to compare directly to Kar3MD, monomeric Ncd MC6, and dimeric Ncd MC1 (23–25, 43, 44). Schemes 1 and 2 present alternative mechanisms for the Mt·GSTKar3 ATPase with k 1, k 2, etc., linked to the specific step in the ATPase pathway that was determined experimentally.
Table I .
Comparison of Kar3 and Ncd motors
| Constants | GSTKar3a | Kar3MDb | Ncd monomer MC6c | Ncd dimer MC1d |
|---|---|---|---|---|
| MantATP binding | ||||
| k −1 | 44 ± 2.4 μ m −1 s−1 | 1.2 ± 0.2 μ m −1 s−1 | 1.1 ± 0.1 μ m −1 s−1 | 2.3 ± 0.1 μ m −1 s−1 |
| k off | 81 ± 13 s−1 | 6.9 ± 7.3 s−1 | Not observed | |
| k ′ +1 | 875 ± 36 s−1 | NDe | ND | ND |
| K 1/2,mantATP | 7 ± 1.0 μm | |||
| ATP binding by pulse-chase | ||||
| k ′ +1 | ND | 498 ± 76 s−1 | ND | ND |
| K d,ATP | 83 ± 33 μm | |||
| ATP hydrolysis by acid-quench | ||||
| k +2 | 70 ± 20 s−1 | 70 ± 25 s−1 | 11.0 ± 2.3 s−1 | 35 ± 5 s−1 |
| Amplitude | 0.44/site | 0.19/site | 1/site | 1/site |
| ATP-promoted Mt dissociationf | ||||
| k +3 | 8.5 ± 0.4 s−1 | 6.7 ± 0.1 s−1 | 14.0 ± 0.9 s−1 | 12 ± 0.3 s−1 |
| K 1/2,ATP | 3.6 ± 1.2 μm | 5.7 ± 0.3 μm | 19.6 ± 4.5 μm | 18.7 ± 4.1 m |
| Microtubule associationf | ||||
| k +5 | ND | 0.5 μm −1 s−1 | 0.8 ± 0.1 μm −1 s−1 | 0.7 ± 0.1 μm −1 s−1 |
| k −5 | 3 s−1 | 3.6 ± 0.6 s−1 | 2.7 ± 0.6 s−1 | |
| MantADP releaseg | ||||
| k +6 | 0.8 ± 0.02 s−1 | 0.4 ± 0.01 s−1 | 3.9 ± 0.4 s−1 | 1.4 ± 0.02 s−1 h |
| K 1/2,Mt | 1.4 ± 0.16 μm | 3.9 ± 0.3 μm | 28.0 ± 5.7 μm | 0.64 ± 0.06 μm |
| MantADP binding | ||||
| k −6 | Not observed | 1.1 ± 0.01 μm −1 s−1 | 0.6 ± 0.04 μm −1 s−1 | Not observed |
| Steady-state ATPase | ||||
| k cat | 0.25 ± 0.02 s−1 | 0.49 ± 0.02 s−1 | 1.9 ± 0.1 s−1 | 2.0 ± 0.2 s−1 |
| K m,ATP | 12 ± 1.2 μm | 12.2 ± 2.8 μm | 27.8 ± 10.9 μm | 23.1 ± 1.5 μm |
| K 1/2,Mt | 0.2 ± 0.1 μm | 6.0 ± 0.7 μm | 9.6 ± 3.9 μm | 18.3 ± 5.1 μm |
| Mt equilibrium binding | ||||
| K d,Mt | 0.3 ± 0.05 μm | 0.7 ± 0.1 μm | 0.2 ± 0.06 μm | 0.2 ± 0.05 μm |
| ADP equilibrium binding | ||||
| K d,ADP | 20.6 ± 0.5 μm | 1.7 ± 0.6 μm | ND | ND |
20 mm HEPES, pH 7.2, with KOH, 5 mm magnesium acetate, 0.1 mm EGTA, 0.1 mm EDTA, 50 mm potassium acetate, 1 mm dithiothreitol, 5% sucrose at 25 °C. Rate constants correspond to Schemes 1 and 2.
Data from Ref. 25.
Data from Ref. 24.
ND, not determined.
Turbidity.
MantADP competed with excess unlabeled MgATP.
Steady-state ATP Hydrolysis and Equilibrium Binding to the Microtubule
Microtubules are known to dramatically increase the steady-state ATPase activity of kinesin superfamily members from a basal rate of ~0.01 s−1 to rates as high as 100 s−1. In the absence of microtubules, GSTKar3 has an ATPase rate of 0.003 s−1. Fig. 1 shows that GSTKar3 displays microtubule activation of the steady-state rate as expected with k cat = 0.25 s−1. This rate is somewhat less than that observed for Kar3MD at 0.49 s−1 (25, 35) (Table I). The GSTKar3 steady-state parameters are as follows: k cat = 0.25 ± 0.02 s−1 (range: 0.13–0.33 s−1), K m ,ATP = 12.1 ± 1.2 μm (range: 8.3–14.9 μm), K 1/2,Mt = 0.19 ± 0.08 μm (range: 0.04–0.36 μm).
The relative affinity of GSTKar3 for the microtubule was assessed by co-sedimentation assays to determine the fraction of GSTKar3 that partitioned at equilibrium with microtubules in the absence of added nucleotide (Fig. 1B , inset). The results show that 100% of the motors partitioned with the microtubules, and control experiments demonstrated that in the absence of microtubules all GSTKar3 partitioned to the supernatant. The stoichiometry of binding was 1:1 with one GSTKar3 monomer perα,β -tubulin heterodimer. The GSTKar3 motor bound microtubules relatively tightly with the K d ,Mt = 0.33 μm. This constant represents the upper limit for the K d ,Mt at the motor concentration used in this assay and was similar to the constant determined for monomeric and dimeric Ncd at 0.2 μm (Table I). However, the Kar3MD showed a weaker affinity for microtubules at 0.7 μm at the same experimental conditions (25).
Analytical Ultracentrifugation of Kar3MD and GST-Kar3
To analyze the oligomeric state of the Kar3MD, we conducted sedimentation velocity experiments using Kar3MD at three concentrations in the presence of 50 μm MgAMP-PNP, a non-hydrolyzable ATP analog (Fig. 2A ). The c(s) curves for this experiment indicated the presence of a major species at 2.94 s, and a minor species at 5.93 s. Global direct boundary fitting with Sedanal to a non-interacting two-species model (Kar3 monomer plus an aggregated dimer) was consistent with 0.6–8.6% dimer being present (Supplemental Materials Fig. S1). Therefore, the analysis indicated that the Kar3MD was present as a monomer and that the centrifugal tailing observed was because of the presence of aggregated dimer.
Fig. 2. Sedimentation profiles for Kar3MD and GSTKar3.

A, c(s) profiles from sedimentation velocity runs at 42,000 rpm, 235 nm with Kar3MD (1.7–2.6 μm) plus 50 μm MgAMP-PNP. The pattern indicates the presence of two non-interacting species. Direct boundary fitting with Sedanal confirms the presence of predominantly monomer at 2.94 s and the presence of 1–8.6% aggregated dimer at 5.93 s. B, c(s) profiles from a sedimentation velocity run at 34,000 rpm, 280 nm with GSTKar3 (2.4–4.8 μm) in ATPase buffer using 50 μm MgADP. The pattern also suggests the presence of two non-interacting species. C, Sedanal direct boundary fitting of GSTKar3 to a non-interacting two-species model. Twenty scans were fit as difference curves, ΔC versus radius, with only the first and last pair of curves presented for clarity (data in black, fits in red, residuals in green). The data for the highest concentration (12 μm GSTKar3) is presented here with the full global fit presented as Supplemental Materials Fig. S2. The best global fit (root mean square = 0.00454) was to a 5.36-s monomer and 3.6–7.1% of a 9.25-s dimer.
GSTKar3 was also analyzed by analytical centrifugation to determine its active oligomeric state. The protein was spun at three concentrations in the presence of 50 μm MgADP, and the data were also consistent with the presence of two non-interacting species (Fig. 2B ) at 5.36 and 9.25 s. Global direct boundary fitting with Sedanal confirms predominantly monomeric GSTKar3 and the presence of 3.6–7.1% aggregated dimer (Fig. 2C and Supplemental Materials Fig. S2). Thus, the GSTKar3 is also predominantly monomeric in solution.
To confirm these results, we performed sedimentation equilibrium experiments with GSTKar3 covering a concentration range of 2 to 12 μm. Traditional experiments (41) revealed a tendency to aggregate during the run. We used a short column technique to speed up the attainment of equilibrium and spun at 15,000 rpm and 3.6 °C in an attempt to prevent aggregation. NONLIN analysis of the equilibrium data indicated a monomer molecular weight at the early equilibrium times with a gradual increase to molecular weights near dimer (data not shown). The extent of aggregation was worst at the lowest protein concentrations consistent with an irreversible aggregation mechanism. These results indicate that GSTKar3 was predominantly monomeric but was prone to irreversible aggregation to dimers.
MantATP Binding
A Mt·GSTKar3 complex was preformed and rapidly mixed in the stopped-flow instrument with mant-ATP, a fluorescent ATP analog (Fig. 3A ). The rate of the fluorescence enhancement was very rapid and similar to monomeric kinesin. The exponential rate increased linearly as a function of mantATP concentration (Fig. 3B ), providing the second-order rate constant of 44 μm −1 s−1. However, as the mantATP concentration was increased further, the rate saturated. Therefore, we were able to detect the rate-limiting isomerization (k + 1′ = 875 s−1) that occurs prior to ATP hydrolysis to form the Mt·GSTKar3*·ATP intermediate (Schemes 1 and 2).
Scheme 1.
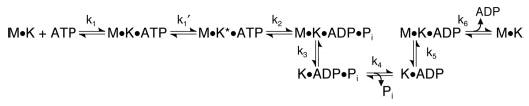
Scheme 2.

Two-step ATP binding is characteristic of kinesins; however, the rate constant observed for formation of the collision complex (k + 1) was significantly faster than observed previously for Kar3MD and Ncd.
Pre-steady-state Kinetics of ATP Hydrolysis
The time course of ATP hydrolysis was determined for the Kar3MD and GSTKar3 (Fig. 4) by preforming a Mt·motor complex and mixing in the rapid quench instrument with 200 μm [α-32P]ATP, followed by a formic acid quench to terminate the reaction. At high ATP concentrations such as the 200 μm MgATP used here, ATP binding is no longer rate-limiting, and the rate of the exponential burst phase represents the rate constant for ATP hydrolysis. For GSTKar3, ATP hydrolysis was observed at 70 s−1. Note that the burst amplitude at 4.4 ± 0.3 μm for the GSTKar3 transient was significantly higher than the 1.9 ± 0.3 μm amplitude observed for the Kar3MD. The amplitude represents the formation of ADP·Pi on the active site during the first turnover. The enzyme concentration used for these acid-quench experiments was 10 μm; therefore, the burst amplitude data indicate that ~44% of the GSTKar3 sites were available to bind and hydrolyze ATP during the first ATP turnover. Note that the burst amplitude for the Kar3MD was significantly less, 1.9 of 10 μm active sites (~19%).
Fig. 4. Kinetics of ATP hydrolysis for GSTKar3 and Kar3MD.

The MtGSTKar3 (•) or Mt·Kar3MD (▪) complexes were rapidly mixed in the chemical quench flow instrument with [μ-32P]ATP. Final concentrations: 10 μm motor, 30 μm tubulin, 30 μm Taxol, 200 μm MgATP, trace [α-32P]ATP. Each transient (only the first 500 ms shown) was fit to the burst equation (Equation 4), which provided the kinetic constants. GSTKar3: A = 4.4 ± 0.3 μm, k b = 70.8 ± 19.6 s−1, k ss = 4.6 ± 0.4 μm s−1/10 μm sites. Kar3MD: A = 1.9 ± 0.3 μm, k b = 69.8 ± 38.3 s−1, k ss = 5.2 ± 0.3 μm s−1/10 μm sites.
ATP-promoted Dissociation Kinetics
For monomeric conventional kinesin, Ncd, Kar3MD, and Eg5–367, the motors remain associated with the microtubule for multiple ATP turnovers (24, 25, 27, 28, 30, 32–34). This observation suggests that cooperative interactions are required for detachment of the motor during the ATPase cycle. For dimeric motors, it has been assumed that the partner motor domain plays a critical role in the dissociation kinetics by weakening the affinity of its partner motor domain. Because GSTKar3 is monomeric and reported to promote microtubule movement, we asked whether GSTKar3 exhibited dissociation kinetics more similar to dimeric motors or did it remain associated with the microtubule as does Kar3MD. Fig. 5 shows that ATP does promote GST-Kar3 detachment from the microtubule. The rate of dissociation was ATP concentration-dependent with the maximal rate constant k + 3 = 8.5 s−1.
Fig. 5. ATP-induced dissociation kinetics.
A, the detachment of GSTKar3 from the microtubule was monitored in the stopped-flow instrument as a function of ATP concentration. Final concentrations: 5 μm GSTKar3, 6 μm tubulin, 20 μm Taxol, 0–800 μm MgATP, 50 mm KCl. Inset, a representative experiment at 800 μm MgATP where the data were fit to two exponential functions. The initial fast phase was k obs = 8.7 ± 0.12 s−1, and second phase was k obs = 0.81 ± 0.01 s−1. The observed rate of the initial fast phase increased as a function of ATP concentration, and the fit of the data to a hyperbola provided the maximum rate constant, k +3 = 8.5 ± 0.4 s−1 and K 1/2,ATP = 3.6 ± 1.3 μm. The second, slower phase did not show ATP-concentration dependence.
The representative transient shown in Fig. 5 indicates that the kinetics are better fit to two-exponential functions. The second, slow phase at 0.7 s−1 was not ATP concentration-dependent and may represent a population of motors that was trapped and slow to release from the microtubule, or alternatively the slow phase may be because of dissociation of higher order aggregates. This type of biphasic signal was seen previously for kinesin, Ncd, and Kar3MD (24, 25, 32).
MantADP Release and ADP Equilibrium Binding
For both Ncd and the Kar3MD, ADP release was the slow step in the ATPase pathway. We next examined mantADP release from the Mt·GSTKar3·mantADP intermediate (Fig. 6A ). ADP at the active site of GSTKar3 was exchanged with mantADP. Upon microtubule binding, the mantADP was released from the active site, and a decrease in fluorescence was observed. The observed rate of mantADP release from the Mt·GSTKar3 complex reached a maximum rate constant k + 6 = 0.8 s−1, comparable with the rate observed for the Mt·Kar3MD (25) (Table I).
Fig. 6. MantADP release kinetics and ADP equilibrium binding.

A, mantADP release kinetics. A preformed GSTKar3·mantADP complex was rapidly mixed in the stopped-flow instrument with Taxol-stabilized microtubules + MgATP. Final concentrations: 2 μm GST-Kar3, 4 μm mantADP, 0–40 μm tubulin, 20 μm Taxol, 1 mm MgATP. The inset shows a representative transient at 12.5 μm microtubules, and the smooth line is the fit of the data to two exponential functions: k obs = 0.72 ± 0.007 s−1 for the initial fast phase and k obs = 0.12 ± 0.001 s−1 for the slower second phase. The rapid, initial phase of mantADP release (•) increased as a function of microtubule concentration, yielding the rate constant, k +6 = 0.80 ± 0.02 s−1; K 1/2,Mt = 1.4 ± 0.16 μm. B, Mt·GSTKar3·[α -32P]ADP co-sedimentation. GSTKar3 at 2 μm was incubated with microtubules (10 μm tubulin, 20 μm Taxol) for 30 min in the presence of varying concentrations of MgATP plus trace [α-32P]ATP. The concentration of [α-32P]ADP that sedimented with the Mt·GSTKar3 complex was plotted as a function of total [α-32P]ADP. The fit of the data to Equation 7 yielded the apparent K d ,ADP = 21.1 ± 2.0 μm.
Another phenomenon observed for monomeric Kar3MD and Ncd MC6 was the retention of ADP at the active site even upon microtubule binding (24, 25). Equilibrium binding assays were employed to determine the relative affinity of the Mt·GSTKar3 complex for [α-32P]ADP (Fig. 6B ). The concentration of [α-32P]ADP in the microtubule pellet increased as a function of ADP concentration; however, the K d ,ADP at 21 μm was significantly weaker than observed for the Kar3MD (K d ,ADP = 1.7 μm) Furthermore, concentration-dependent mantADP binding for the Mt·GSTKar3 complex was not observed (data not shown), yet mantADP did bind in a concentration-dependent manner for the Mt·Kar3MD complex (25). These data suggest that the conformation GSTKar3 assumes after microtubule-activated ADP release was less competent to rebind ADP than observed previously for the Kar3MD. This difference may reflect the importance of structural elements outside of the catalytic core necessary for the structural transitions to reach the precise conformational state that favors ATP binding at the active site.
DISCUSSION
The goal of this study was to evaluate GSTKar3 to determine the mechanistic and structural requirements for Kar3 motility independent of Cik1 or Vik1. We began our analysis by asking whether the GST tag resulted in dimerization of the motor, which would affect our solution studies. The analytical ultracentrifugation results (Fig. 2, and Supplemental Materials Figs. S1 and S2) indicate that the population was predominantly monomeric, and our motility assays (data not shown) confirmed that the GSTKar3 protein we purified also promoted microtubule gliding as reported previously (5). These initial findings indicated that the minimal requirements for Kar3 motility were intrinsic to the GSTKar3 motor.
Our major finding was that microtubules activate ADP release, resulting in a no nucleotide state that favors ATP binding rather than ADP rebinding to the active site. The first indication that there was a significant difference in the behavior of the Kar3MD and GSTKar3 came from the comparative acid-quench experiments (Fig. 4). The burst amplitude for GSTKar3 (0.44/site) was approximately double that of the Kar3MD (0.19/site). Because the burst amplitude represents formation of the Kar3·ADP·Pi intermediate during the first ATP turnover, the increase in the burst amplitude for GST-Kar3 suggests that more sites were free of nucleotide and available to bind and hydrolyze MgATP. Previous studies with the Kar3MD documented rebinding of ADP to the active site after microtubule-activated ADP release (25) (Table I). The ADP equilibrium binding studies for the Mt·GSTKar3 complex reported here (Fig. 6B , Table I) indicate that the affinity for ADP was weaker (21 μm) than observed for the Mt·Kar3MD complex at 1.7 μm. In addition, the Mt·Kar3MD complex exhibited concentration-dependent mantADP binding (k −6 = 1.1 μm −1 s−1), yet when the same experiment was repeated for the Mt·GSTKar3 complex, concentration-dependent mantADP binding was not observed. Each of these experiments indicates a difference in the response of the Mt·GSTKar3 complex after ADP release in comparison to the Mt·Kar3MD complex.
The results also showed that GSTKar3 bound microtubules with higher affinity during the ATPase cycle in comparison to Kar3MD. This observation was apparent in the steady-state kinetics (K 1/2,Mt = 0.2 versus 6 μm for Kar3MD), the microtubule equilibrium binding in the absence of added nucleotide (K d ,Mt = 0.3 versus 0.7 μm for Kar3MD), and the mantADP release kinetics (K 1/2,Mt = 1.4 versus 3.9 μm for Kar3MD) (Table I, Figs. 1 and 6). It is reasonable to assume that the higher affinity for microtubules may result in exclusion of ADP once released from the active site.
Although the Mt·GSTKar3 mantATP binding kinetics were significantly faster at 44 μm −1 s−1 than we observed previously for Kar3MD (1.2 μm −1 s−1) or monomeric Ncd (1.1 μm −1 s−1), there did not appear to be a significant difference in the affinity for ATP during the ATPase cycle. The K 1/2,mantATP was 7 μm, and similar to the steady-state K m ,ATP at 12 μm (Table I). The steady-state K m ,ATP for GSTKar3 and Kar3MD were comparable at 12 μm. The K 1/2,ATP constants for the ATP-promoted microtubule dissociation kinetics were similar with GSTKar3 at 3.6 versus 5.7 μm Kar3MD. The dissociation kinetics also indicated that GSTKar3 readily detaches from microtubules rather than remaining bound for multiple ATP turnovers as observed for the Kar3MD.
Our results indicate that ADP release was the slowest step in the ATPase pathway that we measured although its rate was still faster than steady-state ATP turnover (Table I). However, we have not yet measured phosphate release. In addition, we do not yet know whether GSTKar3 detaches as the Kar3·ADP·Pi intermediate (Scheme 1) as reported for Ncd (23, 43), or alternatively as the Kar3·ADP intermediate (Scheme 2) as observed for conventional kinesin (45, 46). The experiments to distinguish between the two pathways are in progress.
We conclude that the key differences for GSTKar3 mechanochemistry were the higher affinity for microtubules, the weaker affinity for ADP, and the ATP-promoted motor detachment from the microtubule. We attribute these mechanistic differences to the extended NH2-terminal sequence of GSTKar3, which may allow complete motor domain conformations that cannot occur to the same extent for the catalytic core, Kar3MD, which has a truncated neck linker sequence (Fig. 1A , inset). The NH2-terminal amino acid sequence of Kar3MD begins at Met383 (MRGNIRVYCR) and monomeric Ncd MC6 at Met343 includes 2 additional residues (MDLRGNIRVFCR). Both catalytic core motors exhibit similar kinetic behaviors, which were different from the GSTKar3 motor. The catalytic core monomeric motors (Kar3MD and Ncd MC6) both exhibit rebinding of ADP to the active site once released. Because GSTKar3 is also monomeric, we propose that the distinctive behavior of the catalytic core monomers (Kar3MD, Ncd MC6, kinesin K341, and Eg5–367) is because of the loss of amino acid sequence that is required for completion of the key structural transitions.
Our analysis presents a mechanistic understanding of a Kar3 motor that can drive microtubule sliding and microtubule depolymerization. This study provides the foundation to explore the role of Cik1 and Vik1 for motor function in vivo, which is the focus of our ongoing studies.
Supplementary Material
Acknowledgments
We thank Dr. Mark Rose for the GSTKar3 clone, Dr. Sharyn Endow for the Kar3MD clone, and Drs. William Saunders (University of Pittsburgh) and Timothy Lohman (Washington University School of Medicine) for thoughtful comments during the preparation of the manuscript.
Footnotes
This work was supported in part by NIGMS National Institutes of Health Grant GM54141 and NIAMSD National Institute of Health, Career Development Award K02-AR47841 from the Department of Health and Human Services (to S. P. G.).
The on-line version of this article (available at http://www.jbc.org) contains Figs. S1–S2.
The abbreviations used are: GSTKar3, KAR3 gene construct containing His277–Lys729 with an amino-terminal GST tag; GST, gluathione S-transferase; Kar3MD, Kar3 motor domain containing Met383–Lys729; Mt·K, microtubule·GSTKar3 complex; mant, 2′ (3′)-O-(N-methyl-anthraniloyl); AMP-PNP, 5′-adenylyl-β,γ-imidodiphosphate.
References
- 1.Meluh PB, Rose MD. Cell. 1990;60:1029–1041. doi: 10.1016/0092-8674(90)90351-e. [DOI] [PubMed] [Google Scholar]
- 2.Hildebrandt ER, Hoyt MA. Biochim Biophys Acta. 2000;1496:99–116. doi: 10.1016/s0167-4889(00)00012-4. [DOI] [PubMed] [Google Scholar]
- 3.Manning BD, Snyder M. Trends Cell Biol. 2000;10:281–289. doi: 10.1016/s0962-8924(00)01774-8. [DOI] [PubMed] [Google Scholar]
- 4.Bascom-Slack CA, Dawson DS. J Cell Biol. 1997;139:459–467. doi: 10.1083/jcb.139.2.459. [DOI] [PMC free article] [PubMed] [Google Scholar]
- 5.Endow SA, Kang SJ, Satterwhite LL, Rose MD, Skeen VP, Salmon ED. EMBO J. 1994;13:2708–2713. doi: 10.1002/j.1460-2075.1994.tb06561.x. [DOI] [PMC free article] [PubMed] [Google Scholar]
- 6.Middleton K, Carbon J. Proc Natl Acad Sci U S A. 1994;91:7212–7216. doi: 10.1073/pnas.91.15.7212. [DOI] [PMC free article] [PubMed] [Google Scholar]
- 7.Barrett JG, Manning BD, Snyder M. Mol Biol Cell. 2000;11:2373–2385. doi: 10.1091/mbc.11.7.2373. [DOI] [PMC free article] [PubMed] [Google Scholar]
- 8.Page B, Snyder M. Genes Dev. 1992;6:1414–1429. doi: 10.1101/gad.6.8.1414. [DOI] [PubMed] [Google Scholar]
- 9.Page BD, Satterwhite LL, Rose MD, Snyder M. J Cell Biol. 1994;124:507–519. doi: 10.1083/jcb.124.4.507. [DOI] [PMC free article] [PubMed] [Google Scholar]
- 10.Manning BD, Barrett JG, Wallace JA, Granok H, Snyder M. J Cell Biol. 1999;144:1219–1233. doi: 10.1083/jcb.144.6.1219. [DOI] [PMC free article] [PubMed] [Google Scholar]
- 11.Cottingham FR, Gheber L, Miller DL, Hoyt MA. J Cell Biol. 1999;147:335–350. doi: 10.1083/jcb.147.2.335. [DOI] [PMC free article] [PubMed] [Google Scholar]
- 12.Maddox PS, Stemple JK, Satterwhite L, Salmon ED, Bloom K. Curr Biol. 2003;13:1423–1428. doi: 10.1016/s0960-9822(03)00547-5. [DOI] [PubMed] [Google Scholar]
- 13.Maddox P, Bloom K, Salmon E. Nat Cell Biol. 2000;2:36–41. doi: 10.1038/71357. [DOI] [PMC free article] [PubMed] [Google Scholar]
- 14.Saunders W, Hornack D, Lengyel V, Deng CC. J Cell Biol. 1997;137:417–431. doi: 10.1083/jcb.137.2.417. [DOI] [PMC free article] [PubMed] [Google Scholar]
- 15.Hoyt MA, He L, Loo KK, Saunders WS. J Cell Biol. 1992;118:109–120. doi: 10.1083/jcb.118.1.109. [DOI] [PMC free article] [PubMed] [Google Scholar]
- 16.Saunders WS, Hoyt MA. Cell. 1992;70:451–458. doi: 10.1016/0092-8674(92)90169-d. [DOI] [PubMed] [Google Scholar]
- 17.Roof DM, Meluh PB, Rose MD. J Cell Biol. 1992;118:95–108. doi: 10.1083/jcb.118.1.95. [DOI] [PMC free article] [PubMed] [Google Scholar]
- 18.Hoyt MA, He L, Totis L, Saunders WS. Genetics. 1993;135:35–44. doi: 10.1093/genetics/135.1.35. [DOI] [PMC free article] [PubMed] [Google Scholar]
- 19.Saunders W, Lengyel V, Hoyt MA. Mol Biol Cell. 1997;8:1025–1033. doi: 10.1091/mbc.8.6.1025. [DOI] [PMC free article] [PubMed] [Google Scholar]
- 20.Huyett A, Kahana J, Silver P, Zeng X, Saunders WS. J Cell Sci. 1998;111:295–301. doi: 10.1242/jcs.111.3.295. [DOI] [PubMed] [Google Scholar]
- 21.Shanks RM, Kamieniecki RJ, Dawson DS. Genetics. 2001;159:939–951. doi: 10.1093/genetics/159.3.939. [DOI] [PMC free article] [PubMed] [Google Scholar]
- 22.Shanks RM, Bascom-Slack C, Dawson DS. Cell Cycle. 2004;3:363–371. [PubMed] [Google Scholar]
- 23.Foster KA, Mackey AT, Gilbert SP. J Biol Chem. 2001;276:19259–19266. doi: 10.1074/jbc.M008347200. [DOI] [PubMed] [Google Scholar]
- 24.Mackey AT, Gilbert SP. Biochemistry. 2000;39:1346–1355. doi: 10.1021/bi991918+. [DOI] [PubMed] [Google Scholar]
- 25.Mackey AT, Gilbert SP. J Biol Chem. 2003;278:3527–3535. doi: 10.1074/jbc.M206219200. [DOI] [PubMed] [Google Scholar]
- 26.Ma YZ, Taylor EW. J Biol Chem. 1997;272:724–730. doi: 10.1074/jbc.272.2.724. [DOI] [PubMed] [Google Scholar]
- 27.Ma YZ, Taylor EW. J Biol Chem. 1997;272:717–723. doi: 10.1074/jbc.272.2.717. [DOI] [PubMed] [Google Scholar]
- 28.Pechatnikova E, Taylor EW. J Biol Chem. 1997;272:30735–30740. doi: 10.1074/jbc.272.49.30735. [DOI] [PubMed] [Google Scholar]
- 29.Pechatnikova E, Taylor EW. Biophys J. 1999;77:1003–1016. doi: 10.1016/S0006-3495(99)76951-1. [DOI] [PMC free article] [PubMed] [Google Scholar]
- 30.Jiang W, Hackney DD. J Biol Chem. 1997;272:5616–5621. doi: 10.1074/jbc.272.9.5616. [DOI] [PubMed] [Google Scholar]
- 31.Gilbert SP, Moyer ML, Johnson KA. Biochemistry. 1998;37:792–799. doi: 10.1021/bi971117b. [DOI] [PubMed] [Google Scholar]
- 32.Moyer ML, Gilbert SP, Johnson KA. Biochemistry. 1998;37:800–813. doi: 10.1021/bi9711184. [DOI] [PubMed] [Google Scholar]
- 33.Cochran JC, Sontag CA, Maliga Z, Kapoor TM, Correia JJ, Gilbert SP. J Biol Chem. 2004;279:38861–38870. doi: 10.1074/jbc.M404203200. [DOI] [PMC free article] [PubMed] [Google Scholar]
- 34.Moyer ML, Gilbert SP, Johnson KA. Biochemistry. 1996;35:6321–6329. doi: 10.1021/bi960017n. [DOI] [PubMed] [Google Scholar]
- 35.Song H, Endow SA. Biochemistry. 1996;35:11203–11209. doi: 10.1021/bi960997b. [DOI] [PubMed] [Google Scholar]
- 36.Gulick AM, Song H, Endow SA, Rayment I. Biochemistry. 1998;37:1769–1776. doi: 10.1021/bi972504o. [DOI] [PubMed] [Google Scholar]
- 37.Gilbert SP, Mackey AT. Methods (Orlando) 2000;22:337–354. doi: 10.1006/meth.2000.1086. [DOI] [PubMed] [Google Scholar]
- 38.Correia JJ, Gilbert SP, Moyer ML, Johnson KA. Biochemistry. 1995;34:4898–4907. doi: 10.1021/bi00014a047. [DOI] [PubMed] [Google Scholar]
- 39.Schuck P. Biophys J. 2000;78:1606–1619. doi: 10.1016/S0006-3495(00)76713-0. [DOI] [PMC free article] [PubMed] [Google Scholar]
- 40.Stafford W, Sherwood PJ. Biophys Chem. 2004;108:231–243. doi: 10.1016/j.bpc.2003.10.028. [DOI] [PubMed] [Google Scholar]
- 41.Johnson ML, Correia JJ, Yphantis DA, Halvorson HR. Biophys J. 1981;36:575–588. doi: 10.1016/S0006-3495(81)84753-4. [DOI] [PMC free article] [PubMed] [Google Scholar]
- 42.Correia, J. J., and Yphantis, D. A. (1992) Analytical Ultracentrifugation in Biochemistry and Polymer Science (Harding, S. E., Rowe, A. J., and Horton, J. C., eds) pp. 231–252, Royal Society of Chemistry, Cambridge, United Kingdom
- 43.Foster KA, Correia JJ, Gilbert SP. J Biol Chem. 1998;273:35307–35318. doi: 10.1074/jbc.273.52.35307. [DOI] [PubMed] [Google Scholar]
- 44.Foster KA, Gilbert SP. Biochemistry. 2000;39:1784–1791. doi: 10.1021/bi991500b. [DOI] [PubMed] [Google Scholar]
- 45.Klumpp LM, Hoenger A, Gilbert SP. Proc Natl Acad Sci U S A. 2004;101:3444–3449. doi: 10.1073/pnas.0307691101. [DOI] [PMC free article] [PubMed] [Google Scholar]
- 46.Crevel IM, Nyitrai M, Alonso MC, Weiss S, Geeves MA, Cross RA. EMBO J. 2004;23:23–32. doi: 10.1038/sj.emboj.7600042. [DOI] [PMC free article] [PubMed] [Google Scholar]
Associated Data
This section collects any data citations, data availability statements, or supplementary materials included in this article.