

Abstract
It is believed that atherosclerotic plaque rupture may be related to maximal stress conditions in the plaque. More careful examination of stress distributions in plaques reveals that it may be the local stress/strain behaviors at critical sites such as very thin plaque cap and locations with plaque cap weakness that are more closely related to plaque rupture risk. A “local maximal stress hypothesis” and a stress-based computational plaque vulnerability index (CPVI) are proposed to assess plaque vulnerability. A critical site selection (CSS) method is proposed to identify critical sites in the plaque and critical stress conditions which are be used to determine CPVI values. Our initial results based on 34 2D MRI slices from 14 human coronary plaque samples indicate that CPVI plaque assessment has an 85% agreement rate (91% if the square root of stress values is used) with assessment given by histopathological analysis. Large-scale and long-term patient studies are needed to further validate our findings for more accurate quantitative plaque vulnerability assessment.
Keywords: Stroke, Heart attack, Plaque cap rupture, Fluid-structure interaction, Carotid artery, Coronary, Blood flow, Cardiovascular diseases
INTRODUCTION
In our previous paper,37 a three-dimensional (3D) MRI-based computational model with multicomponent plaque structure and fluid-structure interactions (FSI) was introduced to perform mechanical analysis for human atherosclerotic plaques and identify critical flow and stress/strain conditions which may be related to plaque rupture. However, to identify a limited number of risk indicators for plaque assessment and rupture predictions from the vast amount of data given by 3D medical images and computational simulations is a very challenging job. In this paper, we will introduce a “local maximal stress hypothesis” and a stress-based computational plaque vulnerability index (CPVI) to assess plaque vulnerability. Local maximal stress results tracked at critical sites in the plaque will be used to determine CPVI values for the reasons given in this paper. A semiquantitative histopathological method will be used to classify plaques into different grades, according to factors, which are known to correlate with plaque vulnerability. This histopathological classification will be used as the “gold standard” to validate our computational index. 34 human coronary plaque samples (2D slices) were studied and our CPVI index showed an impressive 85% agreement rate with histopathological classifications.
Cardiovascular disease (CVD) is the no. 1 killer in the western world and it has been suggested that it will become the leading cause of death worldwide in the twenty-first century.13,23,27,28 More than 60% of all myocardial infarction is caused by rupture of a vulnerable plaque. “Every year, nearly half of heart attack victims (over 650,000 only in the United States) are unaware of their vulnerability to a near future heart attack until it happens. And more than 220,000 of them die within an hour. Essentially, they each are a walking time bomb and completely unaware.” said Dr. Morteza Naghavi, chairman of the SHAPE (Screening for Heart Attack Prevention and Education) Task Force who founded the Association for Eradication of Heart Attack (AEHA).2 Available screening and diagnostic methods are insufficient to identify the victims before the event occurs.21,22 Noninvasive methods to identify additional new and emerging biomarkers to assess plaque vulnerability and predict possible rupture before the fatal event actually happens are urgently called for.2
The current state of the art for screening and diagnosis of patients with atherosclerotic plaques is still based on medical images such as MRI, ultrasound, intravascular ultrasound (IVUS), or CT technologies and experiences from their physicians. In recent years, MRI techniques have shown great potential to noninvasively quantify plaque size, shape, and components (fibrous cap, lipid-rich necrotic core, and calcification/inflammation).32,40 Yuan41 and Cai et al.7 developed multicontrast techniques to improve the quality of MR images and to better differentiate various components of the plaque. Attempts of using ultrasound and IVUS techniques have been made to quantify vessel motion, mechanical properties, and vessel wall structure, even to predict rupture locations.8,24–26 IVUS has the ability to provide more accurate information about lumen surface conditions including inflammation and erosion.24 Chandran et al. presented a mechanical analysis of diseased arterial segments reconstructed from intravascular ultrasound images in order to quantitatively identify regional alterations in the elastic constants with atherosclerotic lesions.8 Their method could be potentially employed to identify the extent and location of atherosclerotic lesions in a systematic analysis and may potentially be used for the early detection of lesion growth. However, IVUS is minimally invasive which limits its potential in clinical applications.
While plaque morphology and related imaging technologies are important for identifying vulnerable plaques and providing critical information about plaque components, mechanical forces also play an important role in plaque progression and rupture process. Both mechanical forces (rupture triggers) and plaque structure are key factors in the rupture process and should be considered in an integrated way.10 Mechanical image analysis has the potential to provide a new spectrum of mechanical biomarkers for more accurate plaque assessment. Since plaque stress cannot be measured directly under in vivo condition, computational modeling becomes an essential tool.
MRI-based computational simulations for plaque rupture investigation and vulnerability assessment have been proposed but are limited to 2D or 3D structure-only or 3D flow-only models due to the complexity of the problem.9,11,16–20,39 Kaazempur-Mofrad et al. introduced a 3D MRI-based FSI model to investigate the correlations between fluid dynamic parameters and histological markers of atherosclerosis.14 In vivo MRI data were acquired with in-plane resolution of approximately 0.39 mm × 0.39 mm and slice thickness of 2 mm. It was difficult to identify plaque components in the vessel wall with that resolution. Therefore, plaque components were not included in their 3D model. Tang et al. have been developing models with fluid-structure interactions for blood flow in stenotic arteries and effects of various controlling factors on flow and stress/strain distributions have been quantified.33–38 While various computational models have been introduced to perform mechanical stress analysis for atherosclerotic plaques and many good results have been published, a mechanical stress-based computational index scheme to assess plaque vulnerability is lacking in the current literature.
MODELS AND METHODS
The Solid and Fluid Models
For the 3D FSI models, blood flow is assumed to be laminar, Newtonian, viscous and incompressible. The incompressible Navier–Stokes equations with arbitrary Lagrangian–Eulerian (ALE) formulation are used as the governing equations, which are suitable for FSI problems with frequent mesh adjustments. Both artery vessel material and plaque components in the plaque are assumed to be hyperelastic, isotropic, incompressible and homogeneous. No-slip conditions and natural traction equilibrium conditions are assumed at all interfaces. The 3D nonlinear modified Mooney–Rivlin (M–R) model is used to describe the material properties of the vessel wall and plaque components.3,4 The strain energy function is given by.
| (1) |
where I1 and I2 are the first and second strain invariants, ci and Di are material constants chosen to match experimental measurements and existing literature.5,6,15,19,39 In this paper, the following values were chosen for the baseline models: vessel material: c1 = 92, 000 dyn cm−2, c2 = 0, D1 = 36, 000 dyn cm−2, D2 = 2; lipid-rich core: c1 = 5, 000 dyn cm−2, c2 = 0, D1 = 5, 000 dyn cm−2, D2 = 1.5; calcification: c1 = 920, 000 dyn cm−2, c2 = 0, D1 = 360, 000 dyn cm−2, D2 = 2. These parameter values were used in our previous studies and the stress-strain curve derived from the M-R model agrees well with experimental data.15,33–38 Further details about the models can be found from our earlier paper (Tang et al.37 and Bathe).3,4
For 2D models, cross-sectional MRI images are used to get the geometries. The solid model and material parameters are the same as those used in the 3D FSI model. Lumen pressure is imposed to obtain stress/strain distributions in the plaque. No flow will be involved in these 2D models because we are taking only one cross-section of the plaque and no pressure gradient can be prescribed. Even though 2D models are more simplified than 3D models, relative differences of stress/strain values from different plaques can still be used for quantitative plaque assessment. 3D plaque samples and MRI data are not readily available. Furthermore, 3D models are much harder to solve and requires much more computing resources (CPU time: about 8 min for one cardiac cycle for 2D model, 180 min for one cycle for 3D FSI model with IBM Server X-series 235, Type 8671, dual-processor each at 2.4 GHz, 6-GB RAM). 2D plaque samples are used in this paper to obtain some preliminary data, which may justify further effort using 3D models.
Fixation Procedures and Histopathological Plaque Vulnerability Index (HPVI)
Due to lack of 3D plaque samples and MRI data, this study was conducted mainly based on 2D MRI slices obtained from human coronary plaque samples, with a few 3D samples used for illustration purposes only. 34 2D MRI images of coronary artery plaques were collected from 14 autopsy patients (10 males, 4 females, aged 60 ± 15 years). Six patients died of coronary artery disease (CAD). All specimens were fixed in a 10% buffered formalin solution and placed in a polyethylene tube. They were stored at 4°C within 12 h after removal from the heart. MRI imaging was taken within 2 days at room temperature.
After completion of MR study, the transverse sections with a thickness of 5 μm were obtained at 0.5 mm intervals from each specimen. These paraffin-embedded sections were stained with hematoxylin and eosin (H&E), Masson’s trichrome, and elastin van Gieson’s (EVG) stains to identify major plaque components: calcification (Ca), lipid rich necrotic core (LRNC), and fibrotic plaques (FP). Sections were examined by Dr. Saffitz to characterize plaque structure and composition. We used the following Histopathological Plaque Vulnerability Index (HPVI) for plaque classifications and vulnerability assessment. HPVI values (denoted by V, ranging from 0 to 4) for atherosclerotic plaques were determined using a semiquantitative analysis of structural features known to correlate with vulnerability. These features include (a) the size and distribution of the soft lipid core (which correlates directly with risk of rupture); (b) the fibrous capsule thickness (which correlates inversely with vulnerability); (c) the number of macrophages and T-lymphocytes at the shoulders of the plaque and near the luminal interface (which correlates directly with tendency to rupture); (d) the number of smooth muscle cells (which correlates inversely with risk of rupture). The HPVI class definitions and their comparisons with AHA classifications29–31 are given by Table 1. Some plaque samples from different classes are given in Fig. 1. While we are trying to bring quantitative analysis to plaque assessment, it should be noted that quantitative plaque classification is extremely difficult and is subject to change and adjustment according to further scientific and clinical findings due to the complexity of plaque structure and limitation of measurement accuracies. HPVI will be used as the basis to establish computational plaque assessment schemes and validate computational findings.
TABLE 1.
Histopathological plaque classifications and comparison with AHA classifications.
| HPVI | Plaque | Description | AHA classification |
|---|---|---|---|
| V = 0 | Very stable | Normal or slight intimal thickening | Class I, some atherogenic lipoprotein, adaptive intimal thickening |
| V = 1 | Stable | Moderate intimal thickening, no extracellular lipid, calcification or significant inflammation | Class II (fatty streak), III (preatheroma) |
| V = 2 | Slightly unstable | Small lipid core (<30% of plaque size); calcification may be present; thick fibrous cap (>200 μm); little or no inflammation at plaque shoulders | Class IV, Vb, and Vc |
| V = 3 | Moderately unstable | Moderate lipid core (30–40% of plaque size) and fibrous cap (65–200 μm); moderate intraplaque hemorrhage; moderate inflammation. | Class Va |
| V = 4 | Highly unstable | Large lipid core(>40%); thin fibrous cap(<65 μm); large intraplaque hemorrhage; extensive inflammation at plaque shoulders; evidence of previous plaque rupture | Class VI. |
FIGURE 1.
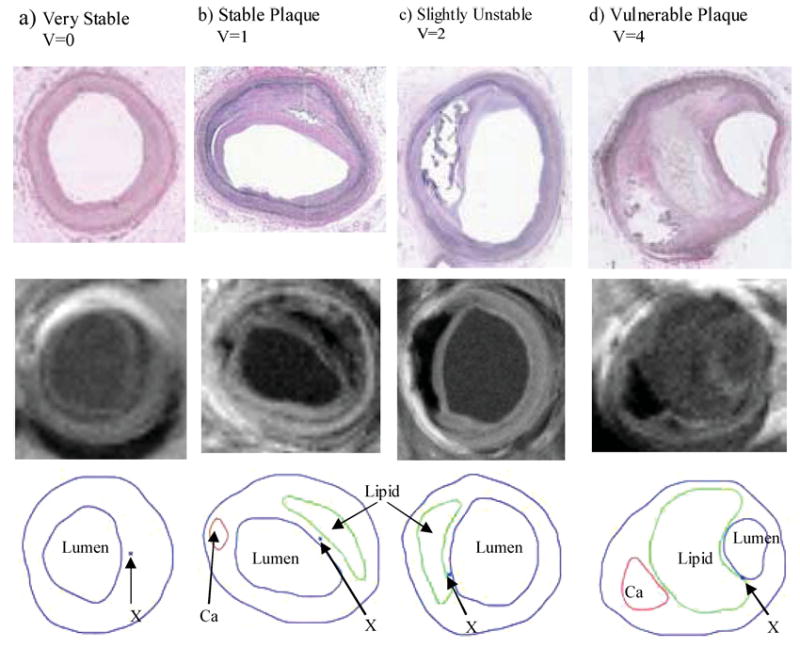
Histological (upper) and MR (middle) images and segmented contour plots (lower) of selected sample plaques with various degrees of vulnerability as classified by histopathological analysis. Critical sites (explained later) are indicated by “X.” (a) a remarkable stable plaque used as the baseline case; (b) a well-caped stable plaque, V = 1; (c) an unstable plaque with a large lipid core and thin cap; (d) a vulnerable plaque with a huge lipid-rich necrotic core, a separate Ca deposit, and a very thin cap near lumen with many inflammatory cells.
Segmentation and 3D Reconstruction
MRI data sets obtained from human atherosclerotic plaques with high resolution were read and segmented by a self-developed software package Atherosclerotic Plaque Imaging Analysis (APIA) written in Matlab (MathWorks, MATLAB, Natick, MA). All the segmented 2D slices were then read into ADINA input file, pixel by pixel. ADINA is a commercial finite element package (ADINA R & D, Inc., Watertown, MA) which has been tested by hundreds of real-life applications and has been used by Tang et al. in the last several years to solve FSI models.33–38 Computational mesh was made using ADINA automated mesh generation system. However, due to the complexity of plaque geometry, each plaque was divided into many “volumes” (ADINA terminology) so that proper mesh could be chosen to fit the shape of each component, the vessel, and the fluid domain. Finer mesh was used for thin plaque cap and components with sharp angles to get better resolution and handle high stress concentration behaviors. Intensive interactions and additional programming from the operator/researcher were needed due to the complexity of plaque morphology and components. Figure 2 shows a 2D coronary plaque slice sample and a 3D plaque geometry re-constructed from 36 MRI slices of a cadaveric human coronary plaque sample with relatively high resolutions (0.1 mm × 0.1 mm for 2D, 0.25 mm × 0.23 mm × 0.5 mm for 3D). The diameter of the 3D plaque sample is about 5–6 mm. MR image slice thickness is 0.5 mm. The total length of the vessel shown is 17.5 mm. Some smoothing (third-order spline) was applied to correct numerical and MR artifacts.
FIGURE 2.
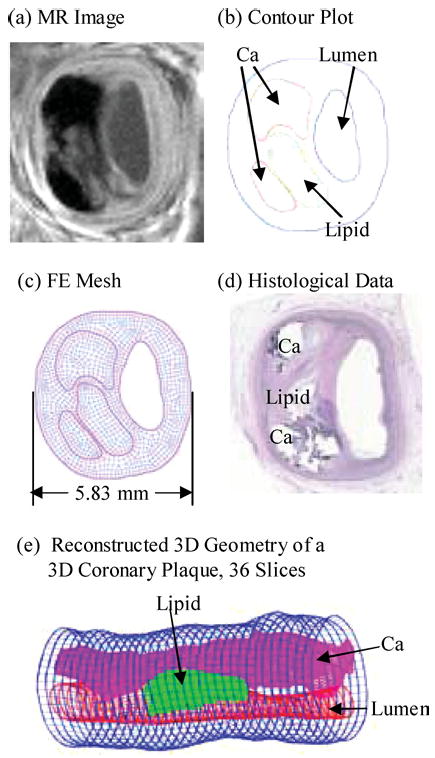
2D and 3D plaque samples with large lipid cores and calcifications.
Solution Method for the Computational Model
The 2D structure model and 3D fully coupled fluid and structure models were solved by ADINA. ADINA uses unstructured finite element methods for both fluid and solid models. Nonlinear incremental iterative procedures are used to handle fluid-structure interactions. The governing finite element equations for both the solid and fluid models are solved by the Newton-Raphson iteration method. For the 2D cases, both steady and pulsating pressure conditions were imposed in the lumen and stress/strain distributions in the plaques were obtained from the solutions of the model. For the 3D cases, the artery was stretched axially and pressurized gradually to specified conditions before we began the unsteady simulation under pulsating pressure conditions. Mesh analysis was performed until differences between solutions from two consecutive meshes were negligible (less than 1% in L2-norm). Details of the computational models and solution methods can be found from Bathe3,4 and Tang et al.37
Assessing Plaque Vulnerability: CSS Method and CPVI
The “Maximal Stress Hypothesis” May Be Misleading
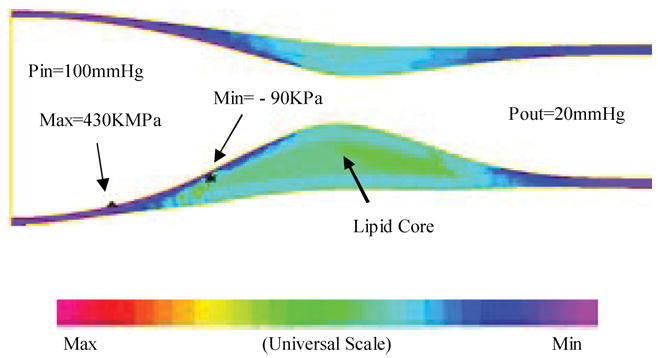
To assess plaque vulnerability mechanically, we must start from a good “candidate” list, i.e., mechanical stress/strain quantities and their locations which may be related to plaque rupture. One current hypothesis in the literature is that maximal stress may be related to possible plaque rupture and may be used for plaque vulnerability assessment (maximal stress hypothesis).9,12,18–20,39 As reasonable as it sounds, the validity of the maximal stress hypothesis is really questionable. Figures 3–5 show that global maximal stress often appears at healthy parts of the vessel where either vessel wall is thinner than the diseased plaque side or vessel curvature is large.35–37
FIGURE 3.
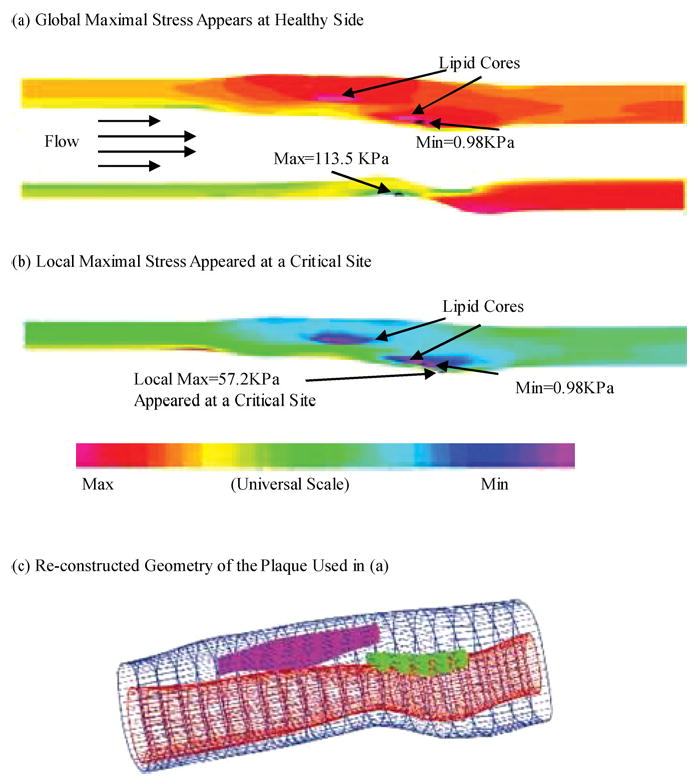
Global maximal stress often appears at healthy parts of the vessel where vessel wall is thinner than the diseased plaque side or the curvature is larger. On the other hand, local maximal stress may appear at locations where plaque rupture is more likely to occur.
FIGURE 5.
A 3D example based on in vitro experimental data showing that global maximal stress may appears at a healthy site where the vessel is thin.35
Indeed, stress distributions in atherosclerotic plaques are affected by many factors which include (but are not limited to) (a) Blood pressure which is the driving force of flow and vessel deformation. (b) Vessel and plaque geometry. Vessel thickness and lumen area are both important. Thicker wall leads to lower stress in the structure. Narrower lumen area reduces the total fluid force acting on the structure and also leads to lower stress in the plaque. (c) Plaque structure. Multicomponent structure makes the solid part nonhomogeneous. (d) Material properties of the vessel and plaque components. (e) Fluid wall shear stress. (f) Axial prestretch and residual stresses if included in the model. (g) Inflammation and erosion. Blood pressure in severely stenosed artery is very nonuniform as indicated by our previous studies.31–34 At the throat of the plaque (narrowest part of the lumen), pressure is lower due to high velocity there. In addition to that, the vessel wall (which includes artery and plaque material) is much thicker in the plaque region. Lumen area is reduced. Those factors lead to lower stress in the plaque region. That is why maximal stress was often observed at the healthy part of the vessel when the healthy side of the vessel is much thinner than the diseased side [Figs. 3(a), 4(b), and 5]. On the other hand, a large lipid pool and very thin plaque cap may change that. Global maximal stress can be observed at plaque cap if the cap becomes very thin and the lipid core is large enough. The combination of plaque geometry, vessel thickness, plaque cap thickness and flow forces determines global maximal stress and its location. The relationship between global maximal stress and plaque rupture needs to be further investigated.
Proposing the Local Maximal Stress Hypothesis and CSS Method
For the above reasons, we turn our attention to local maximal stress/strain values and their variations—a local maximum of a function only requires that it is the greatest value in a surrounding neighborhood. Figure 3(b) shows that a local maximal stress was found at the thin cap location where plaque rupture may be possible while the “maximal stress hypothesis” criterion missed this site [Fig. 3(a)]. We propose the following “local maximal stress hypothesis”: local maximal stress values at critical locations may be more closely related to possible plaque rupture and may be used for more accurate mechanical plaque assessment. Preliminary results will be presented in next section to support our proposed hypothesis. Since any global maximum is certainly a local maximum, we are broadening our search when using the local maximum hypothesis.
Stress/strain conditions and locations which may be related to plaque rupture are called “critical stress/strain conditions” and “critical sites.” A “critical site selection” (CSS) method is proposed to concentrate on plaque stress/strain behaviors at locations where local stress/strain maxima are found. These will include locations of very thin cap, weakened cap sites, and other sites of special interest. Search for local maxima and their sites can be programmed easily and made automatic. Stress/strain values at those sites will be grouped by site category, analyzed by standard statistical methods, and the group showing best correlation with HPVI will be chosen as the “critical site” (CS) stress/strain values. Critical sites which are clearly caused by fixation procedures and imaging artifacts will be excluded from further statistical analysis. Experience from physicians, radiologists, and pathologists can be combined with computational techniques in the critical site selection process. In a way, we are trying to program experience from physicians, radiologists, and pathologists in a more automatic and robust process. Overall, the site-selection process is automatic and site additions/exclusions will be made only if they are fully justified by known reasons such as imaging artifacts, excessive deformation from fixation, and model limitations. It is extremely challenging to identify a short list of critical indicators to be used by physicians to assess plaque vulnerability from the vast time-dependent 3D flow and stress/strain data and complex correlations among various factors. CSS method reduces the full 3D search to the investigation of well-selected sites.
The 3D plaque sample given by Fig. 2(e) will be used to demonstrate some preliminary results from our CSS method. Pulsating upstream pressure Pin = 90–150 mmHg, downstream pressure Pout = 89.5–126 mmHg were chosen to represent a typical high-pressure case (see Fig. 6). Corresponding flow rate is between 2–15 ml s−1. A 10% axial prestretch was applied. Six sites were selected from various locations to observe stress/strain variations under various conditions (Fig. 7). Among them, X4 is a critical site at the thin cap of a lipid core; X1 and X2 are located between the Ca block and lumen; X3, X5, and X6 are less critical points serving as “control.” Figure 7(d) shows that the thin cap location (X4) has much greater (>400%) stress variation than other locations. This result shows a clear difference of stress behaviors between the critical site (thin cap over a large lipid core) and other noncritical sites.
FIGURE 6.
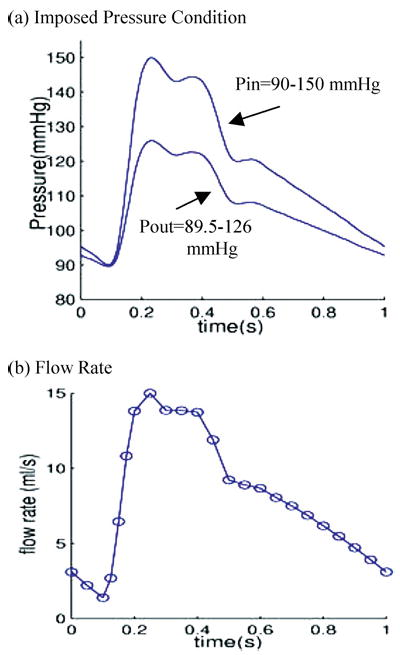
Prescribed pulsating pressure condition for the simulations and corresponding flow rate. (a) A typical cardiac pressure profile scaled to 90–150 mm Hg and used as the upstream pressure (Pin). Down stream pressure (needed for 3D model) is chosen so that flow rate will be within physiological range; (b) Flow rate corresponding to the prescribed pressure conditions.
FIGURE 7.
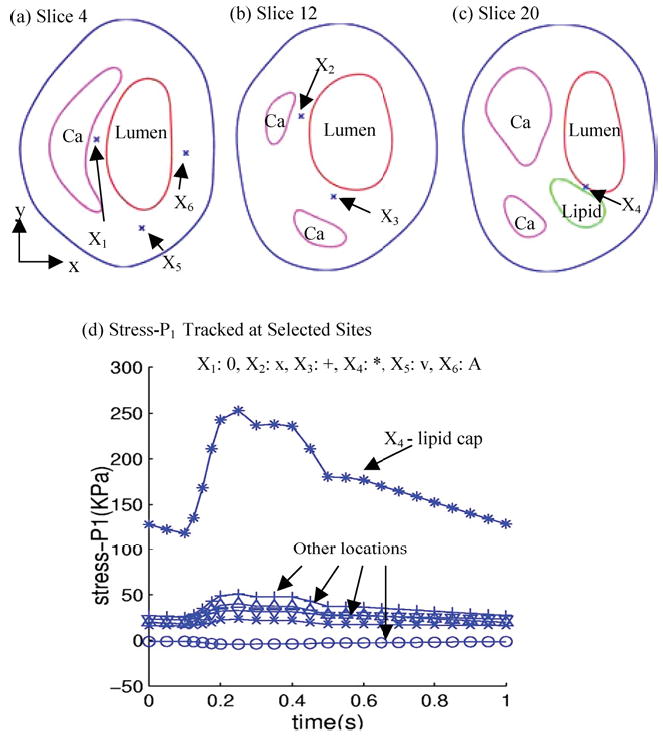
Tracking of stress components at selected sites under pulsating pressure showing critical site at the thin lipid cap has much greater stress variations. (a–c) Normal and critical sites selected to track stress/strain variations. X1: calcification cap; X2: thicker Ca cap; X3: thicker Ca cap; X4: thin lipid cap (most vulnerable site); X5: normal point to observe stress-xx; X6: normal point to observe stress-yy; (d) Stress variation at the thin cap site is much greater (>400%) than that at other sites.
Introducing the Stress-Based Computational Plaque Vulnerability Index
Computational simulations will be performed using plaque morphologies obtained from MRI images. Critical stress values (Stress-P1 at selected critical sites corresponding to maximal pressure value from one cardiac cycle) will be obtained using the CSS method for each of the samples. Statistical analysis using an ordinal multinomial generalized linear model1 will be performed to quantify the relation between these CS Stress-P1 values and plaque vulnerability as defined by HPVI. A stress-based computational plaque vulnerability index (CPVI, also ranging from 0 to 4) will be assigned to each 2D slice sample evaluated according to the highest probability predicted by the statistical model. Stress intervals for all CPVI grades will also be determined based on the data from the samples evaluated. Good agreement between CPVI and HPVI will indicate that the CPVI scheme has certain potential for future clinical applications. Preliminary results are given in next section.
RESULTS
CPVI Determined by an Ordinal Multinomial General Linear Model
Initial results were obtained from 34 MRI 2D slices from 14 autopsy patients (human coronary plaques) using 2D models under pulsating pressure conditions given by Fig. 6. Histological images of the plaques were examined to classify the vulnerability of these plaques. Histological and MR images of four selected plaques together with their segmented contour plots showing boundaries of various components and selected critical sites are given in Fig. 1. The site-selection procedure was explained in the previous section. Simulations were conducted under pulsating pressure (P = 90–150 mmHg) and CS Stress-P1 values corresponding to peak pressure were obtained for statistical analysis. Since the srelationship between plaque vulnerability (HPVI) and CS Stress-P1 is unknown (i.e., whether it is linear, nonlinear, or of any other type of relationship), an ordinal multinomial general linear model was fit to the data using CS Stress-P1 as the predictor.1 In this model, CPVI grades are treated as ordinal numbers, i.e., their order is maintained, however, CPVI = 4 does not mean that it is twice as much as CPVI = 2. The fitted model took the form1
| (2) |
where S stands for CS Stress-P1 which is used as the predictor. The probabilities C(k) in (2) are cumulative probabilities: i.e.,
| (3) |
The individual probabilities which are computed from the fitted model (2) and used to decide the classification are given by
| (4) |
| (5) |
The model was fit using the method of maximum likelihood, with the computations performed by the genmod procedure of SAS statistical software. The fitted parameter values along with standard errors and p-values (in parenthesis) are
Based on this model, estimates of the probabilities of each case taking on each of the possible HPVI values were computed (Table 2). The value k was assigned as the CPVI value for that plaque sample for which the estimated probability, Pr(k) was highest (see Table 2). Correspondence between CPVI grades and CS Stress-P1 values as quantified by this procedure is given by Table 3.
TABLE 2.
CPVI has good agreement with HPVI for plaque vulnerability assessment.
| Plaque # | HPVI | CS Stress-P1 | Pr(0) | Pr(1) | Pr(2) | Pr(3) | Pr(4) | CPVI | CPVI vs. HPVI |
|---|---|---|---|---|---|---|---|---|---|
| 1 | 0 | 10.20 | 0.84412 | 0.15353 | 0.00235 | 0.00000 | 0.00000 | 0 | 1 |
| 2 | 0 | 7.90 | 0.88594 | 0.11242 | 0.00164 | 0.00000 | 0.00000 | 0 | 1 |
| 3 | 0 | 4.04 | 0.93433 | 0.06477 | 0.00089 | 0.00000 | 0.00000 | 0 | 1 |
| 4 | 0 | 13.20 | 0.77185 | 0.22440 | 0.00375 | 0.00000 | 0.00000 | 0 | 1 |
| 5 | 0 | 15.10 | 0.71521 | 0.27974 | 0.00505 | 0.00000 | 0.00000 | 0 | 1 |
| 6 | 0 | 2.32 | 0.94907 | 0.05025 | 0.00068 | 0.00000 | 0.00000 | 0 | 1 |
| 7 | 1 | 28.60 | 0.23216 | 0.72741 | 0.04043 | 0.00000 | 0.00000 | 1 | 1 |
| 8 | 1 | 21.10 | 0.49499 | 0.49218 | 0.01283 | 0.00000 | 0.00000 | 0 | 0 |
| 9 | 1 | 25.60 | 0.32614 | 0.64822 | 0.02565 | 0.00000 | 0.00000 | 1 | 1 |
| 10 | 1 | 26.70 | 0.28942 | 0.68025 | 0.03033 | 0.00000 | 0.00000 | 1 | 1 |
| 11 | 1 | 40.60 | 0.04403 | 0.73929 | 0.21668 | 0.00000 | 0.00000 | 1 | 1 |
| 12 | 2 | 51.50 | 0.00827 | 0.38726 | 0.60447 | 0.00000 | 0.00000 | 2 | 1 |
| 13 | 2 | 48.30 | 0.01358 | 0.50582 | 0.48059 | 0.00000 | 0.00000 | 1 | 0 |
| 14 | 2 | 103.00 | 0.00000 | 0.00020 | 0.99940 | 0.00039 | 0.00000 | 2 | 1 |
| 15 | 3 | 171.00 | 0.00000 | 0.00000 | 0.05546 | 0.79291 | 0.15163 | 3 | 1 |
| 16 | 3 | 217.00 | 0.00000 | 0.00000 | 0.00004 | 0.00406 | 0.99590 | 4 | 0 |
| 17 | 4 | 185.00 | 0.00000 | 0.00000 | 0.00649 | 0.37730 | 0.61621 | 4 | 1 |
| 18 | 4 | 339.00 | 0.00000 | 0.00000 | 0.00000 | 0.00000 | 1.00000 | 4 | 1 |
| 19 | 4 | 204.50 | 0.00000 | 0.00000 | 0.00031 | 0.02813 | 0.97157 | 4 | 1 |
| 20 | 0 | 7.43 | 0.89318 | 0.10530 | 0.00152 | 0.00000 | 0.00000 | 0 | 1 |
| 21 | 2 | 137.00 | 0.00000 | 0.00000 | 0.92391 | 0.07523 | 0.00086 | 2 | 1 |
| 22 | 2 | 99.40 | 0.00000 | 0.00035 | 0.99942 | 0.00022 | 0.00000 | 2 | 1 |
| 23 | 0 | 22.50 | 0.44039 | 0.54368 | 0.01593 | 0.00000 | 0.00000 | 1 | 0 |
| 24 | 1 | 46.90 | 0.01686 | 0.55690 | 0.42624 | 0.00000 | 0.00000 | 1 | 1 |
| 25 | 0 | 2.29 | 0.94929 | 0.05003 | 0.00068 | 0.00000 | 0.00000 | 0 | 1 |
| 26 | 0 | 12.10 | 0.80080 | 0.19604 | 0.00316 | 0.00000 | 0.00000 | 0 | 1 |
| 27 | 0 | 13.00 | 0.77733 | 0.21904 | 0.00364 | 0.00000 | 0.00000 | 0 | 1 |
| 28 | 4 | 241.00 | 0.00000 | 0.00000 | 0.00000 | 0.00009 | 0.99990 | 4 | 1 |
| 29 | 4 | 174.80 | 0.00000 | 0.00000 | 0.03134 | 0.72376 | 0.24490 | 3 | 0 |
| 30 | 4 | 224.30 | 0.00000 | 0.00000 | 0.00001 | 0.00130 | 0.99869 | 4 | 1 |
| 31 | 4 | 317.20 | 0.00000 | 0.00000 | 0.00000 | 0.00000 | 1.00000 | 4 | 1 |
| 32 | 2 | 74.50 | 0.00023 | 0.01722 | 0.98255 | 0.00000 | 0.00000 | 2 | 1 |
| 33 | 1 | 24.90 | 0.35071 | 0.62625 | 0.02304 | 0.00000 | 0.00000 | 1 | 1 |
| 34 | 1 | 30.60 | 0.18097 | 0.76452 | 0.05451 | 0.00000 | 0.00000 | 1 | 1 |
Note. CPVI values are determined based on value k giving highest predicted probability, Pr(k). CS Stress-P1 results are from 2D models and are subject to modifications when 3D models are used and more plaque samples become available. Under CPVI vs. HPVI, 1: agree, 0: disagree. Disagreement for Plaque #8 is really marginal.
TABLE 3.
CPVI and CS Stress-P1 correspondence as quantified by the ordinal multinomial general linear model.
| CPVI value | CST Stress-P1 range (kPa) |
|---|---|
| 0 | (0, 21.5) |
| 1 | [21.5, 48.65) |
| 2 | [48.65, 153.05) |
| 3 | [153.05, 181.85) |
| 4 | [181.85, 500+) |
Note. The intervals are sensitive to the number of cases considered and their HPVI distributions. The group with HPVI = 3 is underrep-resented in this data set.
HPVI, CPVI, CS Stress-P1 and the estimated probabilities (labeled Pr(0), Pr(1), Pr(2), Pr(3), and Pr(4)) for the 34 slice samples are listed and compared in Table 2. The agreement rate is about 85% which is fairly impressive. The agreement rate became 91% when the square root of CSST Stress-P1 values was used in the statistical analysis procedure.
Linear Regression Analysis and the Pearson Product-Moment Correlation
Comparison between the global maxima of Stress-P1 distribution and the CS Stress-P1 values is given by Fig. 8 which shows clearly that CS Stress-P1 correlates much better with HPVI than global maxima of Stress-P1. The linear function fitting the data by regression analysis [Fig. 8(b)] is given by
FIGURE 8.
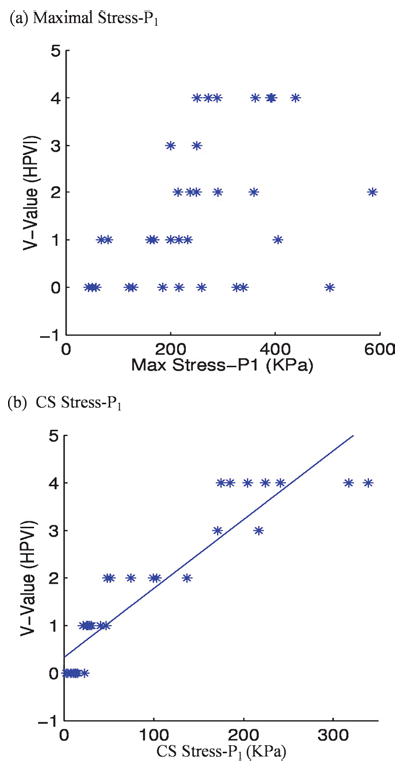
Stress-P1 by CSS shows much better correlation with HPVI than global maxima of Stress-P1 from 34 coronary 2D plaque samples. p < 0.0001.
| (6) |
where V is HPVI, and S stands for CS Stress-P1. The correlation (Pearson product-moment correlation) between CS Stress-P1 and HPVI is 0.92, which is highly significant (p < 0.0001). A 99% confidence interval for the population correlation is (0.82, 0.97). In contrast, the correlation between global maximum stress and HPVI is 0.46, which, while significant (p = 0.0125), is not highly significant. A 99% confidence interval for the population correlation is (−0.01, 0.72).
DISCUSSION
Model Assumptions and Limitations
The main purpose of this paper is to communicate our views and preliminary evidence that the “local maximal stress hypothesis” should be used to replace the “maximal stress hypothesis” so that research effort could lead to better results and findings. The CPVI results were from 2D models based on 34 2D MRI slices from 14 patients while the corresponding histopathological data (HPVI) were used as the benchmark to quantify CPVI grades. Our findings will be further improved when more 3D data and results become available. When using 3D MRI data and 3D models, HPVI will be determined for each slice and the highest HPVI value from all the slices will be picked as the HPVI grade for the plaque under consideration. The 3D stress/strain solutions will be searched numerically to identify local maxima and their locations. Those sites will be examined and critical sites and the associated stress/strain values will be selected to be used for statistical analysis and CPVI assignment. We are currently accumulating more 3D plaque samples and results will be reported in a future paper.
Another limitation of the current investigation is that it is based on ex vivo MRI images. The plaques are no longer under in vivo conditions and there are normally considerable differences between their ex vivo and in vivo morphologies. As much as it is desired, in vivo 3D MRI data is not currently available. However, our preliminary results indicate that critical sites are related to local morphologies which are less affected by the differences between ex vivo and in vivo morphologies. The CSS process also helps to eliminate some artifacts caused by fixation procedures and deformation of plaque samples.
In a way, our current research can be viewed as a necessary preparation for future in vivo investigations. With all the above model limitations, our local maximal stress hypothesis and CSS method will remain applicable and will be used in our future investigations to improve the accuracy of our CPVI-based predictions.
CPVI Validation, Gold Standard, and Clinical Relevance
Histopathological analysis is currently regarded as the “gold standard” for validation of MRI tissue identification and is used in this paper as the gold standard for computational plaque assessment. HPVI is used as the benchmark to introduce and establish our stress-based CPVI. While postmortem histological sections do have deformations from their in vivo shape, their critical features such as cap thickness, lipid pool size can be determined, with the help of MRI images taken before sectioning. Long-term patient tracking data with the actual plaque progression and rupture rate can serve as a better in vivo “gold standard” for predictive research. However, collection of 3D in vivo data with detailed plaque component information and development of an in vivo plaque assessment scheme require better resolutions and long-term effort (5–10 years or longer). A gold standard for in vivo plaque assessment has yet to be established. Lack of an in vivo gold standard makes it difficult to assess plaques with ultimate confidence and accuracy. Our results provide initial evidence that computational plaque stress/strain analysis may lead to better quantitative predictions if it can be further validated by large-scale long-term patient studies.
Model Validation; Models Based on Histological, Ex Vivo and In Vivo Data
Computational model validations have been performed based on in vitro experimental data in our previous studies and good agreement was found.33–36 It is well known that models based on histological sections are less accurate due to deformations from the fixation procedures.37 Our current models are based on ex vivo MRI images and axial stretch (for 3D models) and pressurization (for 2D and 3D models) are added to recover the in vivo shape of the plaque as much as computationally possible. For in vivo image-based models, we actually need to shrink the plaque geometry to an estimated zero-stretch/zero pressure shape, then stretch and pressurize it to get the correct initial stress/strain distributions in the plaque. This step can affect the computational stress predictions by as much as 400–600%.38 Cardiac motion has considerable effect on stress/strain distributions in coronary arteries and will be added in our future models. Validation using in vivo data is tied to the same resolution issues and is difficult at present time.
Selection of Indices and Multidimensional Nature of Rupture Risk Assessment
While the CS Stress-P1 values obtained by CSS method were used in this paper to quantify CPVI, it should be understood that the results are preliminary and are only from 2D models. All stress/strain components, together with their variations under pulsating pressure used in the simulation (Fig. 6, Pin = 90–150 mmHg) were examined. Stress/strain values at peak pressure (Pin = 150 mmHg), their variations between the maximum (150 mmHg) and minimum pressures (90 mmHg), shear stress/strain components were obtained by CSS method for statistical analysis. It was found from the 34 cases that CS Stress-P1 values have the best correlation with HPVI. Stress-P1 variations did not give better correlation, as we originally hoped to see.
We are searching for the right index or indices for plaque assessment. It is commonly believed that plaque rupture risk assessment should be multidimensional. Factors from plaque morphology, material strength, lumen surface erosion and inflammation, mechanical stress/strain conditions, blood pressure, cell activities, and chemical environment in the blood should all be taken into consideration. It must be noted that vulnerability is material dependent and the absolute value of stress compared to material strength is an important factor. Results from our 3D models, together with extensive statistical analysis, will give more complete and accurate mechanical analysis. Predictions from mechanical side can be compared with predictions from other channels for comparisons and mutual enhancement.
MRI Resolution Limitation and MRI Image-Based Modeling
For ex vivo 2D MRI images, we actually have 0.1 × 0.1 mm2 resolution for the first 18 cases, and 0.055 × 0.055 mm2 (FOV = 28 mm × 28 mm, Matrix = 512 × 512) for the last 16 cases (see Table 2). Resolution limitation becomes a real problem mainly when in vivo 3D MRI data are used.
In computational models, contours (or surfaces if 3D method is used) for plaque components are generated based on segmentation data, with interpolations so that computational geometry can be generated. Once the computational geometry is generated, lumen area, lipid pool size, and cap thickness can be calculated numerically. While the actual image resolution does not change in this process, computational analyses are performed based on the computational geometries with high “numerical accuracies.” This is commonly done in MRI imaged-based research. Researchers who use MRI to conduct their research try their best to move forward with the limited resolution available, hoping future technology could bring better resolution (the “sit here and wait” strategy would not be helpful to our research). Because of that, computational predictions based on limited resolution can be regarded as “hypothetical” predictions, i.e., they are true if the original data can provide the resolution needed. There are other model assumptions (such as material properties and blood pressure conditions) which also make computational predictions hypothetical. As such, computational predictions are subject to further validations, and should be taken with precaution. One calming argument is that these limitations related to computational modeling can be viewed as “system errors.” When the same imaging technology and modeling procedure are applied to patients, all results come with the same system errors and comparative studies can still provide reliable predictions.
In summary, the 2D MRI data used in this paper have reasonable resolutions. However, 3D MRI-based models will have to carry that limitation in the near future while the MRI technology improves itself to deliver higher resolution.
CONCLUSION
Initial evidence has been presented to indicate that the “maximal stress hypothesis” for plaque vulnerability analysis should be improved by the “local maximal stress hypothesis” which states that local maximal stress conditions obtained by CSS method may correlate better with plaque rupture risk. A stress-based computational plaque vulnerability index (CPVI) was introduced. Initial results based on 34 2D MRI images from 14 human coronary plaque samples indicate that CPVI plaque assessment has an 85% agreement rate (91% if square root of stress values was used) with assessment given by histopathological analysis (HPVI). Large scale and long-term patient studies are needed to further validate potential stress/strain risk indicators for plaque vulnerability assessment.
FIGURE 4.
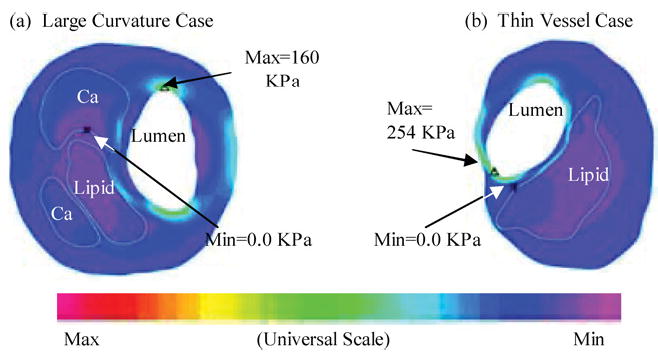
2D examples showing that global maximal stress often appears at healthy parts of the vessel where the curvature is larger (a) or the vessel wall is thinner than the diseased plaque side.
Acknowledgments
This research was supported in part by NSF grant DMS-0072873 and NIH grant NIH/NIBIB, 1 R01 EB004759 as part of the NSF/NIH Collaborative Research in Computational Neuroscience Program. Dr Jie Zheng is supported in part by a Charles E. Culpeper Biomedical Pilot initiative grant 01-273. The authors would like to thank Prof Roger D. Kamm (MIT) for his professional advice and helpful discussion in this research.
References
- 1.Agresti, A. Categorical Data Analysis, 2nd ed. New York: Wiley & Sons, 2002.
- 2.Association for Eradication of Heart Attack (AEHA), Leaders in Cardiology from AEHA’s National SHAPE Task Force Propose New, AEHA Press Release, BusinessWire, March 03, 2005. Available at http://www.businesswire.com/cgi-bin/mmg.cgi?eid=4835722, 2005.
- 3.Bathe, K. J. Finite Element Procedures. New Jersey: Prentice Hall, 1996.
- 4.Bathe, K. J. (Ed.). Theory and Modeling Guide, Vols. I and II: ADINA and ADINA-F. Watertown, MA: ADINA R & D, Inc., 2002.
- 5.Beattie D, Xu C, Vito RP, Glagov S, Whang MC. Mechanical analysis of heterogeneous, atherosclerotic human aorta. J Biomech Eng. 1998;120:602–607. doi: 10.1115/1.2834750. [DOI] [PubMed] [Google Scholar]
- 6.Brossollet LJ, Vito RP. A new approach to mechanical testing and modeling of biological tissues, with application to blood vessels. J Biomech Eng. 1996;118:433–439. doi: 10.1115/1.2796028. [DOI] [PubMed] [Google Scholar]
- 7.Cai JM, Hatsukami TS, Ferguson MS, Small R, Polissar NL, Yuan C. Classification of human carotid atherosclerotic lesions with in vivo multicontrast magnetic resonance imaging. Circulation. 2002;106:1368–1373. doi: 10.1161/01.cir.0000028591.44554.f9. [DOI] [PubMed] [Google Scholar]
- 8.Chandran KB, Mun JH, Choi KK, Chen JS, Hamilton A, Nagaraj A, McPherson DD. A method for in-vivo analysis for regional arterial wall material property alterations with atherosclerosis: Preliminary results. Med Eng Phys. 2003;25:289–298. doi: 10.1016/s1350-4533(02)00224-2. [DOI] [PubMed] [Google Scholar]
- 9.Cheng GC, Loree HM, Kamm RD, Fishbein MC, Lee RT. Distribution of circumferential stress in ruptured and stable atherosclerotic lesions, a structural analysis with histopathological correlation. Circulation. 1993;87:1179–1187. doi: 10.1161/01.cir.87.4.1179. [DOI] [PubMed] [Google Scholar]
- 10.Fuster, V. In: The Vulnerable Atherosclerotic Plaque: Understanding, Identification, and Modification, Edited by V. Fuster, J. F. Cornhill, R. E. Dinsmore, J. T. Fallon, W. Insull, P. Libby, S. Nissen, M. E. Rosenfeld, and W. D. Wagner. AHA Monograph Series. Armonk, NY: Futura Publishing, 1998.
- 11.Giddens DP, Zarins CK, Glagov S. The role of fluid mechanics in the localization and detection of atherosclerosis. J Biomech Eng. 1993;115:588–594. doi: 10.1115/1.2895545. [DOI] [PubMed] [Google Scholar]
- 12.Huang H, Virmani R, Younis H, Burke AP, Kamm RD, Lee RT. The impact of calcification on the biomechanical stability of atherosclerotic plaques. Circulation. 2001;103:1051–1056. doi: 10.1161/01.cir.103.8.1051. [DOI] [PubMed] [Google Scholar]
- 13.Humphrey, J. D., Cardiovascular Solid Mechanics. New York: Springer-Verlag, 2002.
- 14.Kaazempur-Mofrad MR, Isasi AG, Younis HF, Chan RC, Hinton DP, Sukhova G, Lamuraglia GM, Lee RT, Kamm RD. Characterization of the atherosclerotic carotid bifurcation using mri, finite element modeling, and histology. Ann Biomed Eng. 2004;32(7):932–946. doi: 10.1023/b:abme.0000032456.16097.e0. [DOI] [PubMed] [Google Scholar]
- 15.Kobayashi, S., D. Tsunoda, Y. Fukuzawa, H. Morikawa, D. Tang, and D. N. Ku. Flow and compression in arterial models of stenosis with lipid core. Proceedings of 2003 ASME Summer Bioengineering Conference, Miami, FL, 497–498, 2003.
- 16.Ku DN. Blood flow in arteries. Annu Rev Fluid Mech. 1997;29:399–434. [Google Scholar]
- 17.Ku DN, Giddens DP, Zarins CK, Glagov S. Pulsatile flow and atherosclerosis in the human carotid bifurcation: Positive correlation between plaque location and low and oscillating shear stress. Arteriosclerosis. 1985;5:293–302. doi: 10.1161/01.atv.5.3.293. [DOI] [PubMed] [Google Scholar]
- 18.Lee RT, Schoen FJ, Loree HM, Lark MW, Libby P. Circumferential stress and matrix metalloproteinase 1 in human coronary atherosclerosis. Implications for plaque rupture. Arterioscler Thromb Vasc Biol. 1996;16:1070–1073. doi: 10.1161/01.atv.16.8.1070. [DOI] [PubMed] [Google Scholar]
- 19.Loree HM, Tobias BJ, Gibson LJ, Kamm RD, Small DM, Lee RT. Mechanical properties of model atherosclerotic lesion lipid pools. Arterioscler Thromb. 1994;14:230–234. doi: 10.1161/01.atv.14.2.230. [DOI] [PubMed] [Google Scholar]
- 20.Loree HM, Kamm RD, Stringfellow RG, Lee RT. Effects of fibrous cap thickness on peak circumferential stress in model atherosclerotic vessels. Circ Res. 1992;71:850–858. doi: 10.1161/01.res.71.4.850. [DOI] [PubMed] [Google Scholar]
- 21.Naghavi M, Libby P, Falk E, Casscells SW, Litovsky S, Rumberger J, Badimon JJ, Stefanadis C, Moreno P, Pasterkamp G, Fayad G, Stone PH, Waxman S, Raggi P, Madjid M, Zarrabi A, Burke A, Yuan C, Fitzgerald PJ, Siscovick DS, de Korte CL, Aikawa M, Juhani Airaksinen KE, Assmann G, Becker CR, Chesebro JH, Farb A, Galis ZS, Jackson C, Jang IK, Koenig W, Lodder RA, March K, Demirovic J, Navab M, Priori SG, Rekhter MD, Bahr R, Grundy SM, Mehran R, Colombo A, Boerwinkle E, Ballantyne C, Insull W, Jr, Schwartz RS, Vogel R, Serruys PW, Hansson GK, Faxon DP, Kaul S, Drexler H, Greenland P, Muller JE, Virmani R, Ridker PM, Zipes DP, Shah PK, Willerson JT. From vulnerable plaque to vulnerable patient: A call for new definitions and risk assessment strategies: Part I. Circulation. 2003;108(14):1664–1672. doi: 10.1161/01.CIR.0000087480.94275.97. [DOI] [PubMed] [Google Scholar]
- 22.Naghavi M, Libby P, Falk E, Casscells SW, Litovsky S, Rumberger J, Badimon JJ, Stefanadis C, Moreno P, Pasterkamp G, Fayad Z, Stone PH, Waxman S, Raggi P, Madjid M, Zarrabi A, Burke A, Yuan C, Fitzgerald PJ, Siscovick DS, de Korte CL, Aikawa M, Juhani Airaksinen KE, Assmann G, Becker CR, Chesebro JH, Farb A, Galis ZS, Jackson C, Jang IK, Koenig W, Lodder RA, March K, Demirovic J, Navab M, Priori SG, Rekhter MD, Bahr R, Grundy SM, Mehran R, Colombo A, Boer-winkle E, Ballantyne C, Insull W, Jr, Schwartz RS, Vogel R, Serruys PW, Hansson GK, Faxon DP, Kaul S, Drexler H, Greenland P, Muller JE, Virmani R, Ridker PM, Zipes DP, Shah PK, Willerson JT. From vulnerable plaque to vulnerable patient: a call for new definitions and risk assessment strategies: Part II. Circulation. 2003;108(15):1772–1778. doi: 10.1161/01.CIR.0000087481.55887.C9. [DOI] [PubMed] [Google Scholar]
- 23.Nerem RM. Vascular fluid mechanics, the arterial wall, and atherosclerosis. J Biomech Eng. 1992;114:274–282. doi: 10.1115/1.2891384. [DOI] [PubMed] [Google Scholar]
- 24.Ohayon J, Teppaz P, Finet GR. In-vivo prediction of human coronary plaque rupture location using intravascular ultrasound and the finite element method. Coron Art Dis. 2001;12:655–663. doi: 10.1097/00019501-200112000-00009. [DOI] [PubMed] [Google Scholar]
- 25.Park JBR, Tobis JM. Spontaneous plaque rupture and thrombus formation in the left main coronary artery documented by intravascular ultrasound. Catheter Cardiovasc Diagn. 1997;40:358–360. doi: 10.1002/(sici)1097-0304(199704)40:4<358::aid-ccd7>3.0.co;2-8. [DOI] [PubMed] [Google Scholar]
- 26.Pedersen, P. C., J. Chakareski, and R. Lara-Montalvo. Ultrasound characterization of arterial wall structures based on integrated backscatter profiles. Proceedings for the 2003 SPIE Medical Imaging Symposium, San Diego, pp. 115–126, 2003.
- 27.Ravn HB, Falk E. Histopathology of plaque rupture. Cardiology Clinics. 1999;17:263–270. doi: 10.1016/s0733-8651(05)70073-4. [DOI] [PubMed] [Google Scholar]
- 28.Ross R. The pathogenesis of atherosclerosis: A perspective for the 1990’s. Nature. 1993;362:801–809. doi: 10.1038/362801a0. [DOI] [PubMed] [Google Scholar]
- 29.Stary HC, Blankenhorn DH, Chandler AB, Glagov S, Insull W, Jr, Richardson M, Rosenfeld ME, Schaffer SA, Schwartz CJ, Wagner WD, Wissler RW. A definition of the intima of human arteries and of its atherosclerosisprone regions. A report from the Committee on Vascular Lesions of the Council on Arteriosclerosis, AHA. Circulation. 1992;85:391–405. doi: 10.1161/01.cir.85.1.391. [DOI] [PubMed] [Google Scholar]
- 30.Stary HC, Chandler AB, Glasov S, Guyton JR, Insull W, Jr, Richardson M, Rosenfeld ME, Schaffer SA, Schwartz CJ, Wagner WD, Wissler RW. A definition of initial, fatty streak and intermediate lesions of atherosclerosis. A report from the Committee on Vascular Lesions of the Council on Arteriosclerosis, AHA. Circulation. 1994;89:2462–2478. doi: 10.1161/01.cir.89.5.2462. [DOI] [PubMed] [Google Scholar]
- 31.Stary HC, Chandler AB, Dinsmore MD, Fuster V, Glagov S, Insull W, Jr, Rosenfeld ME, Schwartz CJ, Wagner WD, Wissler RW. Definitions of advanced types of atherosclerostic lesions and the histological classification of atherosclerosis. A report from the Committee on Vascular Lesions of the Council on Arteriosclerosis, AHA. Circulation. 1995;92:1355–1374. doi: 10.1161/01.cir.92.5.1355. [DOI] [PubMed] [Google Scholar]
- 32.Suri, J. S., and S. Laxminarayan. Angiography and Plaque Imaging. CRC: New York, 2003.
- 33.Tang D, Yang C, Kobayashi S, Ku DN. Steady flow and wall compression in stenotic arteries: A 3-D thick-wall model with fluid-wall interactions. J Biomech Eng. 2001;123:548–557. doi: 10.1115/1.1406036. [DOI] [PubMed] [Google Scholar]
- 34.Tang D, Yang C, Kobayashi S, Ku DN. Simulating cyclic artery compression using a 3-D unsteady model with fluid-structure interactions. Comp Struct. 2002;80:1651–1665. [Google Scholar]
- 35.Tang D, Yang C, Kobayashi S, Ku DN. Effect of a Lipid Pool on Stress/Strain Distributions in Stenotic Arteries: 3D FSI Models. J Biomechanical Engineering. 2004;126:363–370. doi: 10.1115/1.1762898. [DOI] [PubMed] [Google Scholar]
- 36.Tang D, Yang C, Zheng J, Vito RP. Effects of stenosis asymmetry on blood flow and artery compression: A three-dimensional fluid-structure interaction model. Ann Biomed Eng. 2003;31:1182–1193. doi: 10.1114/1.1615577. [DOI] [PubMed] [Google Scholar]
- 37.Tang D, Yang C, Zheng J, Woodard PK, Sicard GA, Saffitz JE, Yuan C. 3D MRI-based multi-component fsi models for atherosclerotic plaques a 3-D FSI model. Ann Biomed Eng. 2004;32(7):947–960. doi: 10.1023/b:abme.0000032457.10191.e0. [DOI] [PubMed] [Google Scholar]
- 38.Tang, D., C. Yang, J. Zheng, P. K. Woodard, J. E. Saffitz, G. A. Sicard, and C. Yuan. In: Computational Solid and Fluid Mechanics, Edited by K. J. Bathe. New York: Elsevier, 2005.
- 39.Williamson SD, Lam Y, Younis HF, Huang H, Patel S, Kaazempur-Mofrad MR, Kamm RD. On the sensitivity of wall stresses in diseased arteries to variable material properties. J Biomech Eng. 2003;125:147–155. doi: 10.1115/1.1537736. [DOI] [PubMed] [Google Scholar]
- 40.Yuan C, Mitsumori LM, Beach KW, Maravilla KR. Special review: Carotid atherosclerotic plaque: Noninvasive MR characterization and identification of vulnerable lesions. Radiology. 2001;221:285–99. doi: 10.1148/radiol.2212001612. [DOI] [PubMed] [Google Scholar]
- 41.Yuan C, Mitsumori LM, Ferguson MS, Polissar NL, Echelard DE, Ortiz G, Small R, Davies JW, Kerwin WS, Hatsukami TS. In vivo accuracy of multispectral MR imaging for identifying lipid-rich necrotic cores and intraplaque hemorrhage in advanced human carotid plaques. Circulation. 2001;104:2051–2056. doi: 10.1161/hc4201.097839. [DOI] [PubMed] [Google Scholar]