

Abstract
Background
Atherosclerotic plaques may rupture without warning and cause acute cardiovascular syndromes such as heart attack and stroke. Methods to assess plaque vulnerability noninvasively and predict possible plaque rupture are urgently needed.
Method
MRI-based three-dimensional unsteady models for human atherosclerotic plaques with multi-component plaque structure and fluid-structure interactions are introduced to perform mechanical analysis for human atherosclerotic plaques.
Results
Stress variations on critical sites such as a thin cap in the plaque can be 300% higher than that at other normal sites. Large calcification block considerably changes stress/strain distributions. Stiffness variations of plaque components (50% reduction or 100% increase) may affect maximal stress values by 20–50 %. Plaque cap erosion causes almost no change on maximal stress level at the cap, but leads to 50% increase in maximal strain value.
Conclusions
Effects caused by atherosclerotic plaque structure, cap thickness and erosion, material properties, and pulsating pressure conditions on stress/strain distributions in the plaque are quantified by extensive computational case studies and parameter evaluations. Computational mechanical analysis has good potential to improve accuracy of plaque vulnerability assessment.
1 Introduction
Cardiovascular disease (CVD) is the number-one killer in the United States and was responsible for 40% of all deaths in 2000 [1]. More than 60% of all myocardial infarction is caused by rupture of a vulnerable plaque. A large number of victims of the disease who are apparently healthy die suddenly without prior symptoms. About 95% of sudden cardiac arrest victims die before reaching the hospital. About 250,000 people a year die of coronary artery disease (CAD) without being hospitalized. Available screening and diagnostic methods are insufficient to identify the victims before the event occurs [2,3]. The mechanisms causing plaque rupture are poorly understood.
The goal of this paper is to introduce a three-dimensional (3D) MRI-based computational model to quantify the effects of the three major controlling factors on stress/strain behaviors in human atherosclerotic plaques: (i) pulsating pressure; (ii) plaque structure; (iii) material properties. Multiple plaque components and fluid-structure interactions (FSI) are included in the model so that it is more realistic and our computational stress/strain analysis may be used for plaque assessment and possible rupture predictions.
Plaque rupture is believed to be related to plaque morphology, mechanical forces, vessel remodeling, blood conditions (cholesterol, sugar, etc.), chemical environment, and lumen surface conditions (inflammation) [4–6]. Some studies indicate that the following appear to be closely associated with plaque ruptures [7–11]: (a) a large atheromatous lipid-rich core; (b) a thin fibrous cap; (c) weakening of the plaque cap, superficial plaque inflammation, and erosion. MRI techniques have been developed to non-invasively quantify plaque size, shape, and components (fibrous, lipid, calcification/inflammation) [12]. Yuan et al. and Cai et al. developed multicontrast techniques to improve the quality of magnetic resonance (MR) images and to better differentiate various components of the plaque [13,14]. Hatsukami et al. reported that high-resolution MRI is capable of distinguishing intact thick fibrous caps from intact thin and disrupted caps in atherosclerotic human carotid arteries in vivo [15]. Attempts of using ultrasound and intravascular ultrasound (IVUS) techniques have been made to quantify vessel motion, mechanical properties, and vessel wall structure, even to predict rupture locations [16–18]. In vivo measurements of mechanical properties of plaque components would be very desirable but few reports can be found in the literature [19]. Vito, Beattie, and Brossollet et al. developed some experimental techniques to determine the finite strain field in heterogeneous, diseased human aortic cross sections at physiological pressures in vitro and derived material parameters for lipid accumulations and disease-free zones [20,21]. Lee, Kamm, Loree, and Cheng et al. measured the dynamic shear moduli of combinations of cholesterol monohydrate crystals, phospholipids, and triglycerides similar to those found in atherosclerotic lesions and performed mechanical analysis seeking implications for plaque rupture [22–25]. In McCord and Ku’s experiments, fresh human artery rings were cyclically bent in a fashion that simulated the passive collapse of an artery which may occur downstream of a stenosis. Their results showed that cyclic bending and compression may cause artery fatigue and plaque rupture [26,27].
Computational simulations for plaque rupture investigation and vulnerability assessment based on MR images have been proposed but are limited to 2D or 3D structure-only or 3D flow-only models due to the complexity of the problem [22,23,25,28–33]. Stroud, Berger, and Saloner used 3D fluid-only models based on an endarterectomy specimen of the plaque in a carotid bifurcation to analyze flow shear stress, vortex, and turbulence behaviors. Kaazempur-Mofrad et al. introduced a 3D MRI-based FSI model for studying the correlations between fluid dynamic parameters and histological markers of atherosclerosis [34]. In vivo MRI data were acquired with in-plane resolution of approximately 0.39 × 0.39 mm. A black-blood spin-echo sequence proton density weighting and fat suppression was used for ECG gated acquisition of 20 slices through the carotid (2 cm below to 2 cm above the carotid bifurcation) which gave slide thickness of 2 mm. That is why plaque components were not included in their 3D model. Further reviews of this multidisciplinary research can be found from Refs. [2,4,5,12].
The current state of the art in clinical practice for patient screening to identify possible vulnerable plaques is primarily based on 2D medical images and experiences of the physicians. Plaque vulnerability should be assessed with morphology and mechanical forces (rupture triggers) taken into consideration [4]. Three-dimensional multicomponent FSI models based on MRI data for real human plaques are still lacking in the literature because (a) 3D plaque images with components are hard to get, especially under in vivo conditions; (b) vessel and plaque component material properties are hard to measure; (c) strong fluid-structure interactions, pulsating pressure, large strain/deformation, complex geometry lead to extremely challenging computational problems; (d) 3D plaque FSI models are highly nonlinear in material properties, geometries, and flow equations. Solving such computational models and identifying critical indicators relevant to plaque rupture are real challenges.
2 Questioning a Popular Hypothesis: Maximal Stress Condition is Related to Plaque Rupture
It is commonly believed that maximal stress conditions may be related to possible plaque rupture and may be used for plaque vulnerability assessment. However, stress distributions in atherosclerotic plaques are affected by many factors which include (but are not limited to) (a) blood pressure which is the driving force of flow and vessel deformation; (b) vessel and plaque geometry, vessel thickness and lumen area are both important. Thicker wall leads to lower stresses. Narrower lumen area reduces the total force the structure receives from the flow; (c) plaque structure, multicomponent structure makes the solid part non-homogeneous; (d) material properties of the vessel and plaque components; (e) flow wall shear stress; (f) axial pre-stretch and residual stresses if imposed. Blood pressure in severely stenosed artery is very nonuniform as indicated by our previous studies [35–38]. At the throat of the plaque (narrowest part of the lumen), pressure is lower (Bernoulli’s effect). In addition to that, the structure wall (which includes vessel and plaque material) is much thicker in the plaque region. Lumen area is reduced. Those factors lead to lower stress in the plaque region. That is why maximal stress was observed at the healthy part of the vessel when the healthy side of the vessel is much thinner than the diseased side [6,38]. On the other hand, adding lipid pool may create a thin layer (plaque cap) between the lipid core and lumen. Maximum stress can be observed there if the cap becomes thin enough. The combination of plaque geometry, vessel thickness, plaque cap thickness, and flow forces (local pressure and shear stress) determines maximal stress and location. The relationship between maximal stress and plaque rupture is really not as well established as commonly believed.
For the above reasons, we turn our attention to “local” maximal stress/strain values and their variations—a local maximum of a function only requires that it is the greatest value in a surrounding neighborhood. Since any global maximum is certainly a local maximum, we are broadening our search when using the local maximum criterion which is justified by the above argument. A “critical site tracking” (CST) approach is used to concentrate on plaque stress/strain behaviors at well-selected critical locations which include locations of local maxima, locations of very thin cap, and any sites of special interest. It is extremely challenging to identify a short list of critical indicators to be used by physicians to assess plaque vulnerability from the vast time-dependent 3D flow and stress/strain data and complex correlations among various factors. The CST approach reduces the full 3D search to the investigation of well-selected sites using local maxima and experience from physicians and pathologists. Stress/strain distributions as well as their variations under pulsating pressure conditions are investigated in this paper using 3D MRI-based multi-component FSI models. Plaque samples with large calcifications and large lipid pools are used to demonstrate effects of plaque components on stress/strain distributions. Cap thickness and material strength are varied to quantify corresponding stress/strain changes. While results reported here are not conclusive in the clinical sense due to lack of available 3D plaque samples, they can be viewed as preliminary feasibility study and should shed some light for further investigations.
3 The 3D MRI-Based Computational Model and Cases Studied
3.1 The Solid and Fluid Models
For the fluid model, the flow is assumed to be laminar, Newtonian, viscous, and incompressible. The incompressible Navier-Stokes equations with arbitrary Lagrangian-Eulerian (ALE) formulation are used as the governing equations which are suitable for FSI problems with frequent mesh adjustments. Both artery vessel material and plaque components in the plaque are assumed to be hyperelastic, isotropic, incompressible, and homogeneous. The 3D nonlinear modified Mooney-Rivlin (MR) model is used to describe the material properties of the vessel wall and plaque components [39–41]. No-slip conditions and natural traction equilibrium conditions are assumed at all interfaces. Putting these together, we have (summation convention is used)
| (1) |
| (2) |
| (3) |
| (4) |
| (5) |
| (6) |
| (7) |
| (8) |
where u and p are fluid velocity and pressure, u g is mesh velocity, Γ stands for vessel inner boundary, f•,j stands for derivative of f with respect to the jth variable, σ is stress tensor (superscripts indicate different materials), ε is strain tensor, v is solid displacement vector. To get the initial stress/strain conditions for the solid models, we start from the zero pressure/zero axial stretch shape of the vessel and apply the pre-axial stretch and initial pressurization to the vessel to specified conditions. 10% axial stretch is applied in this paper. After the stretch, both ends of the vessel are held in axial direction so that it will not be pushed away by the flow. Deformation in other directions is not restricted. No tethering is applied to the vessel. The strain energy function is given by
| (9) |
where I 1 and I 2 are the first and second strain invariants, c i and D i are material constants chosen to match experimental measurements and existing literature [20–24,42]. In this paper, the following values were chosen for the baseline models: vessel material: c 1 =92,000 dyn cm−2, c 2 =0, D 1 =36,000 dyn cm−2, D 2 =2; lipid-rich core: c 1 =5000 dyn cm−2, c 2 =0, D 1 =5000 dyn cm−2, D 2 =1.5; calcification: c 1 =920,000 dyn cm−2, c 2 =0, D 1 =360,000 dyn cm−2, D 2 =2. These parameter values were used in our various case studies unless changed explicitly for parameter evaluation purposes. Further details about the models can be found from Bathe [39–41] and Tang and co-workers [6,38].
3.2 Cases Studied and Fixation Procedures
A 3D MRI data set obtained from a human coronary plaque ex vivo consisting of 36 slices with a relatively high resolution (0.25 × 0.23 × 0.5 mm) and a set obtained from a human carotid plaque ex vivo consisting of 64 2D slices with higher spatial resolution (0.1 × 0.1 × 0.5 mm) were used as the baseline cases to develop the computational model. Specimens were fixed in a 10% buffered formalin solution and placed in a polyethylene tube. They were stored at 4 °C within 12 h after removal from the heart. MRI imaging was taken within 2 days at room temperature. After completion of MR study, the transverse sections with a thickness of 10 μm were obtained at 1-mm intervals from each specimen. These paraffin-embedded sections were stained with hematoxylin and eosin (H&E), Masson’s trichrome, and elastin van Gieson’s (EVG) stains to identify major plaque components: calcification (Ca), lipid rich necrotic core (LRNC), and fibrotic plaques (FP). Plaque vulnerability of these samples was assessed pathologically to serve as a benchmark to validate computational findings.
To perform sensitivity analysis, in vitro stenosis models [38] and computationally generated plaque models with material properties and plaque geometries modified from the real plaques were used in our simulations so that effects of material properties (vessel, calcification, and lipid core), plaque cap thickness, and plaque stenosis severity can be quantified on comparable bases. Each parameter or controlling factor under investigation was varied incrementally within physiological range and eight to ten cases were considered while other parameters and modeling conditions were kept unchanged. More than 100 computational cases were used to perform our sensitivity analysis and quantitative results are reported in Sec. 4.
3.3 3D Re-Construction of Plaque Geometry
3D ex vivo MRI data sets obtained from human atherosclerotic plaques with high resolution were read by a self-developed software package Atherosclerotic Plaque Imaging Analysis (APIA) and 3D plaque geometry and mesh were re-constructed following the procedure described in Tang [6]. A visualization package VTK [43] was also used to read the MRI data and generate the 3D volume for double checking purpose. APIA is written in Matlab (MathWorks, MATLAB, Natick, MA). We first read MR images using Matlab command “IMREAD” to get the intensity function. Then we use “EDGE” command to get the edge which is the boundary for a specific component corresponding to a target intensity value range. If the image is too noisy, we do some “heap” work, i.e., change nearby intensity values of the original MRI data array to the target intensity value range and re-run the edge command. The procedure is repeated until all components are found and the segmented contour plot shows good agreement with histological data. All the segmented 2D slices were then read into ADINA input file, pixel by pixel. Three-dimensional surfaces, volumes, and computational mesh were made under ADINA computing environment. Intensive interactions and additional programming from the operator/researcher were needed due to the complexity of plaque morphology and components. Figure 1 shows 24 MRI slices (selected from a set of 36 slices) of a cadaveric human coronary plaque sample, plaque component contour plots based on histological segmentation data, and the re-constructed 3D geometry. The diameter of the vessel is about 5–6 mm. Some smoothing (third-order spline) was applied to correct numerical and MR artifacts, as well as overly unsmooth spots that affect the convergence of the model. The vessel was extended uniformly at both ends by 3 and 6 cm, respectively, so that it became long enough for our simulations. Geometries of other plaque samples were constructed using the same procedures.
Fig. 1.
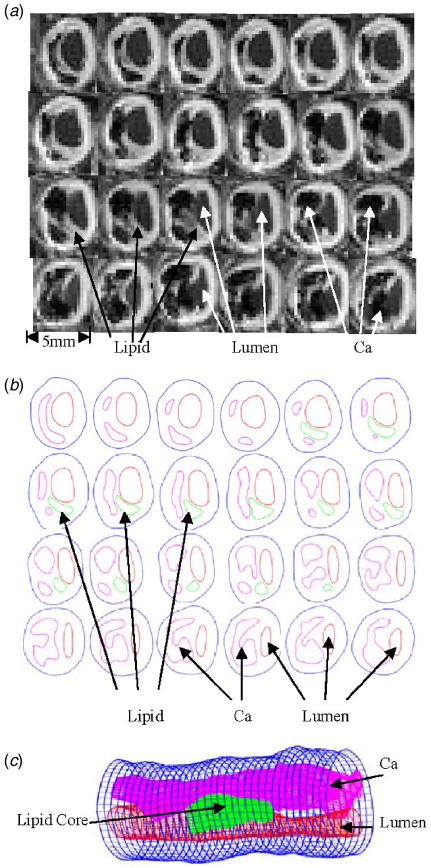
A cadaveric plaque sample with a large calcification block and a lipid pool. (a) Selected MR images from a 36-slice set (S 9 – S 32 are shown here, from left to right, then continued to next row.); (b) component segmentations of MR images based on histological data. Some smoothing was applied; (c) reconstructed 3D plaque geometry. The position of the vessel is rotated for better viewing.
3.4 Solution Method
The fully coupled fluid and structure models were solved by a commercial finite-element package ADINA (ADINA R & D, Inc., Watertown, MA, USA) which has been tested by many real-life applications [40,41] and has been used by Tang in the last several years [6,35–38]. ADINA uses unstructured finite element methods for both fluid and solid models. Nonlinear incremental iterative procedures are used to handle fluid-structure interactions. The governing finite element equations for both the solid and fluid models were solved by Newton-Raphson iteration method. Proper mesh was chosen to fit the shape of each component, the vessel, and the fluid domain. Finer mesh was used for thin plaque cap and components with sharp angles to get better resolution and handle high stress concentration behaviors. The artery was stretched axially and pressurized gradually to specified conditions before we began the unsteady simulation under pulsating pressure conditions. Mesh analysis was performed until differences between solutions from two consecutive meshes were negligible (less than 1% in L 2-norm). Details of the computational models and solution methods can be found from Bathe [39,40] and Tang and co-workers [6,35–38].
One major difficulty for 3D models with complex geometries is mesh generation, which is also the key to get any finite element model to work. Fluid-structure interactions require frequent updates of the computing domain for both fluid and structure models. That leads to mesh adjustment each time the geometries are updated. Our FSI plaque models involve large strain and large deformation which makes mesh generation even harder. That is not all. Adding more plaque components in the artery wall makes the structure model more complicated. Our basic approach to resolve these difficulties is to cut the structure geometry into many small volumes until we reach a convergent model. This requires a lot of hard work and experience. Currently we are trying to automate the entire procedure and reduce the amount of work required from the operator.
4 Results
Since real human atherosclerotic plaques vary from person to person and different models can also lead to large differences in computational outcome, results from our baseline model are reported first so that we can have a common base (benchmark) for further comparative studies. Stress/strain behaviors corresponding to pulsating pressure, plaque structure, and plaque material properties are investigated. Results concerning flow behaviors are much better known in the literature and are not included in our report [31,33,34,44–47].
4.1 Baseline Results
A coronary plaque with a large calcification block and a lipid core was selected as the baseline example to demonstrate that large plaque components have considerable effects on stress/strain behaviors (see Fig. 1). The plaque has a large calcification which occupies about 30% volume of the plaque, a smaller lipid-rich necrotic core (called lipid core hereafter), offering reasonable complexity as desired. The plaque severity by area (reduction of lumen area compared to healthy portion of the vessel) is about 71%. Boundary conditions for the baseline model were set as follows: Pulsating upstream pressure P in=90–150 mm Hg, downstream pressure P out=89.5–126 were chosen to represent a typical high-pressure case (see Fig. 2). Corresponding flow rate is between 2 and 15 ml s−1 and is given by Fig. 2(b). A 10% axial pre-stretch was applied.
Fig. 2.
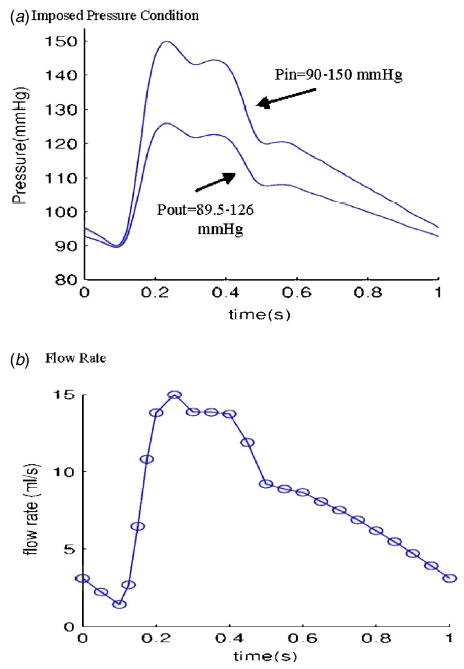
Prescribed pressure condition for the baseline model and corresponding flow rate. (a) A typical pressure profile for human internal carotid is scaled to 90–150 mm Hg and used as the upstream pressure (P in). Down stream pressure is chosen so that flow rate will be within physiological range; (b) flow rate corresponding to the prescribed pressure conditions. It should be noted that this pressure-flow rate data is for a free-standing model such as the model presented in this paper. Realistic coronary flow rate will be affected by heart motion and contraction and will be different from the curve given here.
The entire 3D computational fluid and structure domains were searched (by examining numerically cut serial sagittal and axial slices) for critical stress/strain values and patterns. Band plots of stress distributions of several components on one sagittal cut and several cross-sectional cuts at the time when P in=150 mm Hg and P out=126 mm Hg condition are given by Fig. 3, respectively. Figure 3(a) shows the position of the cut, and also gives stress-P 1 (maximum principal stress) on the whole sagittal cut showing a maximum value located in the calcified region. Figure 3(b) gives band plot of stress-yy (circumferential tensile stress) showing maximum located at a healthy part of the vessel because vessel is thin there. Figure 3(c) shows band plot of stress-zz, tensile stress in the axial direction. All the band plots show that minima of those stress components are found where the vessel wall is thick, i.e., stress level is lower where plaque is more severe. That deserves further investigation.
Fig. 3.
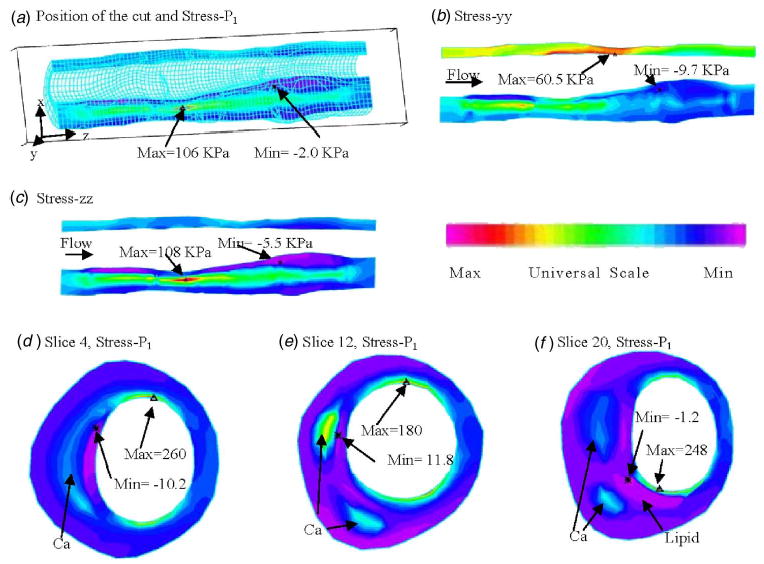
Band plots of selected stress components from the 3D FSI baseline model on a sagittal slice and three cross-section cuts showing that the large calcification block has considerable effect on stress distributions. P in =150 mm Hg, P out =126 mm Hg, axial stretch=10%. (a) Position of the cut and band plot of stress-P 1 showing calcification has higher stress level. Stress maximum occurred at a location where vessel wall is thin; (b) band plot of circumferential stress distribution. Maximum is found at the healthy side of the vessel (vessel is thin there); (c) band plot of longitudinal tensile stress; (d) stress-P 1 on slice 4; (e) stress-P 1 on slice 12; (f) stress-P 1 on slice 20.
Figures 3(d)–3(f) give band plots of stress-P 1 on three selected cross-section cuts: slice 4 has only one calcified region; slice 12 has two calcifications; slice 20 has two calcifications and a lipid core. A maximum is observed at the thin cap of the lipid core from Fig. 3(f). It is also clear that the calcification has considerable effect on stress distributions, especially when it becomes the main support of the plaque structure.
4.2 Unsteady Stress/Strain Behaviors at Critical Sites under Pulsating Pressure
Blood flow is pulsatile. Blood vessel and atherosclerotic plaque are subjected to strong pulsating pressure conditions and the corresponding stress/strain behaviors are worthy investigating. We hypothesize that relative stress/strain variations in the plaque under pulsating pressure may correlate with plaque rupture risk. Since unsteady 3D stress/strain (both are tensors, each has six components) behaviors are extremely complex, and plaque structure is adding difficulty to the investigation, we use a “critical site tracking” approach to perform our initial analysis. Using the plaque sample given by Fig. 1 and pressure conditions given by Fig. 2, several critical sites were selected from various locations to observe stress/strain variations under various conditions (Fig. 4). Plots of stress-P 1 and stress-xy (shear component) from one cardiac cycle at six selected locations are given by Fig. 5 which shows that stress at the thin cap location (P 4) has much greater (>400%) variation than that at other locations. These initial results indicate that stress/strain variations do carry useful information. However, they must be examined carefully, and plaque structure, cap thickness, component size, and shape must be taken into consideration. Relevance of these findings with respect to plaque vulnerability needs to be established using histopathological and clinical data.
Fig. 4.
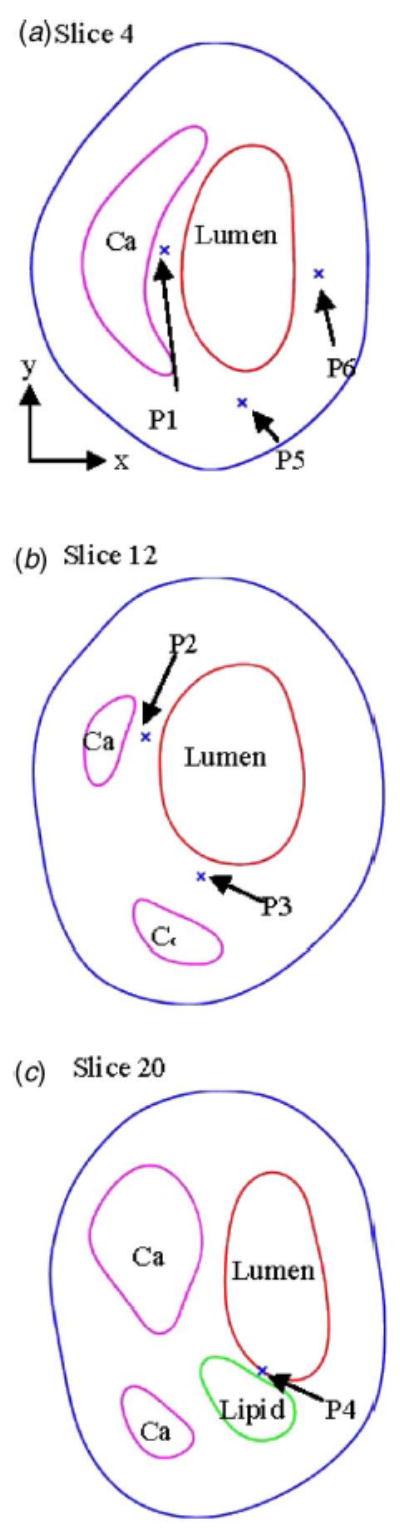
Normal and critical sites are selected to track stress/strain variations. P 1: from calcification cap; P 2: from a thicker Ca cap; P 3: from a thicker Ca cap; P 4: from a thin lipid core cap (most vulnerable site); P 5: normal point to observe stress- xx ; P 6: normal point to observe stress-yy . (a)–(c) give locations of the six points and three slices from the plaque sample (Fig. 1).
Fig. 5.
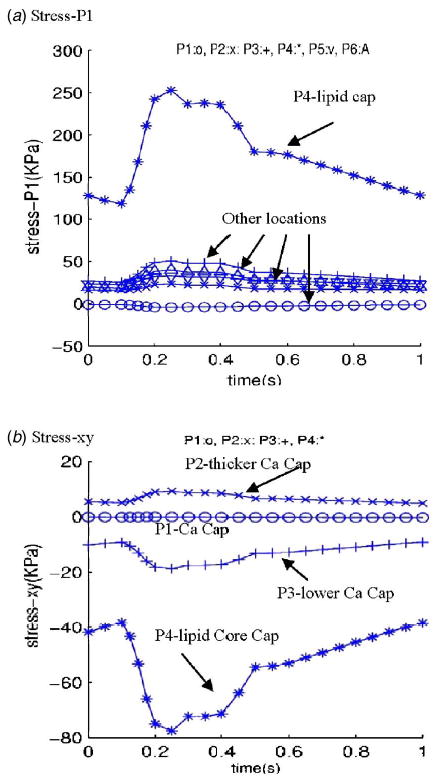
Tracking of stress components at selected locations under pulsating pressure showing critical point from the thin lipid cap has much greater stress variations. (a) Stress-P 1 plots showing stress variation at the thin lipid core cap is much higher (400%) than that at other locations; (b) stress-xy (shear stress) plots also show that shear stress variation at the thin lipid core cap is much higher (400%) than that at other locations.
4.3 More Severe Stenosis Leads to Lower Plaque Stress Level
To investigate and demonstrate this important stress behavior further, simulations were carried out using two sets of models: one constructed from a real human carotid plaque, and one based on a series of in vitro stenosis models used in our previous publications [4,22]. Figure 6(a) gives the geometry of a human carotid plaque re-constructed from MR images. The stenosis severity of this plaque is about 40% by diameter. Stenosis severity by diameter (all stenosis severities referred to in this paper are by diameter) is defined as
Fig. 6.
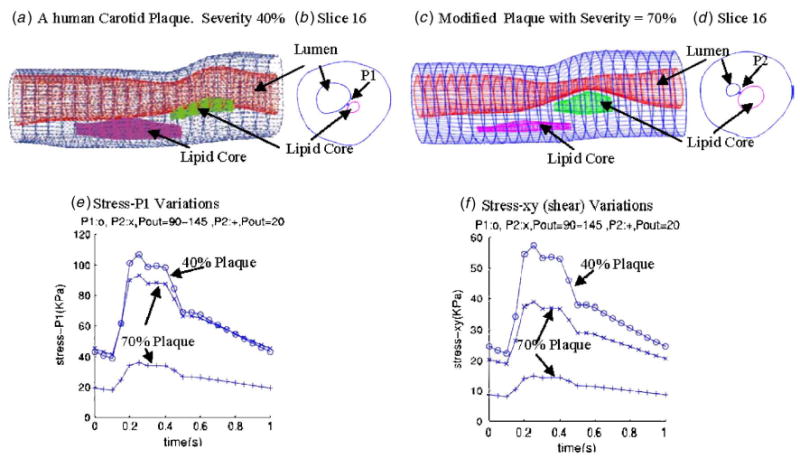
Plaque with higher stenosis severity has lower stress variations. Three cases were simulated. Case 1: A human carotid plaque with 40% stenosis severity (by diameter), P in =90–150 mm Hg as given by Fig. 3, P out =90–145; case 2: A modified plaque with 70% stenosis severity (by diameter), pressure: same as case 1; case 3: Same plaque as in case 2, P in =90–150 mm Hg, P out =20 mm Hg so that flow rate is about the same as in case 1. Axial stretch=10% for all three cases. Tracking locations are indicated in (b) and (d).
| (10) |
where D normal and D throat are inner diameters of the vessel at normal position and the stenosis throat, respecitively (Fig. 7). Figure 6(c) gives the geometry of a plaque modified from the real plaque so that plaque stenosis severity becomes about 70% by diameter, with other conditions and parameters kept the same so that results can be comparable. Two locations as indicated by P 1 and P 2 are selected to track stress/strain variations (see Figs. 6(b) and 6(d)). Three cases were simulated. Upstream pressure was set using P in=90–150 mm Hg as shown by Fig. 2. Case 1 uses 40% plaque sample with prescribed down stream pressure P out =90–145 mm Hg. The corresponding flow rate is between 1.74 and 21.08 ml s−1. Case 2 is for the modified 70% plaque with the same pressure conditions as in case 1. Flow rate for this case became 0.2–4.4 ml s−1 due to increased severity. Case 3 is for the modified 70% plaque with downstream pressure fixed at 20 mm Hg. Flow rate for this case became 8.65–14.16 ml s−1, closer to that in case 1. Stress variations (stress-P 1 and stress-xy) for the three cases are given by Figs. 6(e) and 6(f). Stress-P 1 peak value from case 1 is about 200% higher than those from case 3. Differences of stress-xy peak values between the two cases are even greater (about 300%). Differences of stress peak values between case 1 and case 2 are about 20–50 % where pressure conditions are the same for both cases.
Fig. 7.
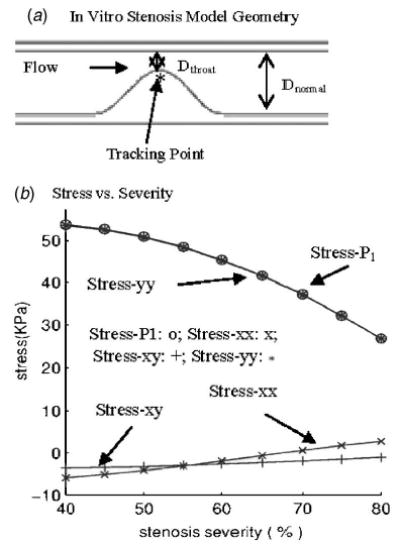
Simulations using in vitro models indicate that higher stenosis severity leads to lower stress variations. Nine cases were simulated with severity changed from 40% to 80% incrementally. Tube inner diameter = 8 mm, tube wall thickness (straight part) = 1 mm, tube length= 140 mm, stenosis length= 16 mm, P in =150, P out =145(mm Hg). (a) The in vitro stenosis model and location of tracking point; (b Stress components at the tracking point versus stenosis severity.
To simplify the problem a little further so that more quantitative results can be obtained, a series of simulations based on in vitro stenosis models was conducted and stress/strain values were tracked at a critical site (see Fig. 7) to find the correlation between stress/strain behaviors and stenosis severity variations. Figure 7 gives the geometry of the stenosis model and plots of stress components at the tracking point from nine severity cases ranging from 40% to 80% (by diameter), with 5% incremental change for each case. Upstream and downstream pressures were 150 and 145 mm Hg, respectively, and were kept the same for all the nine cases. As stenosis severity was reduced from 80% to 40%, stress-P 1 increased by about 100% (from 26 to 54 KPa). This result may be helpful when we try to understand that a large percentage of patients who experienced stroke or heart attack had only mild to moderate stenosis.
4.4 Plaque Lipid Core Cap and Location of Maximal Stresses
It is known that lipid core and its cap thickness have considerable effect on stress distributions and extreme stress locations. Plaque rupture becomes more likely when plaque cap becomes very thin (cap thickness < 0.065 mm) [2–5] . We choose the 70% plaque (Fig. 6(c)) for this case study. Figures 8(a) and 8(b) show band plots of stress-P 1 on a sagittal cut of the vessel with cap thickness 0.8 and 0.02 mm, respectively. Maximal stress-P 1 appeared at the thin (healthy) side (see Fig. 8(a)) when cap thickness was greater than 0.04 mm and moved to the cap site when the cap was adjusted thinner (Fig. 8(b)). Figure 8(c) presents stress values at the tracking point P 1 (indicated by Fig. 6(d)) for 11 cases with cap thickness adjusted incrementally from 0.42 to 0.02 mm. Stress-P 1 values increased about 100% corresponding to the cap thickness variations. Other stress components showed similar patterns.
Fig. 8.
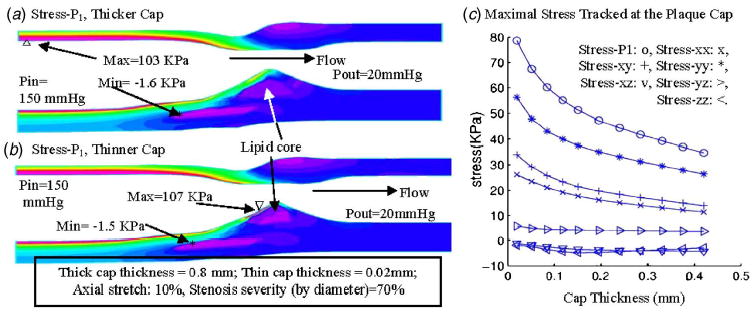
Thinner plaque cap leads to higher stress level: quantitative study. (a) Stress-P 1 in plaque with thicker cap; (b) maximum of stress- P 1 appeared at the plaque cap when cap thickness was reduced to 0.02 mm; (c) maximal values of stress-P 1 increases almost exponentially when cap thickness decreases. Eleven cases were simulated using the 70% modified plaque sample with cap thickness adjusted incrementally from 0.02 to 0.42 mm. P in =90–150 mm Hg, P out =20 mm Hg. Only the stress values at P in =150 mm Hg are shown.
4.5 Plaque Cap Erosion
Cap erosion and inflammation weaken vessel surface (plaque cap) and may lead to large strain variations. Using the plaque given by Fig. 6, we made half (in cap thickness) of plaque cap softer to represent cap erosion (stiffness was reduced by 50%). For the plaque with cap erosion, maximal stress value changed less than 1% (figure not shown), Fig. 9 shows that maximum of maximal principal strain (strain-P 1) increased about 50% due to the cap weakening. Cap erosion and inflammation are closely related to plaque rupture risk and our results are confirming that.
Fig. 9.
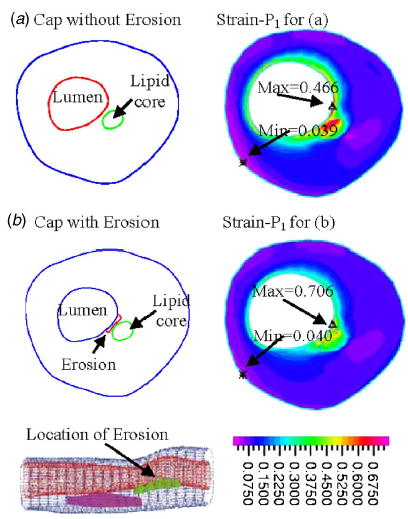
Plaque cap erosion/weakening causes large strain increase. Maximal principal stress showed very little change (figure not shown). However, maximum of strain-P 1 (maximal principal strain) increased about 50% when half of the cap was made 50% softer.
4.6 Effect of Material Properties of Vessel and Plaque Components on Stress Behaviors
Using the plaque sample given by Fig. 1, starting from the material parameters used in the baseline model, material parameters for vessel, calcification, and lipid-rich core were varied (changing one material parameter while holding the other two unchanged) incrementally within a specified range and stress-P 1 values from three selected points are plotted in Fig. 10. P 1 was chosen from a calcification cap location, P 4 was chosen from a lipid core cap location, and P 6 was chosen from a “normal” (healthy) location. Stress-P 1 at the lipid cap increased by about 50% with a 50% vessel stiffness decrease, decreased 6% with 100% calcification stiffness increase, and increased by 22% with 50% lipid core stiffness decrease. Changes at the other two locations are much less noticeable. Table 1 gives more information for maximal values of all the stress tensor components from two cross-section cut slices for several cases. Percentage differences are much higher when individual components are examined. Our quantitative study indicates that obtaining accurate material property information is important for the accuracy of computational simulations. Plaque structure and component size are important factors. Direct measurements of vessel and plaque mechanical properties will be very desirable and will improve accuracy and reliability of computational findings.
Fig. 10.
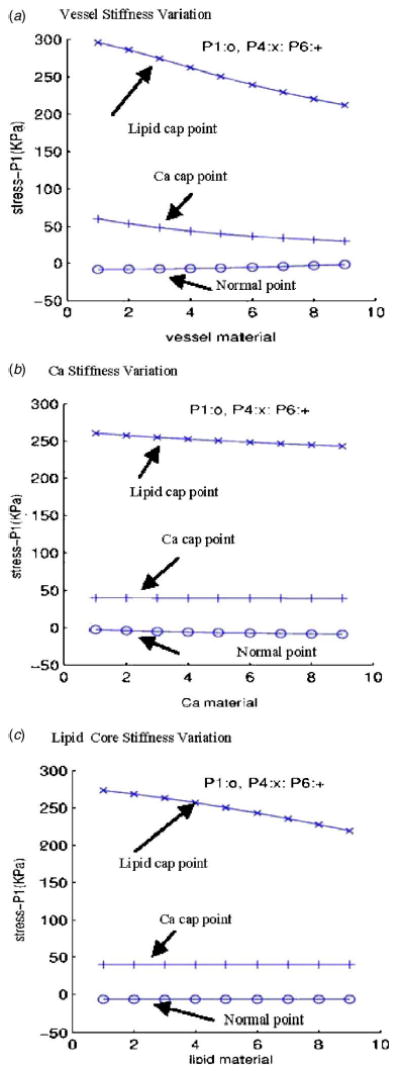
Plots of stress-P 1 at three selected points with different material parameters showing that material properties have considerable effect on stress distributions. For each material, material parameters in the Mooney-Rivlin model for that material were changed incrementally while parameters for the other two materials remained unchanged; nine cases were computed with case 1 being the softest and case 9 being the stiffest. Other boundary conditions: P in =150 mm Hg, P out =126 mm Hg, axial - stretch=10%. (a) Vessel stiffness variations: c 1 =60,000–124,000; D 1 =20,000–52,000; D 2 =1.6–2.4; Ca and lipid used baseline values; (b) Ca stiffness variations: c 1 =600,000–1,240,000; D 1 =200,000–520,000; D 2 =1.6–2.4; vessel and lipid used baseline values; (c) lipid core stiffness variations: c 1 =3400–6600; D 1 =3400–6600; D 2 =1.1–1.9; vessel and Ca used baseline values.
Table 1.
Maximum values of stress tensor componets (unit: KPa) from slices 4 and 20 of the large calcification plaque sample. Cases 1–4 are results from slice 20. Case 5 uses slice 4 because it does not contain lipid pool. Case 1: baseline material, 5% stretch; case 2: softer vessel; case 3: stiffer vessel; case 4: baseline material, 10% stretch; case 5: S 4, baseline, no lipid.
| Cases | S-P1 | S-xx | S-xy | S-xz | S-yy | S-yz | S-zz |
|---|---|---|---|---|---|---|---|
| Case 1 | 245 | 231 | 161 | 3.3 | 150 | 11.2 | 79.3 |
| Case 2 | 373 | 355 | 266 | 4.9 | 288 | 16.0 | 94 |
| Case 3 | 187 | 172 | 85 | 3.6 | 75 | 9.4 | 69.4 |
| Case 4 | 247 | 229 | 161 | 4.4 | 146 | 13.9 | 107 |
| Case 5 | 259 | 241 | 82 | 6.0 | 51 | 6.4 | 51 |
5 Discussion
5.1 Model Assumptions and Limitations
As complicated as our model is, many important factors are still not included in the current model and could be added in the future for further improvements: (a) multilayered vessel structure; (b) anisotropic properties of the vessel; (c) viscoelastic properties of the vessel; (d) vessel inner surface condition, inflammation; (e) residual stress; (f) blood conditions, cholesterol, chemical environment; (g) cell activities, plaque progression and remodeling; (h) non-Newtonian flow properties; (i) turbulence. It is important to keep those model limitations in mind when interpreting computational findings from our models.
Compared to the MRI-based plaque models in the current literature, we are adding fluid-structure interactions and 3D multi-component plaque structures into the model. Another difference is that our focus is more on the stress/strain analysis side because we believe plaque rupture is more directly related to structural forces. After all, it is the plaque that will rupture. Flow forces are important contributing factors, more so for plaque initiation and progression phases. They are also much better studied [33,34,44–47].
Our current model is more of a “free standing” model in the sense that both carotid and coronary arteries are modeled as standing-alone pieces, with only axial stretch applied. While this is commonly done by many researchers and it is also acceptable for carotid arteries, we need to be aware that we are omitting important factors for coronary arteries where cardiac motion and heart contraction play important roles. The pressure and flow rate conditions will need to be revised when cardiac motion and heart contraction are added to the model. Considerable effort is needed to acquire in vivo pressure conditions and coronary plaque images with acceptable resolution. Modeling cardiac motion and contraction also requires major changes in the model and multiyear effort to implement. Those will be our future research goals. One small calming factor which gives partial justification for the use of the pressure conditions given by Fig. 2 is that severely diseased arteries are much stiffer than normal arteries and are less affected by heart contraction [48]. However, this is a very weak justification. The limitations of our model should be kept in mind when interpreting our computational findings. They are still of predictive value when used in relative sense: all plaques are subjected to the same model assumptions and limitations.
5.2 Gold Standard for Validation of Computational Findings
Histopathological analysis is currently regarded as the “gold standard” for validations of computational findings. For patients who had stroke or heart attack, major changes already happened in the plaques when they were removed for study. It would be very desirable to track those vulnerable patients at a much earlier time. Then the data obtained from the long-term tracking (especially data obtained close to the fatal event) together with the actual occurring rate of heart attack and stroke can serve as a better “gold standard” for predictive research. Cardiovascular disease progression takes a long time (multiple years starting from the time the patient first notices some symptoms) which makes long-term tracking even harder for researchers. It will be desirable to have long-term patient tracking data to serve as the “gold standard” when it becomes available.
5.3 Sensitivity Analysis and Critical Site Tracking Approach
One difficulty for our plaque stress/strain analysis is that a huge amount of data needs to be analyzed in order to find correlations between the data we can collect, measure, or calculate and the endpoint indicators based on which we hope to make predictions. The list of controlling factors consists of plaque and vessel morphological features, material properties (including vessel and plaque components), flow environment, modeling assumptions, and many others. Stress/strain solutions (excluding flow quantities) consist of 12 components, all time dependent, 3D with complex structures. To reduce the number of controlling factors, our simulation schemes were designed so that one factor was varied incrementally while other conditions were kept unchanged. This may sound like an oversimplification of the problem. However, it does help us to obtain some simple quantitative results. These single-factor results will be helpful for our further multifactor analysis when all samples are from real patients and various factors will jointly affect the stress/strain behaviors. To reduce the amount of data we need to examine, the CST approach is proposed (see Sec. 1, last paragraph). Rather than searching over the entire 3D domain, we examine only those critical sites which cover all possible rupture candidates. Again, it may sound like an over-reduction of data examined. However, this approach will allow doctors and experienced researchers to use their judgment to select those critical sites so that quantitative analysis becomes possible. Site selection criteria could be gradually established and eventually lead to identification of potential high-risk rupture sites, which is the final goal of this research.
6 Conclusion
Three-dimensional multicomponent FSI models were used to quantify effects of major controlling factors on stress/strain behaviors in human coronary and carotid atherosclerotic plaques. Our sensitivity analysis and critical site tracking analysis indicate that vessel and plaque material properties, plaque structure, component volume and pressure conditions have large impact on stress/strain behaviors. Considerably higher stress/strain variations under pulsating pressure are observed at thin plaque cap. 50% material stiffness variations of vessel and plaque components lead to 20–50 % changes in stress maximal level. Plaque cap weakening leads to large strain increase (50%), but not much change in stress level. More severe stenosis may lead to lower stress levels. Large scale patient studies are needed to identify and validate potential stress/strain risk indicators for plaque vulnerability assessment.
Acknowledgments
This research was supported in part by NSF Grant No. DMS-0072873 and an NIH Grant No. NIH/NIBIB, 1 R01 EB004759 as part of the NSF/NIH Collaborative Research in Computational Neuroscience Program. J. Zheng was supported in part by Charles E. Culpeper Biomedical Pilot initiative Grant No. 01-273. The authors would like to thank Professor Roger D. Kamm (MIT) for his professional advice and helpful discussion in this research.
Footnotes
Contributed by the Bioengineering Division of ASME for publication in the Journal of Biomechanical Engineering. Manuscript received by the Bioengineering Division October 22, 2004; revision received July 7, 2005. Associate editor: Jay D. Humphrey.
References
- 1.American Heart Association, 2003, Heart Disease and Stroke Statistics–2003 Update Dallas, Tex. American Heart Association.
- 2.Naghavi M, Libby P, Falk E, Casscells SW, Litovsky S, Rumberger J, Badimon JJ, Stefanadis C, Moreno P, Pasterkamp G, Fayad Z, Stone PH, Waxman S, Raggi P, Madjid M, Zarrabi A, Burke A, Yuan C, Fitzgerald PJ, Siscovick DS, de Korte CL, Aikawa M, Juhani Airaksinen KE, Assmann G, Becker CR, Chesebro JH, Farb A, Galis ZS, Jackson C, Jang IK, Koenig W, Lodder RA, March K, Demirovic J, Navab M, Priori SG, Rekhter MD, Bahr R, Grundy SM, Mehran R, Colombo A, Boerwinkle E, Ballantyne C, Insull W, Jr, Schwartz RS, Vogel R, Serruys PW, Hansson GK, Faxon DP, Kaul S, Drexler H, Greenland P, Muller JE, Virmani R, Ridker PM, Zipes DP, Shah PK, Willerson JT. “From Vulnerable Plaque to Vulnerable Patient: A Call for New Definitions and Risk Assessment Strategies: Part I,”. Circulation. 2003;108(14):1664–1672. doi: 10.1161/01.CIR.0000087480.94275.97. [DOI] [PubMed] [Google Scholar]
- 3.Naghavi, M., et al., (same as Ref. [2]), 2003, “From Vulnerable Plaque to Vulnerable Patient: A Call for New Definitions and Risk Assessment Strategies: Part II,” Circulation, 108(15), pp. 1772–1778. [DOI] [PubMed]
- 4.The Vulnerable Atherosclerotic Plaque: Understanding, Identification, and Modification, V. Fuster, J. F. Cornhill, R. E. Dinsmore, J. T. Fallon, W. Insull, P. Libby, S. Nissen, M. E. Rosenfeld, and W. D. Wagner, eds., AHA Monograph series, 1998, Futura Publishing, Armonk, NY.
- 5.Humphrey, J. D., 2002, Cardiovascular Solid Mechanics, Springer-Verlag, NY.
- 6.Tang D, Yang C, Zheng J, Woodard OK, Sicard GA, Saffitz JE, Yuan C. “3D MRI-Based Multi-Component FSI Models for Atherosclerotic Plaques: A 3-D FSI model,”. Ann Biomed Eng. 2004;32(7):947–960. doi: 10.1023/b:abme.0000032457.10191.e0. [DOI] [PubMed] [Google Scholar]
- 7.Bock RW, Gray-Weale AC, Mock FP, Stats MA, Robinson DA, Irwig L, Lusby RJ. “The Natural History of Asymptomatic Carotid Artery Disease,”. J Vasc Surg. 1993;17:160–171. doi: 10.1067/mva.1993.43142. [DOI] [PubMed] [Google Scholar]
- 8.Boyle JJ. “Association of Coronary Plaque Rupture and Atherosclerotic Inflammation,”. J Pathol. 181:93–99. doi: 10.1002/(SICI)1096-9896(199701)181:1<93::AID-PATH696>3.0.CO;2-H. [DOI] [PubMed] [Google Scholar]
- 9.Corti R, Hutter R, Badimon JJ, Fuster V. “Evolving Concepts in the Triad of Atherosclerosis, Inflammation and Thrombosis,”. J Thromb Thrombolysis. 2004;17(1):35–44. doi: 10.1023/B:THRO.0000036027.39353.70. [DOI] [PubMed] [Google Scholar]
- 10.Ravn HB, Falk E. “Histopathology of Plaque Rupture,”. Cardiol Clin. 1999;17:263–270. doi: 10.1016/s0733-8651(05)70073-4. [DOI] [PubMed] [Google Scholar]
- 11.Staniloae CS, Ambrose JA. “Identification of Vulnerable Atherosclerotic Plaques,”. Expert Rev Cardiovasc Therapy. 2003;1(3):353–365. doi: 10.1586/14779072.1.3.353. [DOI] [PubMed] [Google Scholar]
- 12.Yuan C, Mitsumori LM, Beach KW, Maravilla KR. “Special Review: Carotid Atherosclerotic Plaque: Noninvasive MR Characterization and Identification of Vulnerable Lesions,”. Radiology. 2001;221:285–299. doi: 10.1148/radiol.2212001612. [DOI] [PubMed] [Google Scholar]
- 13.Yuan C, Mitsumori LM, Ferguson MS, Polissar NL, Echelard DE, Ortiz G, Small R, Davies JW, Kerwin WS, Hatsukami TS. “In Vivo Accuracy of Multispectral MR Imaging for Identifying Lipid-Rich Necrotic Cores and Intraplaque Hemorrhage in Advanced Human Carotid Plaques,”. Circulation. 2001;104:2051–2056. doi: 10.1161/hc4201.097839. [DOI] [PubMed] [Google Scholar]
- 14.Cai JM, Hatsukami TS, Ferguson MS, Small R, Polissar NL, Yuan C. “Classification of Human Carotid Atherosclerotic Lesions with In Vivo Multicontrast Magnetic Resonance Imaging,”. Circulation. 2002;106:1368–1373. doi: 10.1161/01.cir.0000028591.44554.f9. [DOI] [PubMed] [Google Scholar]
- 15.Hatsukami TS, Ross R, Polissar NL, Yuan C. “Visualization of Fibrous Cap Thickness and Rupture in Human Atherosclerotic Carotid Plaque In Vivo with High-resolution Magnetic Resonance Imaging,”. Circulation. 2000;102:959–964. doi: 10.1161/01.cir.102.9.959. [DOI] [PubMed] [Google Scholar]
- 16.Ohayon J, Teppaz Pierre, Finet G, Rioufol G. “In-vivo Prediction of Human Coronary Plaque Rupture Location using Intravascular Ultrasound and the Finite Element Method,”. Coron Artery Dis. 2001;12:655–663. doi: 10.1097/00019501-200112000-00009. [DOI] [PubMed] [Google Scholar]
- 17.Park JBR, Tobis JM. “Spontaneous Plaque Rupture and Thrombus Formation in the Left Main Coronary Artery Documented by Intra-vascular Ultrasound,”. Cathet Cardiovasc Diagn. 1997;40:358–360. doi: 10.1002/(sici)1097-0304(199704)40:4<358::aid-ccd7>3.0.co;2-8. [DOI] [PubMed] [Google Scholar]
- 18.Pedersen, P. C., Chakareski, J., and Lara-Montalvo, R., 2003, “Ultrasound Characterization of Arterial Wall Structures based on Integrated Backscatter Profiles,” Proc. for the 2003 SPIE Med Imaging Symposium, San Diego, pp. 115–126.
- 19.Chandran KB, Mun JH, Choi KK, Chen JS, Hamilton A, Nagaraj A, McPherson DD. “A Method for In-vivo Analysis for Regional Arterial Wall Material Property Alterations with Atherosclerosis: Preliminary Results,”. Med Eng Phys. 2003;25:289–298. doi: 10.1016/s1350-4533(02)00224-2. [DOI] [PubMed] [Google Scholar]
- 20.Beattie D, Xu C, Vito RP, Glagov S, Whang MC. “Mechanical Analysis of Heterogeneous, Atherosclerotic Human Aorta,”. ASME J Biomech Eng. 1998;120:602–607. doi: 10.1115/1.2834750. [DOI] [PubMed] [Google Scholar]
- 21.Brossollet LJ, Vito RP. “A New Approach to Mechanical Testing and Modeling of Biological Tissues, with Application to Blood Vessels,”. ASME J Biomech Eng. 1996;118:433–439. doi: 10.1115/1.2796028. [DOI] [PubMed] [Google Scholar]
- 22.Lee RT, Schoen FJ, Loree HM, Lark MW, Libby P. “Circumferential Stress and Matrix Metalloproteinase 1 in Human Coronary Atherosclerosis. Implications for Plaque Rupture,”. Arterioscler, Thromb, Vasc Biol. 1996;16:1070–1073. doi: 10.1161/01.atv.16.8.1070. [DOI] [PubMed] [Google Scholar]
- 23.Loree HM, Kamm RD, Stringfellow RG, Lee RT. “Effects of Fibrous Cap Thickness on Peak Circumferential Stress in Model Atherosclerotic Vessels,”. Circ Res. 1992;71:850–858. doi: 10.1161/01.res.71.4.850. [DOI] [PubMed] [Google Scholar]
- 24.Loree HM, Tobias BJ, Gibson LJ, Kamm RD, Small DM, Lee RT. “Mechanical Properties of Model Atherosclerotic Lesion Lipid Pools,”. Arterioscler Thromb. 1994;14:230–234. doi: 10.1161/01.atv.14.2.230. [DOI] [PubMed] [Google Scholar]
- 25.Cheng GC, Loree HM, Kamm RD, Fishbein MC, Lee RT. “Distribution of Circumferential Stress in Ruptured and Stable Atherosclerotic Lesions, A Structural Analysis with Histopathological Correlation,”. Circulation. 1993;87:1179–1187. doi: 10.1161/01.cir.87.4.1179. [DOI] [PubMed] [Google Scholar]
- 26.McCord, B. N., 1992, “Fatigue of Atherosclerotic Plaque,” Ph.D. thesis, Georgia Institute of Technology.
- 27.McCord, B. N., and Ku, D. N., 1993, “Mechanical Rupture of the Atherosclerostic Plaque Fibrous Cap,” Proceedings of 1993 Bioengineering Conference, Colorado, BED-Vol. 24, pp. 324–327.
- 28.Huang H, Virmani R, Younis H, Burke AP, Kamm RD, Lee RT. “The Impact of Calcification on the Biomechanical Stability of Atherosclerotic Plaques,”. Circulation. 2001;103:1051–1056. doi: 10.1161/01.cir.103.8.1051. [DOI] [PubMed] [Google Scholar]
- 29.Kaazempur-Mofrad MR, Bathe M, Karcher H, Younis HF, Seong HC, Shim EB, Chan RC, Hinton DP, Isasi AG, Upadhyaya A, Powers MJ, Griffith LG, Kamm RD. “Role of Simulation in Understanding Biological Systems,”. Comput Struct. 2003;81:715–726. [Google Scholar]
- 30.Williamson SD, Lam Y, Younis HF, Huang H, Patel S, Kaazempur-Mofrad MR, Kamm RD. “On the Sensitivity of Wall Stresses in Diseased Arteries to Variable Material Properties,”. ASME J Biomech Eng. 2003;125:147–155. doi: 10.1115/1.1537736. [DOI] [PubMed] [Google Scholar]
- 31.Long Q, Xu XY, Bourne M, Griffith TM. “Numerical Study of Blood Flow in an Anatomically Realistic Aortailiac Bifurcation Generated from MRI Data,”. Magn Reson Med. 2000;43:565–576. doi: 10.1002/(sici)1522-2594(200004)43:4<565::aid-mrm11>3.0.co;2-l. [DOI] [PubMed] [Google Scholar]
- 32.Steinman DA, Thomas JB, Ladak HM, Milner JS, Rutt BK, Spence JD. “Reconstruction of Carotid Bifurcation Hemodynamics and Wall Thickness using Computational Fluid Dynamics and MRI,”. Magn Reson Med. 2002;47(1):149–159. doi: 10.1002/mrm.10025. [DOI] [PubMed] [Google Scholar]
- 33.Stroud JS, Berger SA, Saloner D. “Numerical Analysis of Flow through a Severely Stenotic Carotid Artery Bifurcation,”. ASME J Biomech Eng. 2002;124(1):9–20. doi: 10.1115/1.1427042. [DOI] [PubMed] [Google Scholar]
- 34.Kaazempur-Mofrad MR, Isasi AG, Younis HF, Chan RC, Hinton DP, Sukhova G, Lamuraglia GM, Lee RT, Kamm RD. “Characterization of the Atherosclerotic Carotid Bifurcation Using MRI, Finite Element Modeling, and Histology,”. Ann Biomed Eng. 2004;32(7):932–946. doi: 10.1023/b:abme.0000032456.16097.e0. [DOI] [PubMed] [Google Scholar]
- 35.Tang D, Yang C, Kobayashi S, Ku DN. “Steady Flow and Wall Compression in Stenotic Arteries: A 3-D Thick-Wall Model with Fluid-Wall Interactions,”. ASME J Biomech Eng. 2001;123:548–557. doi: 10.1115/1.1406036. [DOI] [PubMed] [Google Scholar]
- 36.Tang D, Yang C, Kobayashi S, Ku DN. “Simulating Cyclic Artery Compression Using a 3-D Unsteady Model with Fluid-Structure Interactions,”. Comput Struct. 2002;80:1651–1665. [Google Scholar]
- 37.Tang D, Yang C, Zheng J, Vito RP. “Effects of Stenosis Asymmetry on Blood Flow and Artery Compression: A Three-Dimensional Fluid-Structure Interaction Model,”. Ann Biomed Eng. 2003;31:1182–1193. doi: 10.1114/1.1615577. [DOI] [PubMed] [Google Scholar]
- 38.Tang D, Yang C, Kobayashi S, Ku DN. “Effect of a Lipid Pool on Stress/Strain Distributions in Stenotic Arteries: 3D FSI Models,”. ASME J Biomech Eng. 2004;126:363–370. doi: 10.1115/1.1762898. [DOI] [PubMed] [Google Scholar]
- 39.Bathe, K. J., 1996, Finite Element Procedures, Prentice-Hall, Englewood Cliffs, NJ.
- 40.Bathe, K. J., 2002, Theory and Modeling Guide, Vols. I & II: ADINA and ADINA-F, ADINA R & D, Inc., Watertown, MA.
- 41.Bathe, K. J., 2002, ADINA Verification Manual, ADINA R&D, Inc., Watertown, MA.
- 42.Kobayashi S, Tsunoda D, Fukuzawa Y, Morikawa H, Tang D, Ku DN. “Flow and Compression in Arterial Models of Stenosis with Lipid Core,”. Proceedings of 2003 ASME Summer Bioengineering Conference. 2003:497–498. [Google Scholar]
- 43.Schroeder, W., Martin, K., Lorensen, B., 1998, The Visualization Toolkit, An Object-Oriented Approach To 3D Graphics, 2nd Edition, Prentice-Hall, Englewood Cliffs, NJ.
- 44.Giddens DP, Zarins CK, Glagov S. “The Role of Fluid Mechanics in the Localization and Detection of Atherosclerosis,”. ASME J Biomech Eng. 1993;115:588–594. doi: 10.1115/1.2895545. [DOI] [PubMed] [Google Scholar]
- 45.Giddens DP, Zarins CK, Glagov S. “Responses of Arteries to Near-Wall Fluid Dynamic Behavior,”. Appl Mech Rev. 1990;43:S98–S102. [Google Scholar]
- 46.Ku DN. “Blood Flow in Arteries,”. Annu Rev Fluid Mech. 1997;29:399–434. [Google Scholar]
- 47.Ku DN, Giddens DP, Zarins CK, Glagov S. “Pulsatile Flow and Atherosclerosis in the Human Carotid Bifurcation: Positive Correlation between Plaque Location and Low and Oscillating Shear Stress,”. Arteriosclerosis (Dallas) 1985;5:293–302. doi: 10.1161/01.atv.5.3.293. [DOI] [PubMed] [Google Scholar]
- 48.Gould, K. L., 1999, Coronary Artery Stenosis and Reversing Atherosclerosis, 2nd Edition, London, Arnold.