Abstract
Cardiac stem cells (CSCs) have been identified in the adult heart, but the microenvironment that protects the slow-cycling, undifferentiated, and self-renewing CSCs remains to be determined. We report that the myocardium possesses interstitial structures with the architectural organization of stem cell niches that harbor long-term BrdU-retaining cells. The recognition of long-term label-retaining cells provides functional evidence of resident CSCs in the myocardium, indicating that the heart is an organ regulated by a stem cell compartment. Cardiac niches contain CSCs and lineage-committed cells, which are connected to supporting cells represented by myocytes and fibroblasts. Connexins and cadherins form gap and adherens junctions at the interface of CSCs–lineage-committed cells and supporting cells. The undifferentiated state of CSCs is coupled with the expression of α4-integrin, which colocalizes with the α2-chain of laminin and fibronectin. CSCs divide symmetrically and asymmetrically, but asymmetric division predominates, and the replicating CSC gives rise to one daughter CSC and one daughter committed cell. By this mechanism of growth kinetics, the pool of primitive CSCs is preserved, and a myocyte progeny is generated together with endothelial and smooth muscle cells. Thus, CSCs regulate myocyte turnover that is heterogeneous across the heart, faster at the apex and atria, and slower at the base–midregion of the ventricle.
The notion that the heart exerts its function until the death of the organism with the same myocytes that are present at birth (1) has been challenged. Activation of cyclins and cyclin-dependent kinases, BrdU incorporation, and expression of Ki67, MCM5, cdc6, and phosphohistone-H3 have been shown in myocytes, together with karyokinesis and cytokinesis (2). The search for the origin of dividing myocytes led to the identification of a population of primitive cells with the characteristics of stem cells (SCs) in humans (3) and animals (4–8). In self-renewing organs, SCs are stored in niches that constitute the microenvironment in which SCs are maintained in a quiescent state (9). After activation, SCs replicate and migrate out of the niches to sites of cell replacement where they differentiate and acquire the adult phenotype. Niche homeostasis is regulated by division of SCs, which preserves the ideal proportion of primitive and committed cells within the organ (9, 10).
Although cardiac SCs (CSCs) have been found, the myocardial structure in which CSCs and early lineage-committed cells (LCCs) are nested together remains to be identified. Similarly, the supporting cells that are intimately connected with the CSCs–LCCs within the niches have not been recognized. This identification is of crucial importance, because CSCs cannot exist in the absence of supporting cells, which anchor SCs to the niche and modulate growth signals, resulting in the formation of a cardiac progeny. These biological variables define whether the heart is capable of significant myocyte regeneration. Asymmetric division of CSCs generates CSCs and LCCs that move out of the niches and replace old, poorly contracting myocytes. Conversely, symmetric division of a CSC gives rise to two CSCs or two LCCs. Although asymmetric division may have a prominent impact on niche homeostasis and myocyte turnover, symmetric division could be involved in emergency situations demanding a rapid formation of CSCs or cardiomyocytes. SC destiny depends on cell fate determinants, which include Numb and α-adaptin (9, 10), whose role in CSCs is unknown.
We have identified the components of cardiac niches and the contribution of CSC symmetric and asymmetric division to heart homeostasis. The functional properties and growth kinetics of CSCs have been defined by BrdU-retaining assays, because the long-term label-retaining property of a cell documents its stemness, while the progressive dilution of the label identifies the formed progeny (11).
Results
CSC Clusters.
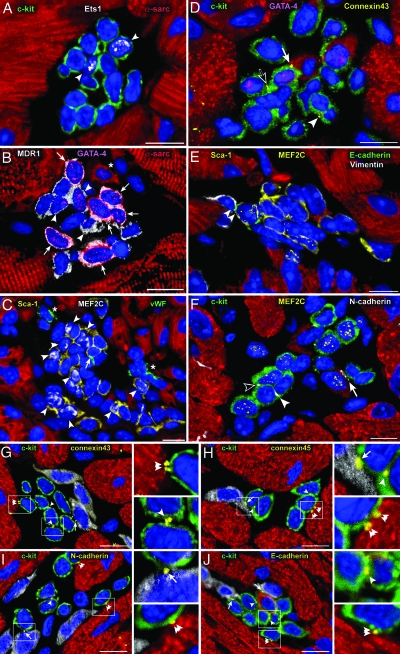
Although a niche can include a single SC, we have directed our search to clusters of CSCs and early LCCs. These nests were present in the atria, base–midregion, and apex, and consisted of lineage-negative (Lin−) c-kit+, MDR1+, or Sca-1+ cells assembled with LCCs. By definition, CSCs exhibit SC antigens (c-kit, MDR1, Sca-1) but do not express transcription factors or membrane and cytoplasmic proteins of cardiac cells (3, 5). Progenitors correspond to cells in which the epitope of stemness coexists with transcription factors indicative of myocytes, endothelial cells (ECs), or smooth muscle cells. Precursors are a step farther in the differentiation process: The cytoplasm contains specific myocyte, EC, or smooth muscle cell proteins. More differentiated cells possess lineage-related nuclear and cytoplasmic proteins in the absence of SC antigens (Fig. 1 A–C). Capillaries were occasionally seen at the periphery of pockets of CSCs–LCCs, which were all CD45-negative (Fig. 6 and Table 1, which are published as supporting information on the PNAS web site). The sporadic and scattered location of capillaries within the niches, together with the absence of hematopoietic cell markers on CSCs, pointed to the non-bone marrow origin of cardiac primitive cells.
Fig. 1.
Cardiac niches and putative supporting cells. Apical (A, B, and F) and atrial (C–E) niches contain CSCs and LCCs. (A) Fourteen c-kit+ cells (green) express Ets1 (white dots) in two nuclei (EC progenitors, arrowheads). (B) Fourteen MDR1+ cells (white) express GATA-4 (magenta dots) in nine nuclei; six of the nine GATA-4+ cells express α-sarcomeric-actin in the cytoplasm (red; myocyte precursors, arrows). Three cells positive for GATA-4 only correspond to cardiac progenitors (arrowheads). One small, developing myocyte is visible (asterisk). Five cells express only MDR1 and are lineage-negative (Lin−) (CSCs). (C) Twenty-three Sca-1+ cells (yellow) express MEF2C (white dots) in 9 nuclei (myocyte progenitors, arrowheads); one Sca-1+ cell is labeled by von Willebrand factor (green; EC precursor, arrowheads). ECs are also present (asterisks). (D–F) Localization of connexin 43 and E- and N-cadherin in niches containing c-kit+ (D and F, green) and Sca-1+ (E, yellow) CSCs and LCCs. CSCs are Lin−; LCCs express GATA-4 (D, magenta-dots) and MEF2C (E and F, yellow dots). Connexin 43 (yellow dots), E-cadherin (green dots), and N-cadherin (white dots) are located between two CSCs (D and F, arrowheads), a CSC and an LCC (F, open arrowhead), an LCC and a fibroblast (E, vimentin, white, double arrowhead), a CSC or an LCC and a myocyte (D and F, arrows), and two LCCs (D, open arrow). (G–J) Connexin 43 and 45 and N- and E-cadherin in atrial niches containing c-kit+ CSCs–LCCs (green) are represented by yellow dots located between two CSCs–LCCs (arrowheads), a CSC–LCC and a fibroblast (arrows), and a CSC–LCC and a myocyte (double arrowheads); see Insets. Nuclei are stained by propidium iodide (blue). (Scale bars, 10 μm.)
Supporting Cells.
Connexin 43 and 45 and N- and E-cadherin were found between two Lin− CSCs, one Lin− CSC and one LCC, or two LCCs. These proteins were also detected between CSCs–LCCs and myocytes and fibroblasts (Fig. 1 D–J). However, they were not observed between CSCs–LCCs and ECs or smooth muscle cells. The expression of connexins and cadherins in isolated c-kit+ CSCs–LCCs was confirmed by Western blotting. The specificity of this protocol was strengthened by the fact that these cell preparations were negative for markers of myocyte differentiation, such as myosin light chain 2v (Fig. 7, which is published as supporting information on the PNAS web site).
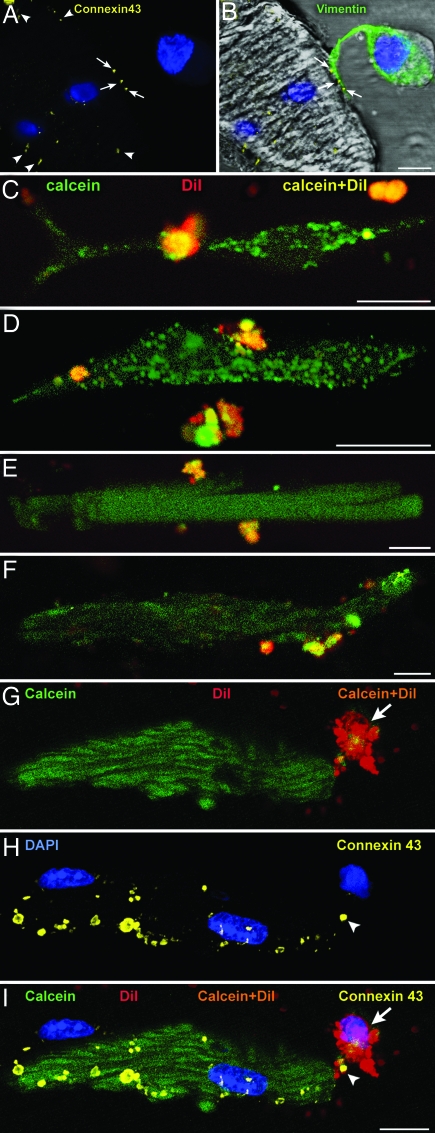
A functional assay was performed to document the role of connexins in the formation of gap junctions between c-kit+ CSCs–LCCs and myocytes, fibroblasts, or ECs. Cell coupling was analyzed in vitro by two-photon microscopy after preincubation and loading of c-kit+ CSCs–LCCs with the green fluorescent dye calcein. The cells were also labeled with the red fluorescent dye 1,1'-dioctadecyl-3,3,3',3'-tetramethylindocarbocyanine, which integrates stably within the cell membrane (12). Labeled c-kit+ CSCs–LCCs (green and red) were plated with unlabeled myocytes, fibroblasts, or ECs. The appearance of green fluorescence in unlabeled cells, in the absence of red fluorescence, indicated the transfer of calcein through the formation of gap junctions. Calcein translocated from c-kit+ CSCs–LCCs to myocytes and fibroblasts but not to ECs, suggesting that myocytes and fibroblasts function as supporting cells. This finding was confirmed by the identification of connexin 43 and 45 between c-kit+ CSCs–LCCs and myocytes and fibroblasts by confocal microscopy (Fig. 2). When the gap junction-blocker heptanol was added to the coculture of c-kit+ CSCs–LCCs and myocytes, calcein transfer did not occur, despite the expression of connexin at the interface of the two cell types (see Figs. 8 and 9, which are published as supporting information on the PNAS web site).
Fig. 2.
Formation of gap junctions. (A and B) Localization of connexin 43 (A, yellow dots, arrows) between the projection of a c-kit+ CSC–LCC (B, vimentin, green) and an unlabeled myocyte (B, vimentin-negative) in culture. Connexin 43 is present in other areas of the myocyte surface (A, arrowheads). (C–F) Two-photon microscopy of c-kit+ CSCs–LCCs loaded with calcein and 1,1'-dioctadecyl-3,3,3',3'-tetramethylindocarbocyanine (yellow fluorescence) and cocultured with unlabeled fibroblasts or unlabeled myocytes. Green fluorescence in fibroblasts (C and D) and myocytes (E and F) demonstrates the translocation of calcein (green) from CSCs–LCCs to fibroblasts and myocytes. (G–I) Two-photon microscopy of a myocyte and adjacent CSC–LCC (G). Calcein–1,1'-dioctadecyl-3,3,3',3'-tetramethylindocarbocyanine (orange) is apparent in the CSC–LCC (arrows) but not in the myocyte, which is calcein+ only (green). The same cells are shown after fixation and staining by confocal microscopy (H). Connexin 43 between the cells is depicted by yellow dots (H and I, arrowheads). (I) Merge of G and H. (Scale bars, 10 μm.)
Integrin Receptors.
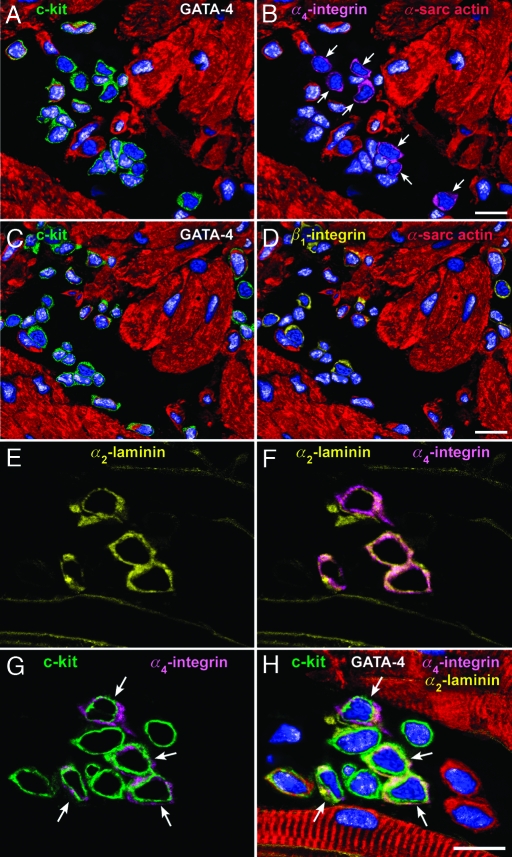
In the niches, α4-integrin defined the plasma membrane of Lin− CSCs; it was not expressed in LCCs (Fig. 3 A and B). β1-integrin was detected in both CSCs and LCCs (Fig. 3 C and D). The α2-chain of laminin paralleled the localization of α4-integrin (Fig. 3 E–H). Laminin-8/9 and -10/11 were present in the niches and myocardium (data not shown). Niches were surrounded by myocytes, but a basal lamina was not observed. Fibronectin accumulated on the surface of Lin− CSCs together with α4-integrin (see Figs. 10 and 11, which are published as supporting information on the PNAS web site). The colocalization of the α2-chain of laminin and fibronectin with α4-integrin was restricted to Lin− CSCs, suggesting that this discrete ligand–receptor interaction was implicated in the preservation of the undifferentiated state of CSCs. In this regard, inhibition of α4-integrin promotes mobilization of bone marrow progenitor cells (13), providing evidence for the critical role of α4-integrin in CSC homeostasis. Also, α4-integrin induces the renewal of hematopoietic SCs (14).
Fig. 3.
Cardiac niches, integrin receptors, and extracellular ligands. Apical (A–D) and atrial (E–H) niches contain integrin subunits and laminin. (A–D) The same niche is illustrated at two distinct levels: One (A and B) and two (C and D). c-kit+ cells (A, green), which do not express GATA-4 in their nuclei (A and B, white dots), possess α4-integrin on the cell surface (B, magenta, arrows). However, c-kit+ cells (C, green), which express or do not express GATA-4 (C and D, white dots) possess β1-integrin (D, yellow). (E–H) The α2-chain of laminin (E, F, and H, yellow) is associated with α4-integrin (F–H, magenta) in four of the nine c-kit+ cells (G and H, green, arrows). The four α2-laminin α4-integrin c-kit+ cells are negative for GATA-4; GATA-4 is present in the other five c-kit+ cells (H, white dots). (Scale bars, 10 μm.)
Cardiac Niches.
Niches were defined as randomly oriented ellipsoid structures constituted by cellular and extracellular components. Fifty niches each were measured in the atria, base–midregion, and apex. The average volume of niches was ≈11,000 μm3. However, atrial niches were ≈2.0-fold larger than ventricular niches. The number of niches per mm3 of atrial and apical myocardium was ≈8-fold higher than at the base–midregion (Fig. 12, which is published as supporting information on the PNAS web site). The number of CSCs–LCCs within atrial niches was higher than in other areas and depended on the size of the niches. Atria and apex were the preferential storage sites of Lin− CSCs (Fig. 12).
Long-Term Label-Retaining Assay.
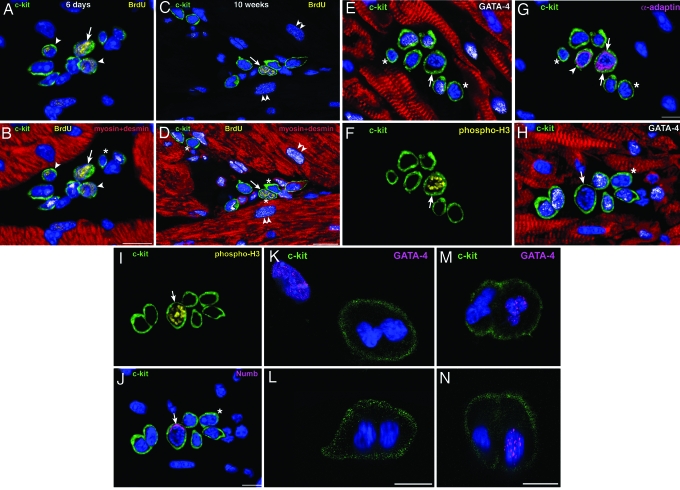
Four and 12 injections of BrdU were performed at 12-hour intervals in two groups of mice over a period of 2 and 6 days, respectively. A third group was treated in an identical manner for 6 days, and animals were killed after a chasing period of 10 weeks. Bright and dim BrdU-labeled Lin− CSCs were distinguished on the basis of fluorescence intensity (Fig. 4 A–D, and see Materials and Methods). The number of bright BrdU-Lin− CSCs in the atrial niches increased 140% from 2 to 6 days but decreased 91% after 10 weeks of chasing. Of 257 bright BrdU-Lin− CSCs at 6 days, only 23 cells retained this characteristic at 10 weeks, constituting the slow-cycling SC pool in this portion of the heart (Fig. 13, which is published as supporting information on the PNAS web site). At the base–midregion and apex, bright BrdU-Lin− CSCs increased 80% and 130% from 2 to 6 days and decreased 88% and 91% after chasing, respectively. Dim BrdU-Lin− CSCs increased from to 2 to 6 days, but, in contrast to bright BrdU-Lin− CSCs, dim BrdU-Lin− CSCs increased dramatically after chasing: 16-fold in the atria, 13-fold at the base–midregion, and 16-fold at the apex (Fig. 13). The aggregate number of Lin− CSCs within the niches did not change over a period of 10 weeks in young mice. Thus, the growth kinetics of Lin− CSCs tends to preserve the pool of primitive cells within the niches. The recognition of long-term label-retaining cells provides functional evidence of resident CSCs in the adult heart.
Fig. 4.
CSC growth in cardiac niches. (A–D) Atrial niches with bright (arrows) and dim (arrowheads) BrdU+ (yellow) c-kit+ cells (green) after 6 days of labeling (A and B illustrate the same field) and 10 weeks of chasing period (C and D illustrate the same field). Niches contain c-kit+ LCCs (transcription factors, white dots; cardiac myosin and desmin, red) and c-kit+Lin− CSCs (B and D, asterisks). (D) Three Lin− CSCs, one of which is BrdU-bright (arrow). Two dim BrdU-labeled myocytes are present (C and D, double arrowheads). (E–G) Atrial niche with seven c-kit+ cells (green), three of which express GATA-4 (E, white dots). One GATA-4−c-kit+ cell (E, arrow) expresses phospho-H3 (F, yellow, arrow) and shows α-adaptin at both poles of the cell (G, magenta, arrows). The nonmitotic α-adaptin+GATA-4− cell may represent a recently formed daughter CSC (G, arrowhead). The two remaining c-kit+GATA-4− cells may correspond to quiescent CSCs (E and G, asterisks). (H–J) Atrial niche with seven c-kit+ cells (green), five of which express GATA-4 (H, white dots). One GATA-4−c-kit+ cell (H, arrow) expresses phospho-H3 (I, yellow) and shows Numb at one pole of the cell (J, magenta, arrow). The remaining c-kit+GATA-4− cell may correspond to a quiescent CSC (H and J, asterisks). (K–N) Two c-kit+ cells (green) in culture at the end of mitosis are illustrated in the xy (K and M) and the xz (L and N) plane. The absence (K and L) and presence (M and N) of GATA-4 (magenta dots) suggest symmetric and asymmetric division, respectively. (Scale bars, 10 μm.)
Division of CSCs.
The long-term label-retaining assay indicated that ≈10% of Lin− CSCs are slow-cycling and conform to the paradigm of SCs. The BrdU pulse/chase protocol, however, did not provide information regarding the pattern of growth at the single SC level. For this purpose, numerous niche profiles were viewed (Table 2, which is published as supporting information on the PNAS web site), and 18, 17, and 20 Lin−c-kit+ CSCs in mitosis were detected in the atria, base-midregion, and apex, respectively. The presence of Numb and α-adaptin at the two poles of cycling CSCs (for symmetric division, see Fig. 4 E–G) and the restricted localization of these proteins at one pole (for asymmetric division, see Fig. 4 H–J) were identified; of the 18 dividing atrial CSCs, 14 were undergoing asymmetric division, and 4 were undergoing symmetric division. Corresponding values at the base–midregion were 10 asymmetric and 7 symmetric and, at the apex, 14 asymmetric and 6 symmetric. Thus, asymmetric division was more prevalent than symmetric division (P < 0.02).
The CSC mitotic index did not vary in the three portions of the heart, and, because of the low frequency of CSC mitosis, it was difficult to establish whether groups of niches were preferentially activated. Similarly, the limited sampling of mitotic CSCs in each cardiac region did not allow us to establish whether this process had a privileged anatomical localization. To obtain additional information about CSC proliferation, c-kit+ cells were cultured in growth medium to promote cell division. On the basis of the compartmentalization of α-adaptin and Numb, symmetric division accounted for 38 ± 7% and asymmetric division for 62 ± 7%. These patterns of cell growth were confirmed by the detection of GATA-4 as a marker of cell commitment (Fig. 4 K–N).
Myocyte Turnover.
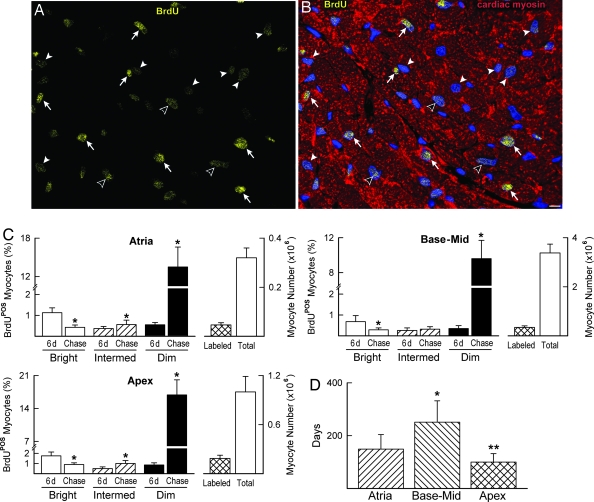
Myocyte formation was assessed by measuring the fraction of BrdU+ cells 6 days after BrdU administration and after 10 weeks of chasing. BrdU-bright myocytes at 10 weeks were cells that experienced a limited number of divisions, whereas more rounds of doublings had to occur in myocytes with intermediate levels of labeling. These myocyte classes were assumed to correspond to amplifying myocytes, which incorporated BrdU at the time of injection and continued to divide and differentiate. Conversely, BrdU-dim myocytes were considered the progeny of cycling CSCs, which became BrdU+ at the time of injection and gave rise to a large number of committed cells. Clusters of BrdU-dim myocytes, together with BrdU-bright myocytes, were observed in the ventricle, whereas a more dispersed pattern of labeling was seen in the atria and apex (Fig. 5 A and B). The percentage of BrdU-bright myocytes detected at 6 days decreased markedly after 10 weeks, whereas BrdU-dim myocytes increased (Fig. 5C).
Fig. 5.
Myocyte turnover and life span. (A and B) Apical section illustrating bright (arrows), intermediate (open arrowheads), and dim (arrowheads) BrdU+ myocyte nuclei (yellow) after 10 weeks of chasing. Myocytes are stained by cardiac myosin (B, red). (Scale bar, 10 μm.) (C) Bars show the percentage of BrdU-bright, -intermediate, and -dim myocyte nuclei after 6-day labeling and after 10-week chasing. (Right) Bars document the total number of BrdU+ myocytes (labeled) and the total number of myocytes in the atria, base–midregion, and apex. ∗, P < 0.05 vs. 6 days. (D) Myocyte half-life. ∗ and ∗∗, P < 0.05 vs. atria and base–midregion, respectively.
The apex had 19% BrdU-labeled myocytes, the atria 15%, and the base–midregion 10%. The BrdU data at 6 days and at 10 weeks provided us with the magnitude of cell turnover in the myocardium (see Materials and Methods). These results were complemented with the measurements of myocyte progenitors–precursors (LCCs) (Table 3, which is published as supporting information on the PNAS web site), which, together with the CSC number, were used to evaluate the half-life of myocytes. Myocytes located at the base–midregion have a half-life 2-fold longer than atrial and apical myocytes, suggesting that myocyte turnover is high (Fig. 5D).
Discussion
The heart typically shows discrete structures in the interstitium where CSCs and LCCs are clustered together, forming cardiac niches. The documentation that SC niches are present in the adult myocardium has been based on the identification of these pockets of CSCs–LCCs and the detection of cell-to-cell contact between CSCs–LCCs and myocytes and fibroblasts. In the heart and other self-renewing organs, SCs are connected structurally and functionally to the supporting cells by junctional and adhesion proteins represented by connexins and cadherins (15). Connexins are gap junction channel proteins that mediate passage of small molecules involved in cell-to-cell communication (16). Cadherins are calcium-dependent transmembrane adhesion molecules, which have a dual function: They anchor SCs to their microenvironment and promote a cross-talk between SCs and between SCs and nurse cells (15). Cardiac niches create the necessary, permissive milieu for the long-term residence, survival, and growth of CSCs.
The arrangement of CSCs–LCCs and supporting cells in the cardiac niches is similar to that found in the bone marrow (17) and brain (18), providing elements of analogy for these organs. In the bone marrow, osteoblasts and stromal cells function as supporting cells (18, 19). They can be considered the equivalent of myocytes and fibroblasts found here in the heart. ECs do not operate as nurse cells in the heart, but ECs are the candidate supporting cells in the brain (20) and may have a comparable role in the bone marrow (21). An uninterrupted basal lamina delimits neural and epithelial niches, but it is not present in the bone marrow (9) or, as shown here, in the heart.
Integrins are adhesion receptors for the attachment of cells to the extracellular proteins fibronectin and laminin (22). β1-Integrin is commonly found on the surface membrane of primitive and committed cells within the niches (23). Fibronectin and the α2-chain of laminin are ligands for α4β1-integrin (23, 24). The colocalization of the α2-chain of laminin and fibronectin with α4-integrin was restricted to Lin− CSCs, suggesting that α4-integrin binding may be typically involved in the preservation of stemness of CSCs. β1-Integrin is highly expressed on the interfollicular SCs of the epidermis (11) and in neural SCs (23), whereas α4-integrin has been linked to the renewal of hematopoietic SCs (14). The α2-chain of laminin is detected in SCs of the skin and intestinal crypts (25) but is not seen in bone marrow SCs (26). Laminin-8/9 and -10/11 are typical components of bone marrow niches (26) but lack this preferential localization in the heart. By inference, in cardiac niches, the α2-chain of laminin and fibronectin transduce mechanical signals from the extracellular compartment to the α4β1-integrin receptor, which activates effector pathways opposing CSC commitment and differentiation.
Homeostasis of cardiac niches is mediated by asymmetric and symmetric division of CSCs. Asymmetric division predominates, and, by this mechanism, CSCs protect their pool and generate a committed progeny. The uniform and nonuniform localization of Numb and α-adaptin, together with the identification of phosphohistone-H3 expression, (3) was determined to define symmetric and asymmetric division, respectively. The intracellular segregation of these proteins at the time of mitosis constitutes the intrinsic determinant of SC fate. Numb and α-adaptin interact to enable primitive cells to produce differently destined sibling cells (27). Numb is expressed from late prophase to telophase and in the early stages of life of the daughter cell (28). Numb localizes to endocytic vesicles, where it binds to the endocytic protein α-adaptin, promoting the internalization and inactivation of the Notch receptor (29). Numb-negative cells retain their responsiveness to Notch and adopt the fate associated with Notch activation (30).
The prevailing inhomogeneous localization of Numb and α-adaptin in cycling CSCs controls the production of daughter cells, which follow divergent paths. The BrdU pulse/chase assay conformed to this pattern of asymmetric CSC division. Over time, the number of CSCs–LCCs confined to the niches remains constant, suggesting that asymmetric kinetics characterizes most of the growth of CSCs in the myocardium. This mechanism of cell renewal has been described as “invariant” (11), and it typically occurs in an organ in a steady state. Pathological conditions, including ischemia-reperfusion injury lead to the formation of reactive oxygen species. Oxidative stress triggers distinct cellular responses; low levels initiate growth, intermediate degrees promote apoptosis, and high magnitudes mediate cell necrosis (31). Whether CSCs–LCCs within the niches react to the oxidative challenge in a similar manner is a critical, unanswered question.
Materials and Methods
Hearts of FVB/N mice at 3 months of age were studied. The volume, composition, and number of cardiac niches were measured. A subgroup of animals was injected with BrdU for 2 and 6 days and killed at 2 days, 6 days, and after 10 weeks of chasing. By this approach, bright and dim BrdU+ CSCs and myocytes were counted (see Supporting Materials and Methods and Table 4, which are published as supporting information on the PNAS web site).
Supplementary Material
Acknowledgments
We thank Z. Qu and L. Yang (Cardiovascular Research Laboratory, Department of Medicine, University of California, Los Angeles) for their extremely helpful suggestions. We also thank S. Cascapera and I. Jakoniuk for their invaluable help. Rat-401 anti-nestin was obtained from the Developmental Studies Hybridoma Bank. This work was supported by National Institutes of Health grants.
Abbreviations
- CSC
cardiac SC
- EC
endothelial cell
- LCC
lineage-committed cell
- Lin−
lineage-negative
- SC
stem cell
Footnotes
Conflict of interest statement: No conflicts declared.
This paper was submitted directly (Track II) to the PNAS office.
References
- 1.Chien K. R. Nature. 2004;428:607–608. doi: 10.1038/nature02500. [DOI] [PubMed] [Google Scholar]
- 2.Leri A., Kajstura J., Anversa P. Physiol. Rev. 2005;85:1373–1416. doi: 10.1152/physrev.00013.2005. [DOI] [PubMed] [Google Scholar]
- 3.Urbanek K., Torella D., Sheikh F., De Angelis A., Nurzynska D., Silvestri F., Beltrami C. A., Bussani R., Beltrami A. P., Quaini F., et al. Proc. Natl. Acad. Sci. USA. 2005;102:8692–8971. doi: 10.1073/pnas.0500169102. [DOI] [PMC free article] [PubMed] [Google Scholar]
- 4.Hierlihy A. M., Seale P., Lobe C. G., Rudnicki M. A., Megeney L. A. FEBS Lett. 2002;530:239–243. doi: 10.1016/s0014-5793(02)03477-4. [DOI] [PubMed] [Google Scholar]
- 5.Beltrami A. P., Barlucchi L., Torella D., Baker M., Limana F., Chimenti S., Kasahara H., Rota M., Musso E., Urbanek K., et al. Cell. 2003;114:763–776. doi: 10.1016/s0092-8674(03)00687-1. [DOI] [PubMed] [Google Scholar]
- 6.Oh H., Bradfute S. B., Gallardo T. D., Nakamura T., Gaussin V., Mishina Y., Pocius J., Michael L. H., Behringer R. R., Garry D. J., et al. Proc. Natl. Acad. Sci. USA. 2003;100:12313–12318. doi: 10.1073/pnas.2132126100. [DOI] [PMC free article] [PubMed] [Google Scholar]
- 7.Matsuura K., Nagai T., Nishigaki N., Oyama T., Nishi J., Wada H., Sano M., Toko H., Akazawa H., Sato H., et al. J. Biol. Chem. 2004;279:11384–11391. doi: 10.1074/jbc.M310822200. [DOI] [PubMed] [Google Scholar]
- 8.Pfister O., Mouquet F., Jain M., Summer R., Helmes M., Fine A., Colucci W. S., Liao R. Circ. Res. 2005;97:52–61. doi: 10.1161/01.RES.0000173297.53793.fa. [DOI] [PubMed] [Google Scholar]
- 9.Fuchs E., Tumbar T., Guasch G. Cell. 2004;116:769–778. doi: 10.1016/s0092-8674(04)00255-7. [DOI] [PubMed] [Google Scholar]
- 10.Zhong W. Neuron. 2003;37:11–14. doi: 10.1016/s0896-6273(02)01178-9. [DOI] [PubMed] [Google Scholar]
- 11.Watt F. M., Hogan B. L. M. Science. 2000;287:1427–1438. doi: 10.1126/science.287.5457.1427. [DOI] [PubMed] [Google Scholar]
- 12.Cancelas J. A., Koevoet W. L., de Koning A. E., Mayen A. E., Rombouts E. J., Ploemacher R. E. Blood. 2000;96:498–505. [PubMed] [Google Scholar]
- 13.Qin G., Ii M., Silver M., Wecker A., Bord E., Ma H., Gavin M., Goukassian D. A., Young-sup Y., Papayannopoulou T., et al. J. Exp. Med. 2006;203:153–163. doi: 10.1084/jem.20050459. [DOI] [PMC free article] [PubMed] [Google Scholar]
- 14.Priestley G. V., Scott L. M., Ulyanova T., Papayannopoulou T. Blood. 2006;107:2959–2967. doi: 10.1182/blood-2005-07-2670. [DOI] [PMC free article] [PubMed] [Google Scholar]
- 15.Perez-Moreno M., Jamora C., Fuchs E. Cell. 2003;112:535–548. doi: 10.1016/s0092-8674(03)00108-9. [DOI] [PubMed] [Google Scholar]
- 16.Goldberg G. S., Valiunas V., Brink P. R. Biochim. Biophys. Acta. 2004;1662:96–101. doi: 10.1016/j.bbamem.2003.11.022. [DOI] [PubMed] [Google Scholar]
- 17.Arai F., Hirao A., Ohmura M., Sato H., Matsuoka S., Takubo K., Ito K., Koh G. Y., Suda T. Cell. 2004;118:149–161. doi: 10.1016/j.cell.2004.07.004. [DOI] [PubMed] [Google Scholar]
- 18.Moore K. A., Lemischka I. R. Science. 2006;311:1880–1885. doi: 10.1126/science.1110542. [DOI] [PubMed] [Google Scholar]
- 19.Zhang J., Niu C., Ye L., Huang H., He X., Tong W. G., Ross J., Haug J., Johnson T., Feng J. Q., et al. Nature. 2003;425:836–841. doi: 10.1038/nature02041. [DOI] [PubMed] [Google Scholar]
- 20.Shen Q., Goderie S., Jin L., Karanth N., Sun Y., Abramova N., Vincent P., Pumiglia K., Temple S. Science. 2004;304:1338–1340. doi: 10.1126/science.1095505. [DOI] [PubMed] [Google Scholar]
- 21.Kiel M. J., Yilmaz O. H., Iwashita T., Yilmaz O. H., Terhorst C., Morrison S. J. Cell. 2005;121:1109–1121. doi: 10.1016/j.cell.2005.05.026. [DOI] [PubMed] [Google Scholar]
- 22.Ross R. S., Borg T. K. Circ. Res. 2001;88:1112–1119. doi: 10.1161/hh1101.091862. [DOI] [PubMed] [Google Scholar]
- 23.Campos L. S., Leone D. P., Relvas J. B., Brakebusch C., Fassler R., Suter U., ffrench-Constant C. Development (Cambridge, U.K.) 2004;131:3433–3444. doi: 10.1242/dev.01199. [DOI] [PubMed] [Google Scholar]
- 24.Jalali S., del Pozo M. A., Chen K.-D., Miao H., Li Y-S., Schwartz M. A., Shyy J. Y-J., Chien S. Proc. Natl. Acad. Sci. USA. 2001;98:1042–1046. doi: 10.1073/pnas.031562998. [DOI] [PMC free article] [PubMed] [Google Scholar]
- 25.Korhonen M., Ormio M., Burgeson R. E., Virtanen I., Savilahti E. J. Histochem. Cytochem. 2000;48:1011–1020. doi: 10.1177/002215540004800714. [DOI] [PubMed] [Google Scholar]
- 26.Siler U., Seiffert M., Puch S., Richards A., Torok-Storb B., Muller C. A., Sorokin L., Klein G. Blood. 2000;96:4194–4203. [PubMed] [Google Scholar]
- 27.Jan Y. N., Jan L. Y. Nature. 1998;392:775–778. doi: 10.1038/33854. [DOI] [PubMed] [Google Scholar]
- 28.Rhyu M. S., Jan L. Y., Jan Y. N. Cell. 1994;76:477–491. doi: 10.1016/0092-8674(94)90112-0. [DOI] [PubMed] [Google Scholar]
- 29.Berdnik D., Torok T., Gonzalez-Gaitan M., Knoblich J. A. (2002) Dev. Cell. 2002;3:221–231. doi: 10.1016/s1534-5807(02)00215-0. [DOI] [PubMed] [Google Scholar]
- 30.Santolini E., Puri C., Salcini A. E., Gagliani M. C., Pelicci P. G., Tacchetti C., Di Fiore P. P. J. Cell Biol. 2000;151:1345–1352. doi: 10.1083/jcb.151.6.1345. [DOI] [PMC free article] [PubMed] [Google Scholar]
- 31.Finkel T. Curr. Opin. Cell Biol. 2003;15:247–254. doi: 10.1016/s0955-0674(03)00002-4. [DOI] [PubMed] [Google Scholar]
Associated Data
This section collects any data citations, data availability statements, or supplementary materials included in this article.


