

Abstract
With a lipid shell containing biotin, micron-sized bubbles bound to avidin on a porous and flexible cellulose boundary were insonified by ultrasound. The oscillation of these targeted microbubbles was observed by high-speed photography and compared to the oscillation of free-floating microbubbles. Adherent microbubbles were observed to oscillate asymmetrically in the plane normal to the boundary, and nearly symmetrically in the plane parallel to the boundary, with a significantly smaller maximum expansion in each dimension for bound than free bubbles. With sufficient transmitted pressure, a jet was produced traveling toward the boundary.
There is a great interest in developing molecularly targeted ultrasound contrast agents due to the potential medical applications.1-4 The agents are gas bubbles with a diameter on the order of a few microns and a shell of albumin, lipid, or polymer. After intravenous injection, peptides or antibodies attached to the shells link the agents to a receptor on endothelial cells. Because of their high echogencity, these targeted agents can be detected by an ultrasound system with high sensitivity, and therefore can provide important information such as the spatial distribution and extent of tumor angiogenesis,5,6 inflammatory response,7,8 or thrombus.9 Current contrast imaging schemes are not yet optimized for imaging these targeted agents because the microbubbles retained in tissue are limited in number,5,9 and the signal from adherent microbubbles can be masked by the signal from freely circulating microbubbles. Strategies for imaging these agents currently require waiting for clearance of free-floating microbubbles or employing image averaging and subtraction techniques. Neither of these techniques is optimal since they require either a time delay, or multiple frames, which impede real-time imaging. Hence, there is a need for the development of a new selective and sensitive method for detecting adherent microbubbles, which will depend on our understanding of the acoustic behavior of a targeted microbubble after it binds to a targeting site.
Mathematical simulations have been developed for modeling microbubble radial oscillation with different assumptions and simplifications.10-12 High-speed micrography has been used to study microbubble radial oscillation,13 translation,14 and fragmentation.15 In these studies, a microbubble is assumed to remain spherical and in an infinite medium. Asymmetrical oscillation of a cavitation bubble and formation of a jet have been studied both theoretically and experimentally by a number of research groups,16-18 although previous experimental studies have involved unencapsulated bubbles of a diameter larger than micron-sized contrast agents, and have not used ultrasound as an excitation source. The behavior of a targeted microbubble after it binds to a vessel wall and is insonified by an ultrasound pulse has not been reported previously.
In order to observe the oscillation of adherent and free-floating microbubbles at 1.5 MHz, a high-speed camera with a time resolution of 10 ns was used in this study. Details of this experimental technique have been reported in a previous publication.15 In these experiments, one low-intensity acoustic pulse (100 kPa, 1 s, 3 MHz) produced radiation force, and a three-cycle high-intensity acoustic pulse at 1.5 MHz produced substantial oscillation for photography. The preparation of the targeted microbubbles and avidin-coated microtube have been described previously.19
Buoyancy was used to locate microbubbles such that they bound in the plane parallel to the imaging view [Fig. 1(a)]. In order to place microbubbles such that they bound in a plane normal to the microscope view, the agents were deflected to the side wall by radiation force, where they bound to the avidin attached to the cellulose vessel [Fig. 1(b)]. Experiments involving free-floating microbubbles were conducted without avidin, and bubbles were confirmed to be nonadherent by their movement with the fluid. All of the frame images shown here are 20 by 20 microns in size.
FIG. 1.
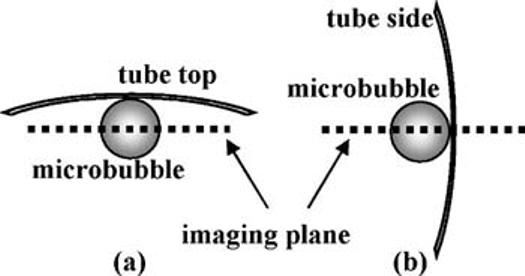
Diagram shows the relative position of the tube wall, microbubble, and imaging plane: (a) parallel imaging plane and (b) normal imaging plane.
In Figs. 2(a)-2(c) images were acquired using microbubbles with an initial diameter of ∼2.3 microns (below the resonance size for the transmitted pulse) and a transmission pressure of 240 kPa. One plane of oscillation for a free bubble is shown in Fig. 2(a). Adherent microbubbles were observed to oscillate symmetrically in the plane parallel to the wall [Fig. 2(b)] (similar to a free-floating microbubble) and asymmetrically in the plane normal to the wall [Fig. 2(c)]. The side of the microbubble near the boundary [Fig. 2(c)] expands and contracts to a lesser extent than the side away from the boundary.
FIG. 2.
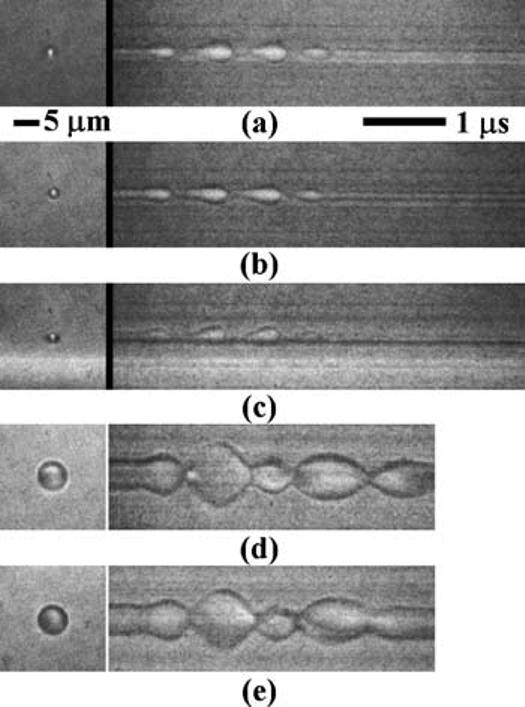
Oscillations of: (a) a free-floating microbubble, (b) an adherent microbubble in the parallel imaging plane, and (c) an adherent microbubble in the normal imaging plane. Subharmonic oscillation is shown in (d) for a free microbubble and in (e) for an adherent microbubble, both in the parallel imaging plane. The driving pulse was a three-cycle 1.5 MHz sinusoidal pulse at 240 kPa.
For larger microbubbles with a resonant frequency lower than the driving center frequency, subharmonic oscillations were observed for a free-floating microbubble [Fig. 2(d)], and for an adherent microbubble in the parallel imaging plane [Fig. 2(e)]. The timing and amplitude of the subharmonic oscillation of an adherent microbubble were similar to a free-floating microbubble.
With a higher transmission pressure of 450 kPa, the center of the microbubble begins to collapse toward the fixed boundary, producing a jet. During rarefaction, the center of the microbubble opposite the boundary expands from this initially smaller diameter (and concave outline) and returns to a convex outline (Fig. 3).
FIG. 3.
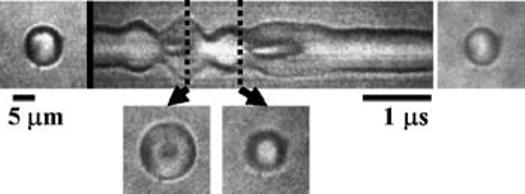
Streak image and frame images illustrating toroidal bubble shape during jet inception after compressional half-cycle.
Fragmentation was observed both in the plane of the boundary and the plane normal to the boundary. An example shown in Fig. 4(a) provides a view normal to the boundary, and was observed following a transmission pressure of 240 kPa. The initial diameter was estimated to be ∼4.5 microns, which is very close to the resonant size at 1.5 MHz. In the second two-dimensional frame, the microbubble shape is elliptical, resulting from the greater expansion in the plane parallel to boundary. After the second compressional half-cycle, the microbubble fragments, with one fragment remaining bound to the wall and a second fragment is free floating. Fragmentation is also observed in the plane parallel to the boundary in Fig. 4(b), where in this example the transmission pressure was 650 kPa. The microbubble fragments during the second cycle as shown both in the streak and Frames 2 and 3. In the third and fourth cycle, the remaining fragments expand and contract and are displaced along the wall away from the ultrasound source. The displacement is produced by radiation force after the detachment of the microbubble from the wall.
FIG. 4.
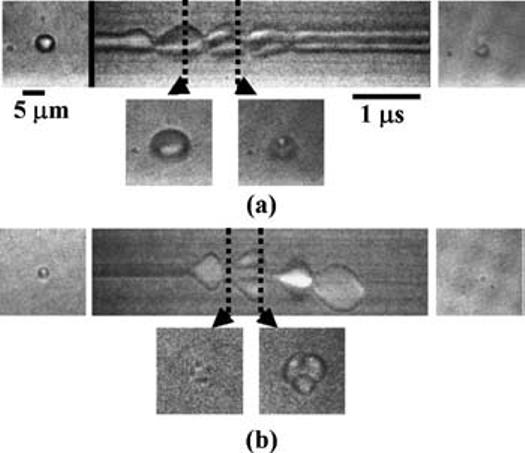
Fragmentation of an adherent microbubble observed from: (a) normal imaging plane and (b) parallel imaging plane.
The maximum relative expansion of 90 free and adherent microbubbles was measured from streak images with a transmission pressure of 240 kPa. A significant difference in normalized radial expansion was observed between free-floating microbubbles (mean=2.21, n=32) and adherent microbubbles in the normal imaging plane (mean=1.83, n=30) with p<2.0E-5; between free-floating microbubbles and adherent microbubbles in the parallel imaging plane (mean =1.99, n=28) with p<0.015; and between adherent bubbles in the normal and parallel imaging planes with p<0.038. Adherent microbubbles expand to an ellipsoidal shape in the normal imaging plane, and the eccentricity was measured to be 0.71±0.06(n=22) from the frame images, while free microbubbles expand nearly symmetrically (eccentricity =0.24±0.14, n=20). The results suggest that the presence of the wall and the adhesion between the wall and a targeted microbubble affect its maximum expansion.
The avidin-biotin targeting used in this study exhibits the highest known affinity (association constant Ka ∼ 1015 M-1) between a ligand and a protein.20 Hence, the adhesion of bubbles in this system may be greater than the adhesion of antibody or peptide-based agents in vivo.
The simulation of the oscillation of a cavitation bubble demonstrates that the presence of a boundary affects the symmetry of bubble oscillation.18,21 For a bubble with an initial radius of 5 microns and wall velocity of 12 m/s, in a microvessel with a diameter of 200 microns, the ratio of (a-b)/a was estimated to be ∼2.5%, where a and b are the semimajor and semiminor axes of an ellipse, respectively.22 In our experimental study in a 200 micron microvessel, bubbles were adherent to the boundary rather than located in the center of the microvessel, and the acoustic pressure used resulted in a higher maximum wall velocity, estimated to be on the order of 50 m/s at 240 kPa.12 The ratio of (a-b)/a was measured to be ∼30% in the normal imaging plane for adherent microbubbles.
Fragments of microbubbles after insonation were observed to either remain adherent to the boundary or to float freely. A toroidal shape, indicative of the formation of a jet, was observed parallel to the boundary at a moderate acoustic pressure (450 kPa). The shell of the microbubble is often modeled as reducing surface tension but introducing a viscous outer layer.12 Studies of unshelled microbubbles indicate that surface tension and liquid viscosity may influence the jet velocity and determine whether rebound occurs before the jet reaches the far wall.23,24
Differences in oscillation observed between free and adherent microbubbles might be exploited, resulting in a selective imaging method to discriminate adherent and freely circulating contrast agents, since differences in bubble oscillation result in differences in the echo. A selective imaging method for adherent targeted microbubbles could eliminate the need to wait for the clearance of circulating agents prior to imaging and improve the image contrast.
Acknowledgments
The authors appreciate the help of Dr. Mark Borden and Dr. Dustin Kruse. This work is supported by T32EB003827, R21CA098692, and R01CA103828.
References
- 1.Lindner JR. J. Nucl. Cardiol. 2004;11:215. doi: 10.1016/j.nuclcard.2004.01.003. [DOI] [PubMed] [Google Scholar]
- 2.Bloch SH, Dayton PA, Ferrara KW. IEEE Eng. Med. Biol. Mag. 2004;23:18. doi: 10.1109/memb.2004.1360405. [DOI] [PubMed] [Google Scholar]
- 3.Villanueva FS, Wagner WR, Vannan MA, Narula J. Cardiol. Clin. 2004;22:283. doi: 10.1016/j.ccl.2004.02.008. [DOI] [PubMed] [Google Scholar]
- 4.Lanza GM, Wickline SA. Curr. Probl Cardiol. 2003;28:625. doi: 10.1016/j.cpcardiol.2003.11.001. [DOI] [PubMed] [Google Scholar]
- 5.Leong H, Christiansen J, Klibanov AL, Kaul S, Lindner JR. Circulation. 2003;107:455. doi: 10.1161/01.cir.0000044916.05919.8b. [DOI] [PubMed] [Google Scholar]
- 6.Weller GER, Wong MKK, Modzelewski RA, Liu E, Klibanov AL, Wagner WR, Villanueva FS. Cancer Res. 2005;65:533. [PubMed] [Google Scholar]
- 7.Lindner JR, Dayton PA, Coggins MP, Ley K, Song J, Ferrara K, Kaul S. Circulation. 2000;102:531. doi: 10.1161/01.cir.102.5.531. [DOI] [PubMed] [Google Scholar]
- 8.Christiansen JP, Leong-Poi H, Klibanov AL, Kaul S, Lindner JR. Circulation. 2002;105:1764. doi: 10.1161/01.cir.0000015466.89771.e2. [DOI] [PubMed] [Google Scholar]
- 9.Schumann PA, Christiansen JP, Quigley RM, McCreery TP, Sweitzer RH, Unger EC, Lindner JR, Matsunaga TO. Invest. Radiol. 2002;37:587. doi: 10.1097/00004424-200211000-00001. [DOI] [PubMed] [Google Scholar]
- 10.Church CC. J. Acoust. Soc. Am. 1995;97:1510. [Google Scholar]
- 11.Hoff L, Sontum PC, Hovem JM. J. Acoust. Soc. Am. 2000;107:2272. doi: 10.1121/1.428557. [DOI] [PubMed] [Google Scholar]
- 12.Morgan KE, Allen JS, Dayton PA, Chomas JE, Klibaov AL, Ferrara KW. IEEE Trans. Ultrason. Ferroelectr. Freq. Control. 2000;47:1494. doi: 10.1109/58.883539. [DOI] [PubMed] [Google Scholar]
- 13.de Jong N, Frinking PJA, Bouakaz A, Goorden M, Schourmans T, Jingping X, Mastik F. Ultrasound Med. Biol. 2000;26:487. doi: 10.1016/s0301-5629(99)00159-3. [DOI] [PubMed] [Google Scholar]
- 14.Dayton PA, Allen JS, Ferrara KW. J. Acoust. Soc. Am. 2002;112:2183. doi: 10.1121/1.1509428. [DOI] [PubMed] [Google Scholar]
- 15.Chomas JE, Dayton P, May D, Ferrara K. J. Biomed. Opt. 2001;6:141. doi: 10.1117/1.1352752. [DOI] [PubMed] [Google Scholar]
- 16.Sato K, Tomita Y, Shima A. J. Acoust. Soc. Am. 1994;95:2416. [Google Scholar]
- 17.Brujan EA, Nahen K, Schmidt P, Vogel A. J. Fluid Mech. 2001;433:251. [Google Scholar]
- 18.Brujan EA, Keen GS, Vogel A, Blake JR. Phys. Fluids. 2002;14:85. [Google Scholar]
- 19.Zhao S, Borden M, Bloch SH, Kruse D, Ferrara KW, Dayton P. Molecular Imaging. 2004;3:135. doi: 10.1162/1535350042380317. [DOI] [PMC free article] [PubMed] [Google Scholar]
- 20.Green NM. Adv. Protein Chem. 1975;29:85. doi: 10.1016/s0065-3233(08)60411-8. [DOI] [PubMed] [Google Scholar]
- 21.Tomita Y, Robinson PB, Tong RP, Blake JR. J. Fluid Mech. 2002;466:259. [Google Scholar]
- 22.Hu YT, Qin SP, Hu T, Ferrara KW, Jiang Q. Int. J. Non-Linear Mech. 2005;40:341. [Google Scholar]
- 23.Popinet S, Zaleski S. J. Fluid Mech. 2002;464:137. [Google Scholar]
- 24.Zhang ZY, Zhang HS. Phys. Rev. E. 2004;70:056310–1. doi: 10.1103/PhysRevE.70.056310. [DOI] [PubMed] [Google Scholar]