

Abstract
Male and female Fischer 344 rats were administered trichloroethylene (TRI) (2, 5, or 15 mmol/kg body weight) in corn oil by oral gavage and TRI and its metabolites were measured at times up to 48 hr in liver, kidney, blood, and urine. We tested the hypothesis that sex-dependent differences in distribution and metabolism of TRI could help explain differences in toxicity. Higher levels of TRI were generally observed in tissues of males. A biphasic pattern of TRI concentration was observed in liver, kidney, and blood of both males and females, consistent with enterohepatic recirculation. Higher concentrations of cytochrome P450 (P450)-derived metabolites (chloral hydrate, trichloroacetate, trichloroethanol) were observed in livers of males than in livers of females whereas the opposite pattern was observed in kidneys. Chloral hydrate was the primary P450-derived metabolite in blood and urine of males whereas trichloroacetate was the primary P450-derived metabolite in blood and urine of females. S-(1,2-Dichlorovinyl)glutathione (DCVG) was recovered in liver and kidney of female rats only and in blood of both male and female rats, with generally higher amounts found in females. S-(1,2-Dichlorovinyl)-l-cysteine (DCVC), the penultimate nephrotoxic metabolite, was recovered in male and female liver, female kidney, male blood, and in urine of both males and females. The results demonstrate sex-dependent differences in recovery of key metabolites of TRI that may help explain differences in susceptibility to TRI-induced toxicity with both the liver and kidney as target organs.
INTRODUCTION
Trichloroethylene (TRI1) is a known animal carcinogen. Limited evidence also exists for its carcinogenicity in humans. The World Health Organization considers TRI “probably carcinogenic in humans” (IARC, 1995) and the U.S. Department of Health and Human Services lists TRI as “reasonably anticipated to be a human carcinogen” (NTP, 2002). Several tumor target organs exist, with sensitivity varying between males and females and among species. For example, liver and lungs are primary target organs in male mice whereas kidneys are primary target organs in male rats. Potential target organs in humans include kidneys, liver, cervix, and hematopoietic cells (i.e., non-Hodgkin’s lymphoma) (Wartenberg et al., 2000).
There are two main pathways for TRI metabolism, an oxidative pathway initiated by cytochrome P450 (P450) enzymes (Figure 1) and a conjugative pathway initiated by glutathione S-transferases (GSTs) (Figure 2) (Lash et al., 1988, 2000a). The P450 pathway, which yields chloral hydrate (CH), dichloroacetate (DCA), trichloroacetate (TCA), and trichloroethanol (TCOH) as major metabolites, is the primary metabolic route for TRI metabolism at relatively low substrate concentrations. By contrast, the GST pathway, which yields S-(1,2-dichlorovinyl)glutathione (DCVG), S-(1,2-dichlorovinyl)-l-cysteine (DCVC), and N-acetyl-S-(1,2-dichlorovinyl)-l-cysteine (NAcDCVC) as major metabolites, only becomes quantitatively significant in overall metabolism of TRI at relatively high substrate concentrations. This fact may be deceptive, however, because further metabolism of DCVC by either the cysteine conjugate β-lyase (β-lyase) or flavin-containing monooxygenase (FMO) produces highly reactive chemical species that may bind to DNA, protein or lipid and produce nephrotoxicity and/or nephrocarcinogenicity (Lash et al., 2000b). Much smaller amounts of these reactive species may be required to elicit a toxic response as compared to required amounts of stable end-products produced by the P450 pathway (Lash et al., 1988).
Figure 1. Scheme for metabolism of TRI by P450 pathway.
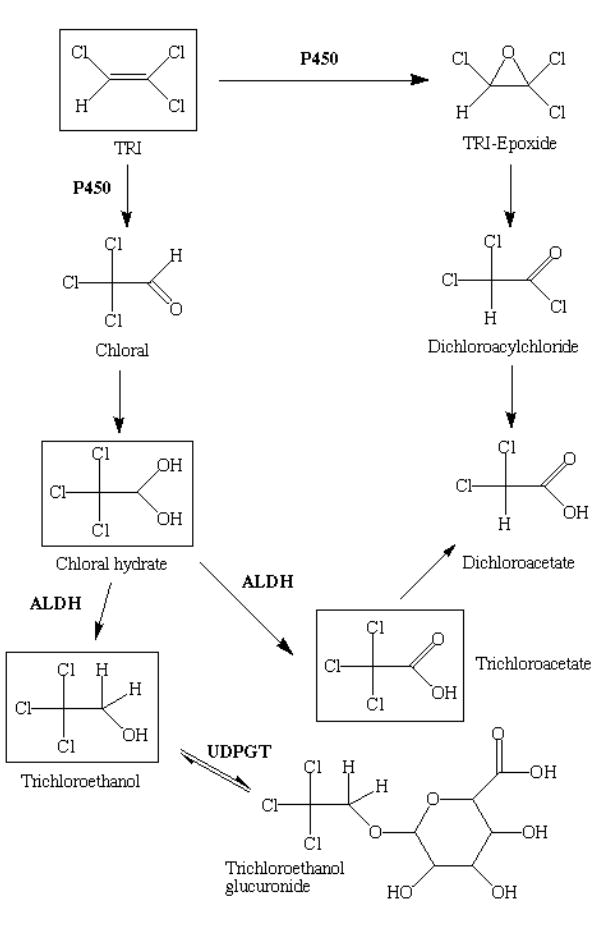
The scheme outlines the major metabolites in the oxidative pathway of trichloroethylene (TRI) metabolism. Metabolism of TRI is initiated by cytochrome P450 (P450) enzymes. Chemicals that are measured or detected in this study are surrounded by a box. Other abbreviations: ALDH, aldehyde dehydrogenase; UDPGT, UDP-glucuronosyltransferase.
Figure 2. Scheme for metabolism of TRI by GST pathway.
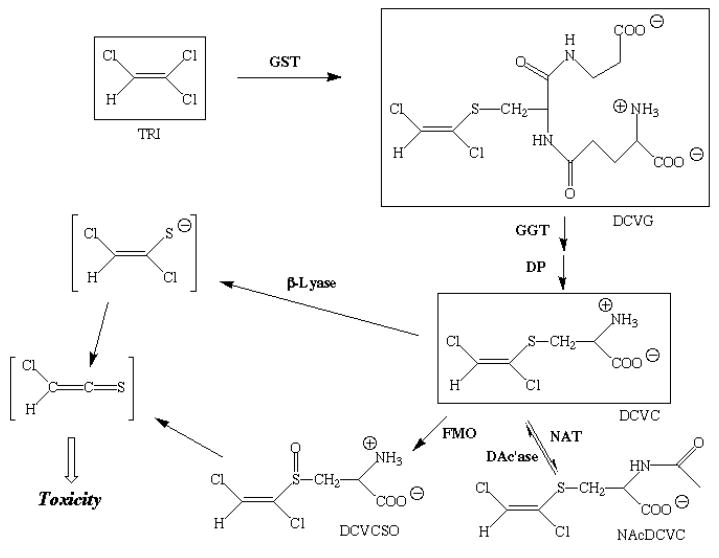
The scheme outlines the major metabolites in the GSH conjugation pathway of trichloroethylene (TRI) metabolism. Chemicals that are measured or detected in this study are surrounded by a box and those that are chemically reactive and unstable are shown within brackets. Other abbreviations: β-Lyase; cysteine conjugate β-lyase; DAc’ase, deacetylase; FMO, flavin-containing monooxygenase; DCVC, S-(1,2-dichlorovinyl)-l-cysteine; DCVCSO, S-(1,2- dichlorovinyl)- l-cysteine sulfoxide; DCVG, S-(1,2-dichlorovinyl)glutathione; DP, dipeptidase; GGT, γ-glutamyltransferase; NAcDCVC, N-acetyl-S-(1,2-dichlorovinyl)- l-cysteine.
Demonstration of TRI metabolism in vivo in animals and humans comes primarily from urinary excretion data. Principal metabolites recovered in urine include TCA, TCOH and its glucuronide (Lash et al., 2000a). NAcDCVC has been recovered in urine of rats and humans (primarily in an occupational setting) exposed to TRI, although concentrations have typically been <1% of those of the P450-derived metabolites (Bernauer et al., 1996; Birner et al., 1993; Commandeur and Vermeulen, 1990; Dekant et al., 1986). Some have concluded from this that the GST pathway is quantitatively insignificant in the overall metabolism of TRI (Goeptar et al., 1995; Green et al., 1997). As noted above, a simple comparison based on urinary excretion without consideration of chemical reactivity and total production of metabolites may give an inaccurate portrayal of the importance of the two pathways. Information on other GST-derived metabolites of TRI besides NAcDCVC could help clarify the significance of this pathway. A limited amount of such information is available. For example, DCVG was detected in the blood of human volunteers exposed by inhalation to 50 or 100 ppm TRI, thus demonstrating function of the GST pathway in humans by detection of a metabolite proximal to both the reactive species and to the terminal excretion product NAcDCVC (Lash et al., 1999a). More direct information about the role of the GST pathway would come, however, from data obtained in liver and kidney.
Although the details of the metabolic pathways for TRI have been extensively studied and several physiologically-based pharmacokinetic (PBPK) models have been described for multiple species, including rats, mice, and humans (Abbas and Fisher, 1997; Allen and Fisher, 1993; Clewell et al., 2000; Dallas et al., 1991; D’Souza et al., 1985; Fisher, 2000; Fisher et al., 1991, 1998; Greenberg et al., 1999), questions remain concerning tissue levels of key metabolites after in vivo exposures to TRI and the relationship between P450- and GST-derived metabolites. Lipscomb et al. (1998) developed parameters to correlate data on enzymatic rates and metabolite concentrations in vitro with those in vivo, although additional in vivo data are necessary for validation. Another gap in the database is that most of the previous PBPK models have considered only the P450 pathway and have solely considered the kidneys as sites for excretion of metabolites and not as a potential biotransformation site or target organ. Additional data on GST-derived metabolites are, therefore, needed. Obtaining information on metabolites in target tissues will provide more accurate correlation of external exposure dose with the amount of reactive or toxic metabolite formed at the site of action and should provide data for improved modeling encompassing both the GST and P450 pathways.
In the present study, male and female F344 rats were exposed by oral gavage to three doses of TRI in corn oil and P450- and glutathione (GSH)-derived metabolites were quantified in urine, blood, liver, and kidney over a 48-hr time course. The results demonstrated formation of both DCVG and DCVC in liver and kidney with distinct time, dose, and sex dependencies. These and other differences in recovery of P450-derived metabolites of TRI may help explain differences in susceptibility to TRI-induced toxicity with both the liver and kidney as target organs.
MATERIALS AND METHODS
Materials
TRI (reported to be 99.9% pure, as judged by electron ionization mass spectrometry), CH, TCA, DCA, and TCOH were purchased from Sigma Chemical Co. (St. Louis, MO). DCVG, DCVC, and NAcDCVC were synthesized as previously described (Elfarra et al., 1986; Uttamsingh et al., 1999), using TRI and either GSH, l-cysteine, or N-acetyl-l-cysteine in sodium and liquid ammonia. Purity (> 95%) was determined by high-performance liquid chromatography (HPLC) analysis, and identity was confirmed by proton NMR spectroscopy. All other chemicals were of the highest purity available and were obtained from commercial sources.
Exposure and Sampling Protocol
Non-fasted male (150 to 200 g) and female (125 to 150 g) F344 rats (Charles River Laboratories, Wilmington, MA) were given one of three doses of TRI (2, 5, or 15 mmol/kg body weight in 2.0 ml corn oil) by oral gavage, representing a low, medium, and high dose (Larson and Bull, 1989, 1992; Templin et al., 1995). Animals were housed in polystyrene metabolic cages to enable collection of urine and were allowed to acclimate for at least 5 days before the start of experiments. Due to the nature of the sampling (see below), each time point required a separate animal. For measurement of metabolites in urine samples, two collections post-exposure were made: 0 to 24 hr and 24 to 48 hr. Urine samples were processed at the same time of day (between 8 am and 10 am) to eliminate potential differences in amounts excreted due to diurnal variation. For measurement of metabolites in blood, liver, and kidney, samples were taken at 2, 4, 8, 24, and 48 hr post-exposure. Hence, a total of 108 rats were used, comprising 54 males and 54 females, and was based on having 2 sexes, 3 doses of TRI, 5 time points for blood, liver, and kidney samples, and 3 replicates (2 x 3 x 5 x 3 = 90) and 2 sexes, 3 doses of TRI, 2 time points for urine samples [requiring only 1 rat per sex and per dose], and 3 replicates (2 x 3 x 1 x 3 = 18).
At the times for blood and tissue sampling, rats were anesthetized with 50 mg of sodium pentobarbital/kg body weight. Approximately 4 ml of blood was withdrawn by cardiac puncture and placed in a heparinized tube on ice. After flushing of the liver and kidneys of as much blood as possible with normal saline, liver and kidneys were excised, blotted to remove excess liquid, and weighed. Livers and cortical tissue from kidneys were minced in 40 or 20 ml, respectively, of 100 mM potassium phosphate buffer, pH 7.4, containing 150 mM potassium chloride. Tissues were then homogenized using a 40-ml glass Dounce tissue grinder. Urine was collected in metabolic cages and filtered through 4 layers of cheesecloth prior to extraction.
For gas chromatography (GC) measurements, 0.5 ml of blood, urine, or liver or kidney homogenates was extracted with 0.5 ml of ethyl acetate. Ethyl acetate extracts were spiked with 10 nmol of the internal standard 1,2-dibromopropane. Extracts (3 μl each) were injected onto the GC column for analysis of TRI, CH, TCA, DCA, TCOH, and NAcDCVC.
For HPLC measurements, 0.5 ml of blood, urine, or liver or kidney homogenates was deproteinated by addition of 0.1 ml of 70% (w/v) perchloric acid. Acid extracts were then derivatized with iodoacetate and 1-fluoro-2,4-dinitrobenzene for analysis of DCVG, DCVC, GSH, and glutathione disulfide (GSSG).
GC Assays
The parent compound TRI and several of its P450-derived metabolites were analyzed by GC with electron-capture detection, using a Perkin-Elmer PE-210 capillary column (30 m x 0.25 mm I.D. x 0.5 μm film thickness) and a Perkin-Elmer AutoSystem XL GC system. Ethyl acetate extracts of samples were spiked with 10 nmol of 1,2-dibromopropane as an internal standard. Two different procedures were used:
In the first method, which was essentially as described previously (Cummings et al., 2001) and used to analyze TRI, CH, and TCOH, injector temperature was 200°C, detector temperature was 300°C, and He was the carrier at a flow rate of 24.8 ml/min and 150°C. The oven ramp method used for sample elution involved 11 min at 35°C, a linear gradient from 35 to 120°C from 11 to 19 min, and holding at 120°C from 19 to 38 min. Retention times for TRI, CH, and TCOH were 3.90, 6.15, and 15.00 min, respectively. Limits of detection in blood and urine (pmol/ml), liver (pmol/g tissue), and kidney (pmol/g tissue) were 1.2, 0.2, and 0.4 for TRI, 0.3, 0.05, and 0.1 for CH, and 0.3, 0.05, and 0.1 for TCOH.
In the second method, used to analyze TCA and DCA, samples were first derivatized by adding 1 μl of 2 M (trimethylsilyl)diazomethane (Aldrich Chemical Co., Milwaukee, WI) to 200 μl of ethyl acetate extract. After a 60-min incubation at room temperature, 2 μl of the derivatized extract was injected onto the PE-210 capillary column. Injector temperature was 175°C, detector temperature was 300°C, and He was the carrier at a flow rate of 24.8 ml/min and 150°C. The oven ramp method used for sample elution involved 5 min at 120°C, a linear gradient from 120°C to 175°C from 5 to 10.5 min, holding at 175°C until 20.5 min, a linear gradient from 175°C to 240°C from 20.5 to 22.35 min, and holding at 240°C until 26 min. Retention times for DCA and TCA were 14.9 and 16.2 min, respectively. Limits of detection in blood and urine (pmol/ml), liver (pmol/g tissue), and kidney (pmol/g tissue) for both metabolites were 9, 1.5, and 3, respectively.
Mercapturates of TRI (both NAc-1,2-DCVC and NAc-2,2-DCVC) were measured in blood, urine, liver, and kidney essentially as previously described (Lash et al., 1999a). Ethyl acetate extracts were derivatized with (trimethylsilyl)diazomethane and were analyzed by GC using flame-ionization detection on an HP-5 column (30 m x 0.25 mm). Chromatography conditions were: Injector temperature 175°C, initial temperature 60°C; the oven ramp method used for sample elution involved 2 min at 60°C and a linear gradient from 60°C to 165°C from 2 to 22.75 min. The limit of detection was 50 ng/ml sample.
HPLC Assay
Samples of blood, urine, liver, and kidney (0.5-ml aliquots) were deproteinated by addition of 0.1 ml of 70% (v/v) perchloric acid and aliquots of the acid extracts (0.5 ml) were derivatized with iodoacetic acid and 1-fluoro-2,4-dinitrobenzene for analysis of the S-carboxymethyl-N-dinitrophenyl derivative of GSH, the N,N-bis-dinitrophenyl derivative of GSSG, and the N-dinitrophenyl derivatives of DCVG and DCVC, as previously described (Fariss and Reed, 1987; Lash and Jones, 1985; Lash et al., 1999b). Derivatives were separated by ion-exchange, reversed-phase HPLC on a Waters μBondapak-amine column using a methanol-acetate solvent and detection at 365 nm. An example of a set of retention times for the derivatives of DCVC, DCVG, GSH, and GSSG were 13.5, 17.1, 34.8, and 38.2 min, respectively. Limits of detection for all four derivatives in blood and urine (pmol/ml), liver (pmol/g tissue), and kidney (pmol/g tissue) were 1.1, 11, and 22, respectively.
Data Analysis
All values are means ± SE of measurements from 3 separate animals for each tissue or fluid for each time point. Data are normalized to volume for blood and urine or to g tissue for liver and kidney. Significant differences (P < 0.05) between means of all values were assessed by a two-way analysis of variance. When significant F values were obtained, the Fisher’s protected least significance t-test was performed to determine which means were significantly different from one another, with two-tail probabilities < 0.05 considered significant.
RESULTS
Distribution and Status of TRI
Marked differences in concentrations of TRI in the liver were observed between males and females and according to dose and time (Table 1). In males, hepatic concentrations of TRI were highest at the lowest administered dose, with a maximal concentration of 167 pmol/g tissue occurring at 24 hr after administration. In contrast, hepatic concentrations of TRI in females exhibited the opposite pattern, increasing with increasing administered dose. Distribution of TRI also differed depending on the dose administered. Thus, whereas hepatic concentrations in male rat livers did not peak until 24 hr at the lowest dose, they peaked at 2 hr at the 5-mmol/kg dose and exhibited little change over time at the 15 mmol/kg dose. In female rats, in contrast, hepatic TRI concentrations peaked at 2 hr and exhibited little change over time at the 2-mmol/kg dose and had peaks in concentration at 8 hr at the two higher doses.
Table 1. Distribution of TRI in liver.
Male and female F344 rats (175–225 g body weight) were exposed to one of three doses of TRI (2, 5, 15 mmol/kg body weight in 1 ml corn oil) by oral gavage. Animals were kept in metabolic cages for up to 48 hr. Due to the nature of the tissue or fluid sampling, each time point was represented by a separate animal. Results are pmol/g tissue and are means ± SE of measurements from 3 animals for each data point. TRI concentrations in liver homogenates were measured by GC with electron capture detection. The limit of detection was 0.2 pmol/g tissue.
| 2 mmol TRI/kg | 5 mmol TRI/kg | 15 mmol TRI/kg | ||||
|---|---|---|---|---|---|---|
| Male | Female | Male | Female | Male | Female | |
| 2 hr | 35.9 ± 18.0a | 3.93 ± 0.03f | 37.4 ± 14.7a | 25.1 ± 4.6a | 0.91 ± 0.14g | 3.93 ± 0.67j |
| 4 hr | 2.60 ± 0.96b,h,m | 1.40 ± 0.06b | 2.32 ± 0.67b,m | 1.50 ± 0.20b,m | 0.44 ± 0.24e | 5.03 ± 0.41k |
| 8 hr | 116 ± 7c | 2.50 ± 0.21b,h | 1.90 ± 0.26b,m | 22.1 ± 3.6a | 0.44 ± 0.07e | 99.4 ± 23.5c |
| 24 hr | 167 ± 24d | 2.53 ± 0.29b,h | 0.65 ± 0.40e,g | 4.70 ± 2.50h,j,k | 1.14 ± 0.29g,i | 9.17 ± 1.38l |
| 48 hr | 0.52 ± 0.01e | 1.00 ± 0.10g | 1.43 ± 0.61b,g | 19.5 ± 9.9a,l | 2.55 ± 1.26b,h,i | 1.83 ± 0.33m |
Values with different superscript letters are significantly different (P < 0.05) from one another.
Similar patterns of TRI concentration with respect to time after administration and between male and female rats were observed in kidneys (Table 2). Tissue concentrations in kidney cortical homogenates were generally two- to threefold higher than those in liver at corresponding doses and times. This indicates that although substantial amounts of TRI are taken up by the liver considering its greater tissue weight, significant amounts of TRI are also taken up by the kidneys, thereby providing substrate for renal metabolism.
Table 2. Distribution of TRI in kidney.
Male and female F344 rats (175–225 g body weight) were exposed to one of three doses of TRI (2, 5, 15 mmol/kg body weight in 1 ml corn oil) by oral gavage. Animals were kept in metabolic cages for up to 48 hr. Due to the nature of the tissue or fluid sampling, each time point was represented by a separate animal. Results are pmol/g tissue and are means ± SE of measurements from 3 animals for each data point. TRI concentrations in kidney homogenates were measured by GC with electron capture detection. The limit of detection was 0.4 pmol/g tissue.
| 2 mmol TRI/kg 5 | mmol TRI/kg 15 | mmol TRI/kg | ||||
|---|---|---|---|---|---|---|
| Male | Female | Male | Female | Male | Female | |
| 2 hr | 33.3 ± 3.7a | 10.2 ± 0.4e | 75.4 ± 6.5g | 36.3 ± 5.2a | 3.37 ± 0.60b,h | 4.25 ± 0.40b |
| 4 hr | 3.71 ± 0.26b,h | 3.63 ± 1.24b,h | 2.83 ± 0.49h | 6.36 ± 3.40b,e,f | 8.15 ± 7.55d,e,f,h,j | 9.64 ± 2.64e |
| 8 hr | 401 ± 190c | 4.73 ± 0.66b,f | 3.50 ± 0.86b,h | 50.4 ± 1.2i | 0.83 ± 0.07d | 183 ± 58k |
| 24 hr | 374 ± 24c | 5.33 ± 0.18f | 3.18 ± 1.13b,h | 15.4 ± 0.8j | 3.02 ± 1.12b,h | 16.6 ± 2.4j |
| 48 hr | 1.28 ± 0.14d | 3.60 ± 2.31b,f,h | 5.83 ± 0.82f | 37.6 ± 21.7a,j | 3.62 ± 0.94b,h | 5.99 ± 0.52f |
Values with different superscript letters are significantly different (P < 0.05) from one another.
Concentrations of TRI in blood generally paralleled those in liver (Table 3). Male rats exhibited increasing concentrations of TRI in blood at the lowest administered dose, with a peak of 80.1 pmol/ml at 24 hr. In contrast, concentrations of TRI in blood at the two higher doses in male rats peaked at 2 hr and decreased thereafter. Female rats generally exhibited higher concentrations of TRI with increasing administered dose; peak concentrations of TRI occurred at 2 hr at the lowest administered dose and at 8 hr at the two higher doses.
Table 3. Distribution of TRI in blood.
Male and female F344 rats (175–225 g body weight) were exposed to one of three doses of TRI (2, 5, 15 mmol/kg body weight in 1 ml corn oil) by oral gavage. Animals were kept in metabolic cages for up to 48 hr. Due to the nature of the tissue or fluid sampling, each time point was represented by a separate animal. Results are pmol/ml blood and are means ± SE of measurements from 3 animals for each data point. TRI concentrations in blood were measured by GC with electron capture detection. The limit of detection was 1.2 pmol/ml.
| 2 mmol TRI/kg | 5 mmol TRI/kg | 15 mmol TRI/kg | ||||
|---|---|---|---|---|---|---|
| Male | Female | Male | Female | Male | Female | |
| 2 hr | 9.59 ± 2.29a | 1.84 ± 0.34b | 20.3 ± 3.6c | 6.71 ± 2.16a | 1.49 ± 0.36b | 1.99 ± 0.44b |
| 4 hr | 1.39 ± 0.31b,f,i | 0.82 ± 0.07f,i | 2.25 ± 1.28b,k | 0.56 ± 0.06h,i,j | 0.30 ± 0.09g,i,j | 1.68 ± 0.05b |
| 8 hr | 25.8 ± 11.4c | 0.80 ± 0.15f,i | 1.36 ± 0.22b | 6.53 ± 2.64a | 0.68 ± 0.55i,j | 36.7 ± 12.1c |
| 24 hr | 80.1 ± 4.3d | 0.68 ± 0.11f,h,i,j | 0.99 ± 0.57b,f,i,j | 1.50 ± 0.31b | 0.44 ± 0.14j | 3.07 ± 0.24k |
| 48 hr | 0.19 ± 0.02e,i | 0.29 ± 0.03g,i,j | 0.56 ± 0.06h,i,j | 2.81 ± 1.14b,k | 0.49 ± 0.12j | 0.56 ± 0.19j |
Values with different superscript letters are significantly different (P < 0.05) from one another.
Small amounts of TRI were recovered in 24-hr urine samples of male rats at the lowest and highest administered doses of TRI (Table 4). In contrast, female rats only exhibited a small amount of TRI in 48-hr urine samples at the 5-mmol/kg dose of TRI. These results indicate that over the 48-hr time course of the measurements, >95% of the administered TRI is taken up by tissues and metabolized or is exhaled unchanged.
Table 4. Distribution of TRI in urine.
Male and female F344 rats (175–225 g body weight) were exposed to one of three doses of TRI (2, 5, 15 mmol/kg body weight in 1 ml corn oil) by oral gavage. Animals were kept in metabolic cages for up to 48 hr. Due to the nature of the tissue or fluid sampling, each time point was represented by a separate animal. Results are pmol/ml urine and are means ± SE of measurements from 3 animals for each data point. TRI concentrations in urine were measured by GC with electron-capture detection. The limit of detection was 1.2 pmol/ml.
| 2 mmol TRI/kg | 5 mmol TRI/kg | 15 mmol TRI/kg | ||||
|---|---|---|---|---|---|---|
| Male | Female | Male | Female | Male | Female | |
| 24 hr | 1.38 ± 0.50a | < 1.2a | < 1.2a | < 1.2a | 6.14 ± 4.95a | < 1.2a |
| 48 hr | < 1.2a | < 1.2a | < 1.2a | 2.60 ± 1.39a | < 1.2a | < 1.2a |
Values with different superscript letters are significantly different (P < 0.05) from one another.
Distribution of P450-Derived Metabolites of TRI
Three P450-derived metabolites of TRI −CH, TCA, and TCOH− were detected in livers of male and female rats (Table 5). Livers from male rats generally exhibited higher concentrations of these metabolites and the time courses for formation of these chemicals differed between the two sexes. At the 2-mmol/kg dose of TRI, CH was the primary metabolite recovered in liver from both males and females at early times after exposure, corresponding with CH being a metabolite derived from an early step in the oxidative pathway. At 8 hr and later times in males and at 48 hr in females, the primary metabolite recovered was TCA, corresponding with TCA being a metabolite derived from later steps in the oxidative pathway. Peak concentrations of TCA were 3.4-fold higher in livers from male rats than in livers from female rats. At the two higher administered doses of TRI, low concentrations of CH were recovered at most time points whereas about 10-fold higher concentrations of TCA were found at a few selected, early time points. Low concentrations of TCOH were detected in livers from male rats at the 5-mmol/kg dose at times after 4 hr and at the 15-mmol/kg dose at 2 hr.
Table 5. Distribution of CH, TCA, and TCOH in Liver.
Male and female F344 rats (175–225 g body weight) were exposed to one of three doses of TRI (2, 5, 15 mmol/kg body weight in 1 ml corn oil) by oral gavage. Animals were kept in metabolic cages for up to 48 hr. Due to the nature of the tissue or fluid sampling, each time point was represented by a separate animal for each time dose and point. Results are pmol/g tissue and are means ± SE of measurements from 3 animals for each data point. CH, TCA, and TCOH concentrations in liver homogenates were measured by GC with electron capture detection. The limits of detection were 0.05, 1.5, and 0.05 pmol/g tissue, respectively.
| 2 mmol TRI/kg | 5 mmol TRI/kg | 15 mmol TRI/kg | ||||
|---|---|---|---|---|---|---|
| Male | Female | Male | Female | Male | Female | |
| CH | ||||||
| 2 hr | 0.90 ± 0.41a,d,g | 0.80 ± 0.13d | 0.27 ± 0.03e | 0.08 ± 0.02b,h | 0.55 ± 0.01a,i | 0.29 ± 0.06e |
| 4 hr | 0.49 ± 0.06a,i | 0.10 ± 0.03b,h | 1.01 ± 0.35d,g | < 0.05c | 3.80 ± 1.36j | 0.27 ± 0.07e |
| 8 hr | 0.12 ± 0.03b | < 0.05c | 1.55 ± 0.01f | 0.09 ± 0.02b,h | 0.13 ± 0.04b | 0.23 ± 0.06e |
| 24 hr | < 0.05c | 0.49 ± 0.05a,i | 0.72 ± 0.14d | 0.07 ± 0.01h | 0.75 ± 0.51d,i | 0.20 ± 0.03e |
| 48 hr | < 0.05c | < 0.05c | 1.17 ± 0.15g | 0.11 ± 0.01b | 0.19 ± 0.10b.e | < 0.05c |
| TCA | ||||||
| 2 hr | < 1.5a | < 1.5a | < 1.5a | 4.84 ± 1.51e,f | 1.50 ± 0.46a | 2.70 ± 0.87d |
| 4 hr | < 1.5a | < 1.5a | < 1.5a | < 1.5a | < 1.5a | < 1.5a |
| 8 hr | 1.75 ± 0.39a,d | < 1.5a | < 1.5a | < 1.5a | 4.99 ± 0.70f | < 1.5a |
| 24 hr | 3.36 ± 0.50b | < 1.5a | 2.57 ± 1.67a,b,d,e | < 1.5a | < 1.5a | < 1.5a |
| 48 hr | 9.11 ± 1.22c | 2.70 ± 0.92b,d,e | < 1.5a | < 1.5a | < 1.5a | < 1.5a |
| TCOH | ||||||
| 2 hr | < 0.05a | < 0.05a | < 0.05a | < 0.05a | 0.09 ± 0.06a | < 0.05a |
| 4 hr | < 0.05a | < 0.05a | 0.31 ± 0.10b | < 0.05a | < 0.05a | < 0.05a |
| 8 hr | < 0.05a | < 0.05a | 0.57 ± 0.05c | < 0.05a | < 0.05a | < 0.05a |
| 24 hr | < 0.05a | < 0.05a | 0.23 ± 0.05b | < 0.05a | < 0.05a | < 0.05a |
| 48 hr | < 0.05a | < 0.05a | 0.41 ± 0.06d | < 0.05a | < 0.05a | < 0.05a |
Values for a given metabolite with different superscript letters are significantly different (P < 0.05) from one another.
Similar patterns of P450-derived metabolites were observed in renal cortical homogenates (Table 6). Similar to the situation with TRI describe above, concentrations of P450-derived metabolites were much higher in kidneys than in liver. Unlike liver metabolites, however, patterns of metabolites in the two sexes were not remarkably different and concentrations of metabolites in kidneys from female rats were generally higher than those from kidneys in male rats. Again, consideration of tissue weights indicates that the liver contains the majority of the total amount of P450 metabolites, but only by a factor of approximately 2:1.
Table 6. Distribution of CH, TCA, and TCOH in Kidney.
Male and female F344 rats (175–225 g body weight) were exposed to one of three doses of TRI (2, 5, 15 mmol/kg body weight in 1 ml corn oil) by oral gavage. Animals were kept in metabolic cages for up to 48 hr. Due to the nature of the tissue or fluid sampling, each time point was represented by a separate animal. Results are pmol/g tissue and are means ± SE of measurements from 3 animals for each data point. CH, TCA, and TCOH concentrations in kidney homogenates were measured by GC with electron capture detection. The limits of detection were 0.05, 1.5, and 0.05 pmol/g tissue, respectively.
| 2 mmol TRI/kg | 5 mmol TRI/kg | 15 mmol TRI/kg | ||||
|---|---|---|---|---|---|---|
| Male | Female | Male | Female | Male | Female | |
| CH | ||||||
| 2 hr | 0.47± 0.07a | 1.90 ± 0.39e | 0.31 ± 0.02h | 0.05 ± 0.02c | 0.92 ± 0.04b | < 0.05a |
| 4 hr | 0.77 ± 0.12b | 0.18 ± 0.04d,j | 2.42 ± 0.68e | < 0.05c | 1.26 ± 0.15g | 0.06 ± 0.02a,l |
| 8 hr | < 0.05c | 0.08 ± 0.02f,l | 4.18 ± 0.18i | 0.22 ± 0.03j | 0.32 ± 0.02h | 0.12 ± 0.03d,f |
| 24 hr | < 0.05c | 1.11 ± 0.02g | 2.34 ± 0.61e | 0.20 ± 0.10d,f,h,j | 0.41 ± 0.06a,h | 0.47 ± 0.01a,h |
| 48 hr | 0.15 ± 0.02d | 0.12 ± 0.04d,f | 4.32 ± 0.67i | 0.26 ± 0.10d,h,j | 0.38 ± 0.04a,h | < 0.05c |
| TCA | ||||||
| 2 hr | 3.82 ± 1.32a,e,f | 17.3 ± 3.9c,h | 2.91 ± 0.14f | 7.44 ± 0.35b | 4.80 ± 0.67g | 30.1 ± 6.4i |
| 4 hr | 2.47 ± 0.17a | 13.7 ± 2.2c | 2.62 ± 0.64a,f | 8.63 ± 0.70b | 3.50 ± 0.11f | 15.5 ± 4.2c |
| 8 hr | 11.7 ± 4.0b,c | 35.9 ± 7.2d | 3.11 ± 0.11f | 6.74 ± 0.72b | 3.36 ± 0.23f | 14.4 ± 3.7c |
| 24 hr | 3.34 ± 0.67a,f | 4.27 ± 0.18e,g | 3.65 ± 0.77f,g | 21.6 ± 3.1h,i | 3.51 ± 0.16f | 6.76 ± 0.21b |
| 48 hr | 8.64 ± 1.30b | 19.1 ± 4.2c | 3.58 ± 0.25f | 13.8 ± 2.7c | 20.8 ± 6.1h,i | 7.65 ± 0.98b |
| TCOH | ||||||
| 2 hr | < 0.05a | < 0.05a | < 0.05a | < 0.05a | 0.39 ± 0.06e | < 0.05a |
| 4 hr | < 0.05a | < 0.05a | 0.81 ± 0.29b | < 0.05a | 0.14 ± 0.01f | < 0.05a |
| 8 hr | < 0.05a | < 0.05a | 1.59 ± 0.16d | < 0.05a | 0.07± 0.01g | < 0.05a |
| 24 hr | < 0.05a | < 0.05a | 0.75 ± 0.30b | < 0.05a | 0.15 ± 0.01f | < 0.05a |
| 48 hr | < 0.05a | < 0.05a | 1.52 ± 0.39d | < 0.05a | 0.14 ± 0.01f | < 0.05a |
Values for a given metabolite with different superscript letters are significantly different (P < 0.05) from one another.
Relatively low levels of P450-derived metabolites were detected in blood (Table 7). Male rats exhibited low but measurable amounts of CH at the two higher administered doses of TRI whereas TCA was primarily detected in blood of female rats at the two lower administered doses of TRI. No detectable TCOH was found.
Table 7. Distribution of CH, TCA, and TCOH in blood.
Male and female F344 rats (175–225 g body weight) were exposed to one of three doses of TRI (2, 5, 15 mmol/kg body weight in 1 ml corn oil) by oral gavage. Animals were kept in metabolic cages for up to 48 hr. Due to the nature of the tissue or fluid sampling, each time point was represented by a separate animal. Results are pmol/ml blood and are means ± SE of measurements from 3 animals for each data point. CH, TCA, and TCOH concentrations in blood were measured by GC with electron capture detection. The limits of detection were 0.3, 9, and 0.3 pmol/ml blood, respectively.
| 2 mmol TRI/kg | 5 mmol TRI/kg | 15 mmol TRI/kg | ||||
|---|---|---|---|---|---|---|
| Male | Female | Male | Female | Male | Female | |
| CH | ||||||
| 2 hr | < 0.3a | < 0.3a | < 0.3a | < 0.3a | 0.34 ± 0.05a | < 0.3a |
| 4 hr | < 0.3a | < 0.3a | 0.42 ± 0.13a | < 0.3a | 0.32 ± 0.06a | < 0.3a |
| 8 hr | < 0.3a | < 0.3a | 0.70 ± 0.01b | < 0.3a | < 0.3a | < 0.3a |
| 24 hr | < 0.3a | < 0.3a | 0.58 ± 0.15b | < 0.3a | < 0.3a | < 0.3a |
| 48 hr | < 0.3a | < 0.3a | 0.69 ± 0.06b | < 0.3a | < 0.3a | < 0.3a |
| TCA | ||||||
| 2 hr | < 9a | 18.2 ± 2.2b | < 9a | < 9a | < 9a | < 9a |
| 4 hr | < 9a | 15.8 ± 0.7b | < 9a | < 9a | < 9a | < 9a |
| 8 hr | < 9a | 17.1 ± 2.6b | < 9a | < 9a | < 9a | < 9a |
| 24 hr | < 9a | < 9a | < 9a | 12.4 ± 4.2a,,cb | < 9a | < 9a |
| 48 hr | 10.3 ± 2.5a | < 9a | < 9a | 9.67 ± 2.38a,c | < 9a | < 9a |
| TCOH | ||||||
| 2 hr | < 0.3a | < 0.3a | < 0.3a | < 0.3a | < 0.3a | < 0.3a |
| 4 hr | < 0.3a | < 0.3a | < 0.3a | < 0.3a | < 0.3a | < 0.3a |
| 8 hr | < 0.3a | < 0.3a | < 0.3a | < 0.3a | < 0.3a | < 0.3a |
| 24 hr | < 0.3a | < 0.3a | < 0.3a | < 0.3a | < 0.3a | < 0.3a |
| 48 hr | < 0.3a | < 0.3a | < 0.3a | < 0.3a | < 0.3a | < 0.3a |
Values for a given metabolite with different superscript letters are significantly different (P < 0.05) from one another.
Urinary CH was detected at low amounts in male rats only at the two lower doses and in both males and females at the highest administered dose of TRI (Table 8). Urinary TCA was only detected in female rats and urinary TCOH was only detected at the 24-hr time point but in both male and female rats.
Table 8. Distribution of CH, TCA, and TCOH in urine.
Male and female F344 rats (175–225 g body weight) were exposed to one of three doses of TRI (2, 5, 15 mmol/kg body weight in 1 ml corn oil) by oral gavage. Animals were kept in metabolic cages for up to 48 hr. Due to the nature of the tissue or fluid sampling, each time point was represented by a separate animal. Results are pmol/ml urine and are means ± SE of measurements from 3 animals for each data point. CH, TCA, and TCOH concentrations in urine were measured by GC with electron capture detection. The limits of detection was 0.3, 9, and 0.3 pmol/ml, respectively.
| 2 mmol TRI/kg | 5 mmol TRI/kg | 15 mmol TRI/kg | ||||
|---|---|---|---|---|---|---|
| Male | Female | Male | Female | Male | Female | |
| CH | ||||||
| 24 hr | 0.44 ± 0.14a,b,c | < 0.3a | 0.54 ± 0.14b | < 0.3a | 3.35 ± 0.62d | 0.64 ± 0.21b |
| 48 hr | < 0.3a | < 0.3a | 0.38 ± 0.01c | < 0.3a | < 0.3a | < 0.3a |
| TCA | ||||||
| 24 hr | < 9a | 30.4 ± 10.4b | < 9a | 37.3 ± 8.2b | < 9a | 241 ± 80c |
| 48 hr | < 9a | < 9a | < 9a | 26.7 ± 8.1b | < 9a | < 9a |
| TCOH | ||||||
| 24 hr | 3.19 ± 1.06a,d | 2.29 ± 0.47a | 0.77 ± 0.29c | 4.05 ± 0.94d | < 0.3b | 22.2 ± 2.2e |
| 48 hr | < 0.3b | < 0.3b | < 0.3b | < 0.3b | < 0.3b | < 0.3b |
Values for a given metabolite with different superscript letters are significantly different (P < 0.05) from one another.
Additionally, binding of TCA to plasma proteins may also contribute to the disposition of P450-derived metabolites of TRI, although this was not directly assessed in the present study.
Distribution of GSH-Derived Metabolites of TRI
The initial metabolite of the GST pathway, DCVG, was detected in liver and kidney homogenates at certain doses and times after ingestion, but only in tissue from female rats (Figure 3). In liver homogenates, DCVG was not detected until 4 hr and exhibited a maximal amount of approximately 80 pmol/g tissue at the 8-hr time point with the 2-mmol/kg dose of TRI. No DCVG was detected at 24 hr but it was again detected at 48 hr at the two higher concentrations of administered TRI. DCVG was detected in kidney homogenates from female rats at the 8-hr and 48-hr time points at the higher doses of TRI. The concentrations of DCVG recovered in kidney, however, were very high, ranging from 200 to 400 pmol/g tissue.
Figure 3. Tissue distribution of DCVG in female rat liver and kidney.
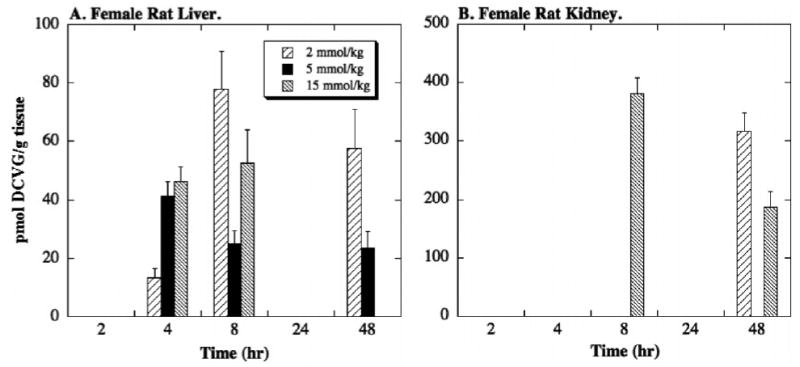
Male and female F344 rats (175–225 g body weight) were exposed to one of three doses of TRI (2, 5, 15 mmol/kg body weight in 1 ml corn oil) by oral gavage. Animals were kept in metabolic cages for up to 48 hr. Due to the nature of the tissue sampling, each time point was represented by a separate animal. Results are means ± SE of measurements from 3 animals for each data point. DCVG concentrations in liver or kidney homogenates were measured by HPLC. The limit of detection in liver and kidney was 11 and 22 pmol/g tissue, respectively. No DCVG was detected in male rat liver or kidney.
DCVG was recovered in blood from both male and female rats (Figure 4). Unlike previously reported results from a human TRI-exposure study (Lash et al., 1999a), recovery of DCVG in blood of female rats was either equivalent to or higher than that in male rats. At the 2-mmol/kg dose of TRI (Figure 4A), DCVG was primarily detected at early times after exposure, disappearing at the 24-hr time point, and reappearing at the 48-hr time point in females only. At the 5-mmol/kg dose of TRI (Figure 4B), DCVG was detected in blood from male rats at very low levels only at the 4- and 8-hr time points and in blood from female rats at a relatively high level only at the 8-hr time point. A similar pattern was observed at the 15-mmol/kg dose of TRI (Figure 4C), except that concentrations of DCVG were higher than at the 5-mmol/kg dose and DCVG was also observed in blood from female rats at the 48-hr time point.
Figure 4. Tissue distribution of DCVG in rat blood.
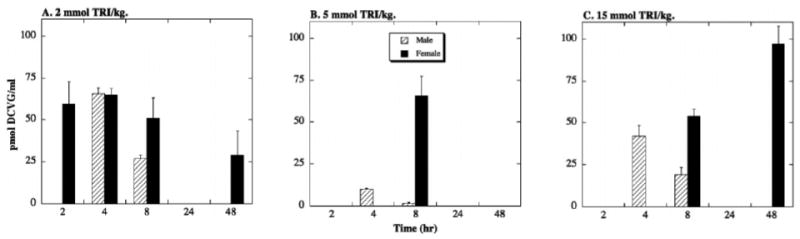
Male and female F344 rats (175–225 g body weight) were exposed to one of three doses of TRI (2, 5, 15 mmol/kg body weight in 1 ml corn oil) by oral gavage. Animals were kept in metabolic cages for up to 48 hr. Due to the nature of the fluid sampling, each time point was represented by a separate animal. Results are means ± SE of measurements from 3 animals for each data point. The limit of detection was 1.1 pmol/ml.
After initial formation of the GSH conjugate, subsequent metabolism produces the cysteine conjugate DCVC (see Figure 2). DCVC was recovered in liver homogenates of both male and female rats, although only in female rats at the 5-mmol/kg dose and only in male rats at the 15-mmol/kg dose (Figure 5). Maximal concentrations of DCVC were about 9 pmol/g tissue at the 5-mmol/kg dose and about 25 pmol/g tissue at the 15-mmol/kg dose. DCVC was also detected in kidney homogenates, although only in tissue from female rats and only at the 5-mmol/kg dose (Figure 6). Concentrations of DCVC that were recovered in liver and kidney tissue were considerably lower that those of DCVG that were recovered.
Figure 5. Tissue distribution of DCVC in rat liver.
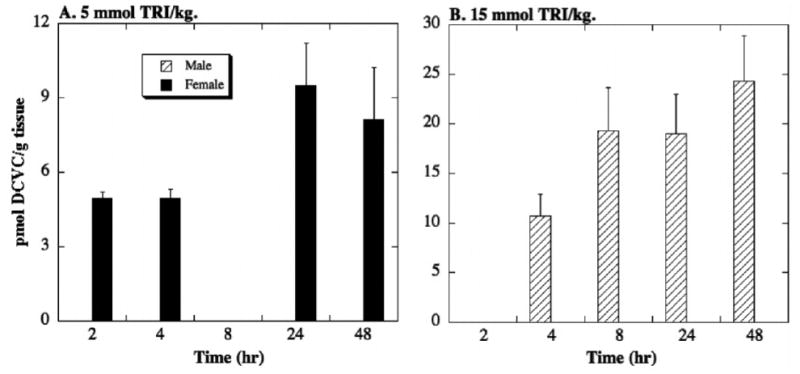
Male and female F344 rats (175–225 g body weight) were exposed to one of three doses of TRI (2, 5, 15 mmol/kg body weight in 1 ml corn oil) by oral gavage. Animals were kept in metabolic cages for up to 48 hr. Due to the nature of the tissue sampling, each time point was represented by a separate animal. Results are means ± SE of measurements from 3 animals per data point. DCVC concentrations in liver homogenates were measured by HPLC. The limit of detection was 11 pmol/g tissue. No DCVC was detected in animals treated with the 2-mmol TRI/kg dose.
Figure 6. Tissue distribution of DCVC in female rat kidney.
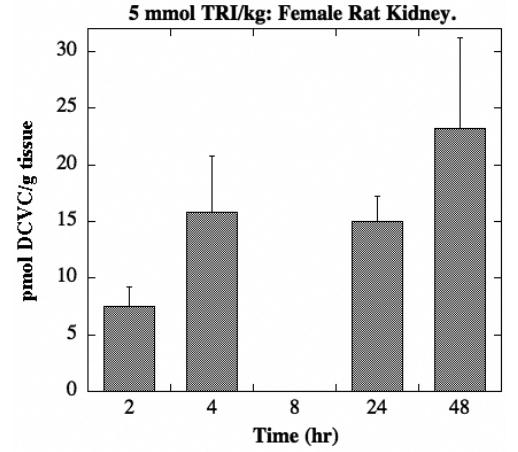
Male and female F344 rats (175–225 g body weight) were exposed to one of three doses of TRI (2, 5, 15 mmol/kg body weight in 1 ml corn oil) by oral gavage. Animals were kept in metabolic cages for up to 48 hr. Due to the nature of the tissue sampling, each time point was represented by a separate animal. Results are means ± SE of measurements from 3 animals per data point. DCVC concentrations in kidney homogenates were measured by HPLC. The limit of detection was 22 pmol/g tissue. No DCVC was detected in male rats or in female rats treated with either the 2-mmol or 15-mmol TRI/kg dose.
DCVC was also detected in blood, but only in that from male rats exposed to the 15-mmol/kg dose of TRI (Figure 7). Maximal concentrations of DCVC were approximately 14 pmol/ml, which is less than 20% of the maximal concentration of DCVG that was detected.
Figure 7. Tissue distribution of DCVC in male rat blood.
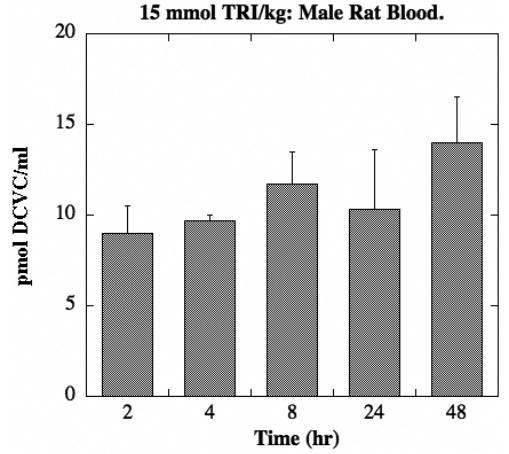
Male and female F344 rats (175–225 g body weight) were exposed to one of three doses of TRI (2, 5, 15 mmol/kg body weight in 1 ml corn oil) by oral gavage. Animals were kept in metabolic cages for up to 48 hr. Due to the nature of the fluid sampling, each time point was represented by a separate animal. Results are means ± SE of measurements from 3 animals for each data point. The limit of detection was 1.1 pmol/ml. No DCVC was detected in female rats or in male rats treated with either the 2-mmol or 5-mmol TRI/kg dose.
While there was no detectable DCVG in rat urine, large amounts of DCVC were detected, especially in urine from male rats (Figure 8). Amounts of DCVC showed little concentration dependence, but were present at levels of approximately 800 pmol/ml at 24 hr and at levels ranging from 800 to 1000 pmol/ml at 48 hr. In contrast, concentrations of DCVC detected in female rat urine were less than 10% of those found in male rat urine. This is the first report, to our knowledge, of DCVC recovery in urine from rats exposed to TRI.
Figure 8. Tissue distribution of DCVC in rat urine.
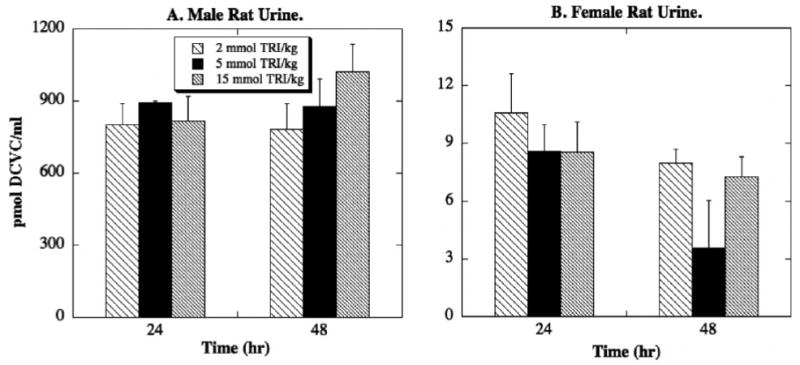
Male and female F344 rats (175–225 g body weight) were exposed to one of three doses of TRI (2, 5, 15 mmol/kg body weight in 1 ml corn oil) by oral gavage. Animals were kept in metabolic cages for up to 48 hr. Due to the nature of the fluid sampling, each time point was represented by a separate animal. Results are means ± SE of measurements from 3 animals for each data point. The limit of detection was 1.1 pmol/ml.
Although a highly sensitive GC method was used to measure NAcDCVC (limit of detection = 50 ng/ml sample), none was detected in any tissue or fluid samples.
Tissue Glutathione Status
Tissue glutathione levels are known to exhibit considerable diurnal variations. Inasmuch as the same method used for measuring DCVG and DCVC is used to measure GSH, GSSG, and related amino acids (Fariss and Reed, 1987; Lash and Jones, 1985; Lash et al., 1999b), we quantified concentrations of GSH and GSSG in liver and kidney homogenates from male and female rats treated with TRI (Tables 9 and 10). The results show some very prominent differences between male and female rats as well as some differences that appear to correlate with the dose of administered TRI.
Table 9. Concentrations of glutathione and glutathione disulfide in liver.
Male and female F344 rats (175–225 g body weight) were exposed to one of three doses of TRI (2, 5, 15 mmol/kg body weight in 1 ml corn oil) by oral gavage. Animals were kept in metabolic cages for up to 48 hr. Due to the nature of the tissue or fluid sampling, each time point was represented by a separate animal. Results are nmol/g tissue and are means ± SE of measurements from 3 animals for each data point. GSH and GSSG concentrations in liver homogenates were measured by HPLC after derivatization with iodoacetate and 1-fluoro-2,4-dinitrobenzene. The limit of detection was 11 nmol/g tissue.
| 2 mmol TRI/kg | 5 mmol TRI/kg | 15 mmol TRI/kg | ||||
|---|---|---|---|---|---|---|
| Male | Female | Male | Female | Male | Female | |
| GSH | ||||||
| 2 hr | 3160 ± 254a | 1290 ± 80d,l | 3153 ± 161a | 1740 ± 140i,o | 2354 ± 270b,g | 1580 ± 280d,e,f,i |
| 4 hr | 2345 ± 92b,g | 1380 ± 180d,e | 2650 ± 283a,b,n | 1240 ± 150d,j,k,l | 1687 ± 126i,o | 2250 ± 110b,m,n |
| 8 hr | 1961 ± 143c,i,m | 1630 ± 130e,f,i,p | 1997 ± 300c,f,g,i,m | 1680 ± 190i,o | 2256 ± 144b | 1530 ± 90e,o |
| 24 hr | 2275 ± 93b,c | 1530 ± 160e,i,k | 807 ± 68h | 1010 ± 180h,l | 1656 ± 195e,i,p | 1800 ± 100o,p |
| 48 hr | 3005 ± 354a | 1510 ± 240e,i,k,p | 954 ± 192h,j | 1710 ± 140i,o | 1579 ± 225d,e,f,i,o | 2420 ± 250b |
| GSSG | ||||||
| 2 hr | 64.7 ± 5.8a | 40.0 ± 11.6c,e | 82.7 ± 2.2b,f | 43.3 ± 8.8c | 95.0 ± 10.0f,g | 49.3 ± 20.7a,c |
| 4 hr | 79.3 ± 6.2b,f | 46.7 ± 3.3c | 63.3 ± 5.6a | 66.7 ± 3.3a | 64.7 ± 6.7a | 83.3 ± 18.6b,f |
| 8 hr | 88.3 ± 13.3b,f | 80.0 ± 10.0b,f | 22.7 ± 10.7d | 60.0 ± 15.3a | 88.3 ± 6.5b,f | 83.3 ± 8.8b,f |
| 24 hr | 39.0 ± 14.0c,e | 63.3 ± 18.6a,b | 26.3 ± 8.1d,e | 43.3 ± 13.3c,d | 58.7 ± 16.0a,c | 56.7 ± 6.7a,c |
| 48 hr | 41.3 ± 8.8c,e | 60.0 ± 10.0a | 18.0 ± 2.1d | 56.7 ± 6.7a | 60.0 ± 10.4a | 120 ± 20g |
Values for either GSH or GSSG with different superscript letters are significantly different (P < 0.05) from one another.
Table 10. Concentrations of glutathione and glutathione disulfide in kidney.
Male and female F344 rats (175–225 g body weight) were exposed to one of three doses of TRI (2, 5, 15 mmol/kg body weight in 1 ml corn oil) by oral gavage. Animals were kept in metabolic cages for up to 48 hr. Due to the nature of the tissue or fluid sampling, each time point was represented by a separate animal. Results are nmol/g tissue and are means ± SE of measurements from 3 animals for each data point. GSH and GSSG concentrations in kidney homogenates were measured by HPLC after derivatization with iodoacetate and 1-fluoro-2,4-dinitrobenzene. The limit of detection was 22 nmol/g tissue.
| 2 mmol TRI/kg | 5 mmol TRI/kg | 15 mmol TRI/kg | ||||
|---|---|---|---|---|---|---|
| Male | Female | Male | Female | Male | Female | |
| GSH | ||||||
| 2 hr | 941 ± 133a,f | 1023 ± 148a,f | 770 ± 215a,b | 1279 ± 186a,c | 848 ± 145a,f | 411 ± 105d,g |
| 4 hr | 691 ± 83b | 1141 ± 165a | 304 ± 55d,e | 880 ± 221a,b | 440 ± 49g | 156 ± 56h |
| 8 hr | 782 ± 97a,b | 1414 ± 126c | 365 ± 53d,g | 1408 ± 263c | 735 ± 145a,b | 102 ± 17h |
| 24 hr | 726 ± 200a,b | 1456 ± 186c | 265 ± 30e | 676 ± 218b,f,g | 283 ± 43e | 144 ± 32h |
| 48 hr | 751 ± 151a,b | 1547 ± 210c | 331 ± 42d | 907 ± 152a,b | 277 ± 45d,e | 170 ± 40h |
| GSSG | ||||||
| 2 hr | < 22a | < 22a | < 22a | < 22a | < 22a | < 22a |
| 4 hr | < 22a | 29.7 ± 16.2a,b | < 22a | < 22a | < 22a | < 22a |
| 8 hr | < 22a | 55.0 ± 17.0b,c | < 22a | 76.7 ± 33.2b,c | < 22a | < 22a |
| 24 hr | < 22a | 22.7 ± 8.3a | < 22a | 78.7 ± 19.2c | < 22a | < 22a |
| 48 hr | < 22a | 47.0 ± 17.9b | < 22a | < 22a | < 22a | < 22a |
Values for either GSH or GSSG with different superscript letters are significantly different (P < 0.05) from one another.
Male rats exhibited hepatic concentrations of GSH that are 1.5- to 2-fold higher than those of female rats (Table 9). In all samples from either gender, concentrations of GSSG were between 1% and 5% of those of GSH, suggesting no oxidative stress as a result of the TRI administration. In male but not in female rats, hepatic concentrations of GSH were diminished with exposure to higher doses of TRI, particularly at the 5-mmol/kg dose. In contrast to results in liver homogenates, examination of GSH status in kidney homogenates showed two striking results: First, concentrations of GSH were generally higher in tissue from female rats than in tissue from male rats; second, there was a marked decrease in renal GSH concentrations from both males and females as the administered dose of TRI was increased but the pattern of decrease differed in the two genders (Table 10). GSH concentrations in renal tissue from male rats exhibited most of their decrease going from the low to the medium dose of TRI and only a small, additional decrease going from the medium to the high dose of TRI. In contrast, GSH concentrations in renal tissue from female rats exhibited marked decreases going from both the low to the medium dose of TRI and from the medium to the high dose of TRI.
DISCUSSION
In spite of its small and relatively simple structure, metabolism of TRI is complex, with the existence of two major pathways that markedly differ in terms of chemical reactivities of their products and rates and patterns in different sexes, species, and tissues (Lash et al., 2000a). Pharmacokinetics of TRI are also complicated by the lipophilic nature of the parent compound and the interorgan metabolism and enterohepatic recirculation of certain of its metabolites (Stenner et al., 1998). These complexities make it difficult to determine the concentration of key metabolites that will exist in a target tissue given a specific, external exposure to the parent compound and consequently, to predict the potential, toxic response from the exposure.
To begin to address this issue, we exposed male and female F344 rats by oral gavage to three doses of TRI, equivalent to a low, moderate, and high dose (i.e., 2, 5, 15 mmol/kg body weight). To enable full absorption of the administered dose, TRI was dissolved in corn oil. One problem with using corn oil as a vehicle is that one often observes unusual patterns of absorption, such as multiple peaks of parent compound or metabolites in blood or tissues and unusual concentration profiles over time after initial administration of parent compound (e.g., see Keys et al., 2003). In the present study, this was clearly manifested by measurements of TRI and its P450-derived metabolites in liver, kidney, and blood. Besides these apparent solvent-induced anomalies, TRI and some of its metabolites, such as TCOH glucuronide, are known to undergo enterohepatic circulation (Lash et al., 2000a; Stenner et al., 1998), which would also lead to such unusual patterns in blood and tissues.
One could argue that use of a different delivery method for TRI, such as inhalation or intra-arterial/intraperitoneal injection, or use of a different solvent in the single-bolus oral gavage, would produce more consistent results with respect to progression with time and administered dose. Our measurements of TRI compartmentation and recovery of metabolites exhibited atypical behavior with respect to time and dose. For example, the time courses at a given dose for a specific metabolite often increased rapidly to some peak level, decreased, and then markedly increased again by the 48-hr time point. Other seemingly aberrant results were that the appearance of a specific metabolite in a given tissue at a given time point was often highest at the lower administered doses of TRI. Several points need consideration in trying to understand these behaviors. First, oral gavage was chosen to more closely resemble exposure of humans to TRI in the drinking water. Second, with respect to solvent choice, corn oil has been one of the most commonly used solvents to ensure complete absorption of TRI. Use of a more aqueous solvent may introduce other variables into the experimental design, including differing absorption of TRI. Third, if a significant portion of the measured levels of TRI and its metabolites was due to artifact, one would presumably observe a high degree of variability in the replicates. As can clearly be seen from examination of the data in the tables and figures, the degree of variation was not excessive. Fourth, some of the atypical or unexpected behavior may have rational explanations. For example, the partitioning of TRI between P450- and GST-dependent metabolism differs markedly at low and high concentrations. Thus, catalytic efficiency and the proportion of TRI transformed to certain metabolites will differ at the three administered doses of TRI.
An important finding that has implications for PBPK modeling and risk assessment is the substantial concentrations of TRI found in renal homogenates. Although the majority of TRI metabolism occurs in the liver, significant metabolism and concentration of filtered metabolites also occur in the kidneys. Significant differences were observed between male and female rats, with male rats exhibiting markedly higher tissue concentrations of TRI than females at several time points. Conversion of CH to TCA was faster and greater in female rats than in male rats at the two higher administered doses of TRI. While CH was the primary P450-derived metabolite recovered in liver, particularly at early time points, TCA was the predominant P450-derived metabolite recovered in kidney homogenates. This is an interesting and unexpected finding because TCA has been associated with toxic and carcinogenic effects of TRI in liver (Bull, 2000) and no effects on renal function have been ascribed to this metabolite (Lash et al., 1995, 2000a, 2000b, 2001). Thus, while rat kidney can catalyze formation of P450-dependent metabolites of TRI (Cummings et al., 2001), the implications of this activity for TRI-induced toxicity for humans remain unclear. Human kidney does not express cytochrome P450 2E1, the primary P450 enzyme that metabolizes TRI, and little or no P450-derived metabolites of TRI are detected in human kidney cells (Cummings and Lash, 2000). Hence, the relevance of the P450 pathway for the kidneys as a target organ for TRI, particularly in humans, appears to be minimal. Male and female rats also exhibited a different pattern of P450-derived metabolites in blood: When detected, male rats exhibited primarily CH whereas female rats exhibited TCA. A similar pattern was observed in urine, although both sexes also excreted significant amounts of TCOH. The ratio of TCOH/TCA in rat urine was greater in males than in females, which is similar to the pattern observed in humans after 24 hr exposures to TRI (Nomiyama and Nomiyama, 1971).
Most of the PBPK models for TRI have focused on the P450 metabolic pathway and have used the liver as the primary site of metabolism (Abbas and Fisher, 1997; Allen and Fisher, 1993; Dallas et al., 1991; D’Souza et al., 1985; Fisher, 2000; Fisher et al., 1991, 1998; Greenberg et al., 1999). While this approach accounts quantitatively for the majority of the metabolism and toxicity of TRI, it omits the GSH-dependent pathway and the kidney as a target organ. Clewell et al. (2000), however, did incorporate the GSH-dependent pathway for TRI metabolism into their PBPK model. At the time of creation of that model, however, little quantitative data were available on the in vivo formation of GSH-derived metabolites of TRI. Human volunteers exposed by inhalation to 50 or 100 ppm TRI exhibited DCVG in their blood (Lash et al., 1999a). While these data demonstrated activity of the pathway, it is difficult to use that information to estimate tissue levels of key metabolites from external exposures to the parent compound. Metabolism data for several of the steps of the GSH-dependent pathway from in vitro tissue preparations are available from both rodents (Lash and Anders, 1986; Lash et al., 1995, 1998, 2000a) and humans (Lash et al., 1990, 1999b). The difficulty in using these data remain the extrapolation of in vitro results to in vivo concentrations (Lipscomb et al., 1998). One solution to this dilemma is the approach that we used in the present study, namely the determination of parent compound and metabolite concentrations in liver, kidney, blood, and urine.
A novel and significant finding of the present study is the demonstration of GSH-derived metabolites of TRI after in vivo exposure to TRI in liver, kidney, blood, and urine. DCVG was detected in liver and kidney only in female rats. One potential explanation for this sex difference would be that male rats process GSH conjugates at higher rates than female rats. There is no significant sex-dependent difference, however, in renal GGT activity (Lash et al., 1998). DCVG was also detected in the blood of male and female rats exposed to TRI. Unlike results in humans exposed by inhalation to TRI (Lash et al., 1999a), DCVG concentrations in rat blood were not significantly higher in males. Rather, DCVG concentrations in female rat blood were either similar to or higher than those in male rat blood, depending on time and dose. This suggests that the pharmacokinetics for TRI may differ significantly between rats and humans. Alternatively, the difference in the route of exposure (i.e., bolus oral gavage in corn oil in rats, inhalation in humans), may contribute to the difference in appearance of metabolite in blood.
Of greater novelty and significance was the discovery of DCVC in homogenates of liver and kidney. The importance of this finding is that DCVC is the penultimate, GSH-derived metabolite of TRI that generates the ultimate reactive species that can cause nephrotoxicity and nephrocarcinogenicity (Lash et al., 1988, 2000b). DCVC was detected in female rat livers only at the 5-mmol TRI/kg dose and in male rat livers only at the 15-mmol TRI/kg dose, with approximately twofold higher concentrations of DCVC in male rat livers than in female rat livers. Inasmuch as no liver and only kidney pathology is observed with the GSH-derived metabolites of TRI (Elfarra et al., 1986; Lash et al., 1988, 2000b), detection of DCVC in renal tissue is more directly related to toxicity than that in liver tissue. Although hepatic β-lyase is just as capable as the renal activity in bioactivating DCVC, little reactive species is generated by this pathway in the liver because of efficient excretion of DCVC or its mercapturate into blood or bile. For the kidney, DCVC was only detected in female rats at the 5-mmol TRI/kg dose. DCVC excretion into urine, however, was only detected in male rats. Again, this is, to our knowledge, the first report of recovery of DCVC in urine of rats exposed to TRI. Consideration of all these data together suggest that male rats are exposed to higher amounts of nephrotoxic precursor metabolite and likely form more of the reactive species than female rats.
Additional evidence for greater flux of TRI through the GSH-derived pathway in male rats as compared to female rats comes from analysis of GSH concentrations in liver and kidney. Although some time-dependent differences in tissue concentrations of GSH can be ascribed to normal, diurnal variation, greater decreases in both liver and kidney GSH concentrations in TRI-exposed male rats were consistently observed. While paired measurements of GSH concentrations in tissues from non-exposed rats would correct for any changes due to diurnal variation, the pairing of measurements in identically exposed male and female rats and the larger decreases with increasing TRI exposure doses are consistent with the conclusion that these changes in tissue GSH concentrations are due to GSH conjugation of TRI. Importantly, these data provide in vivo evidence that GSH conjugation of TRI occurs in both liver and kidney, consistent with the previously obtained in vitro data in renal cells and subcellular fractions (Lash et al., 1995, 1998, 1999b).
In conclusion, significant differences between male and female rats were observed in the pharmacokinetics and metabolism of TRI and several of its key metabolites. Formation in vivo, not only of DCVG but of DCVC, was demonstrated in both liver and kidney. A significant role for renal GST in formation of GSH-derived metabolites of TRI was also demonstrated. Analysis of patterns of DCVG and DCVC formation and tissue concentrations of GSH suggest that male rats are exposed to higher amounts of potentially toxic, reactive, GSH-derived metabolites than female rats. The results indicate that for rats, renal P450-dependent metabolism and the GSH-dependent pathway, including both intrarenal and extrarenal metabolism, should be incorporated into PBPK models.
Acknowledgments
We thank Jan Crowley, Washington University, St. Louis, MO, for NMR analysis of DCVC, DCVG, and NAcDCVC.
Footnotes
This study was supported by a cooperative agreement with the U.S. Environmental Protection Agency (CR-824183) and National Institute of Environmental Health Sciences Grant R01-ES08828 to L.H.L. The views expressed in this article are those of the authors and do not necessarily reflect the views or policies of the U.S. Environmental Protection Agency.
Author to whom reprint requests should be sent: Dr. Lawrence H. Lash, Department of Pharmacology, Wayne State University School of Medicine, 540 East Canfield Ave., Detroit, MI 48201.
Abbreviations used: β-lyase; cysteine conjugate β-lyase; CH, chloral hydrate; DCA, dichloroacetate; DCVC, S-(1,2-dichlorovinyl)-l-cysteine; DCVG, S-(1,2-dichlorovinyl)-glutathione; ECD, electron capture detection; F344, Fischer 344; FID, flame-ionization detection; FMO, flavin-containing monooxygenase; GC, gas chromatography; GSH, glutathione; GSSG, glutathione disulfide; GST, GSH S-transferase; HPLC, high-performance liquid chromatography; NAcDCVC, N-acetyl-S-(1,2-dichlorovinyl)-l-cysteine; P450, cytochrome P450; PBPK; physiologically-based pharmacokinetic; TCA, trichloroacetate; TCOH, trichloroethanol; TRI, trichloroethylene.
References
- Abbas R, Fisher JW. A physiologically-based pharmacokinetic model for trichloroethylene and its metabolites, chloral hydrate, trichloroacetate, dichloroacetate, trichloroethanol, and trichloroethanol glucuronide in B6C3F1 mice. Toxicol Appl Pharmacol. 1997;147:15–30. doi: 10.1006/taap.1997.8190. [DOI] [PubMed] [Google Scholar]
- Allen BC, Fisher JW. Modeling of the pharmacokinetics of trichloroethylene and trichloroacetic acid in humans. Risk Anal. 1993;13:71–86. doi: 10.1111/j.1539-6924.1993.tb00730.x. [DOI] [PubMed] [Google Scholar]
- Bernauer U, Birner G, Dekant W, Henschler D. Biotransformation of trichloroethene: Dose-dependent excretion of 2,2,2-trichloro-metabolites and mercapturic acids in rats and humans after inhalation. Arch Toxicol. 1996;70:338–346. doi: 10.1007/s002040050283. [DOI] [PubMed] [Google Scholar]
- Birner G, Vamvakas S, Dekant W, Henschler D. Nephrotoxic and genotoxic N-acetyl- S-dichlorovinyl-l-cysteine is a urinary metabolite after occupational 1,1,2- trichloroethene exposure in humans: Implications for the risk of trichloroethene exposure. Environ Health Perspect. 1993;99:281–284. doi: 10.1289/ehp.9399281. [DOI] [PMC free article] [PubMed] [Google Scholar]
- Bull RJ. Mode of action of liver tumor induction by trichloroethylene and its metabolites. Environ Health Perspect. 2000;108 (Suppl 2):241–260. doi: 10.1289/ehp.00108s2241. [DOI] [PMC free article] [PubMed] [Google Scholar]
- Commandeur JNM, Vermeulen NPE. Identification of N-acetyl(2,2-dichlorovinyl)- and N-acetyl(1,2-dichlorovinyl)-l-cysteine as two regioisomeric mercapturic acids of trichloroethylene in the rat. Chem Res Toxicol. 1990;3:212–218. doi: 10.1021/tx00015a005. [DOI] [PubMed] [Google Scholar]
- Clewell HJ, III, Gentry PR, Covington TR, Gearhart JM. Development of a physiologically based pharmacokinetic model of trichloroethylene and its metabolites for use in risk assessment. Environ Health Perspect. 2000;108 (Suppl 2):283–305. doi: 10.1289/ehp.00108s2283. [DOI] [PMC free article] [PubMed] [Google Scholar]
- Cummings BS, Lash LH. Metabolism and toxicity of trichloroethylene and S-(1,2-dichlorovinyl)-l-cysteine in freshly isolated human proximal tubular cells. Toxicol Sci. 2000;53:458–466. doi: 10.1093/toxsci/53.2.458. [DOI] [PubMed] [Google Scholar]
- Cummings BS, Parker JC, Lash LH. Cytochrome P-450-dependent metabolism of trichloroethylene in rat kidney. Toxicol Sci. 2001;60:11–19. doi: 10.1093/toxsci/60.1.11. [DOI] [PubMed] [Google Scholar]
- Dallas CE, Gallo JM, Ramanathan R, Muralidhara S, Bruckner JV. Physiological pharmacokinetic modeling of inhaled trichloroethylene in rats. Toxicol Appl Pharmacol. 1991;110:303–314. doi: 10.1016/s0041-008x(05)80013-4. [DOI] [PubMed] [Google Scholar]
- Dekant W, Metzler M, Henschler D. Identification of S-(1,2-dichlorovinyl)-N-acetyl-cysteine as a urinary metabolite of trichloroethylene: A possible explanation for its nephrocarcinogenicity in male rats. Biochem Pharmacol. 1986;35:2455–2458. doi: 10.1016/0006-2952(86)90039-0. [DOI] [PubMed] [Google Scholar]
- D’Souza RW, Bruckner JV, Feldman S. Oral and intravenous trichloroethylene pharmacokinetics in the rat. J Toxicol Environ Health. 1985;15:587–601. doi: 10.1080/15287398509530688. [DOI] [PubMed] [Google Scholar]
- Elfarra AA, Jakobson I, Anders MW. Mechanism of S-(1,2-dichlorovinyl)glutathione- induced nephrotoxicity. Biochem Pharmacol. 1986;35:283–288. doi: 10.1016/0006-2952(86)90527-7. [DOI] [PubMed] [Google Scholar]
- Fariss MW, Reed DJ. High-performance liquid chromatography of thiols and disulfides: Dinitrophenyl derivatives. Methods Enzymol. 1987;143:101–109. doi: 10.1016/0076-6879(87)43018-8. [DOI] [PubMed] [Google Scholar]
- Fisher JW. Physiologically based pharmacokinetic models for trichloroethylene and its oxidative metabolites. Environ Health Perspect. 2000;108 (Suppl 2):265–274. doi: 10.1289/ehp.00108s2265. [DOI] [PMC free article] [PubMed] [Google Scholar]
- Fisher JW, Gargas ML, Allen BC, Andersen ME. Physiologically based pharmacokinetic modeling with trichloroethylene and its metabolite, trichloroacetic acid, in the rat and mouse. Toxicol Appl Pharmacol. 1991;109:183–195. doi: 10.1016/0041-008x(91)90167-d. [DOI] [PubMed] [Google Scholar]
- Fisher JW, Mahle D, Abbas R. A human physiologically-based pharmacokinetic model for trichloroethylene and its metabolites, trichloroacetic acid and free trichloroethanol. Toxicol Appl Pharmacol. 1998;152:339–359. doi: 10.1006/taap.1998.8486. [DOI] [PubMed] [Google Scholar]
- Goeptar AR, Commandeur JNM, Van Ommen B, van Bladderen PJ, Vermeulen NPE. Metabolism and kinetics of trichloroethylene in relation to toxicity and carcinogenicity. Relevance of the mercapturic acid pathway. Chem Res Toxicol. 1995;8:3–21. doi: 10.1021/tx00043a001. [DOI] [PubMed] [Google Scholar]
- Green T, Dow J, Ellis MK, Foster JR, Odum J. The role of glutathione conjugation in the development of kidney tumours in rats exposed to trichloroethylene. Chem-Biol Interact. 1997;105:99–117. doi: 10.1016/s0009-2797(97)00040-9. [DOI] [PubMed] [Google Scholar]
- Greenberg MS, Burton GA, Fisher JW. Physiologically based pharmacokinetic modeling of inhaled trichloroethylene and its oxidative metabolites in B6C3F(1) mice. Toxicol Appl Pharmacol. 1999;154:264–278. doi: 10.1006/taap.1998.8594. [DOI] [PubMed] [Google Scholar]
- International Agency for Research on Cancer (IARC) Dry cleaning, some chlorinated solvents, and other industrial chemicals. IARC Monogr Eval Carcinog Risks Hum. 1995;63:75–158. [PMC free article] [PubMed] [Google Scholar]
- Keys DA, Bruckner JV, Muralidhara S, Fisher JW. Tissue dosimetry expansion and cross-validation of rat and mouse physiologically based pharmacokinetic models for trichloroethylene. Toxicol Sci. 2003;76:35–50. doi: 10.1093/toxsci/kfg212. [DOI] [PubMed] [Google Scholar]
- Larson LJ, Bull RJ. Effect of ethanol on the metabolism of trichloroethylene. J Toxicol Environ Health. 1989;28:395–406. doi: 10.1080/15287398909531359. [DOI] [PubMed] [Google Scholar]
- Larson JL, Bull RJ. Species differences in the metabolism of trichloroethylene to the carcinogenic metabolites trichloroacetate and dichloroacetate. Toxicol Appl Pharmacol. 1992;115:278–285. doi: 10.1016/0041-008x(92)90333-n. [DOI] [PubMed] [Google Scholar]
- Lash LH, Jones DP. Uptake of the glutathione conjugate S-(1,2-dichlorovinyl)-glutathione by renal basal-lateral membrane vesicles and isolated kidney cells. Mol Pharmacol. 1985;28:278–282. [PubMed] [Google Scholar]
- Lash LH, Elfarra AA, Anders MW. Renal cysteine conjugate β-lyase: Bioactivation of nephrotoxic cysteine S-conjugates in mitochondrial outer membrane. J Biol Chem. 1986;261:5930–5935. [PubMed] [Google Scholar]
- Lash LH, Fisher JW, Lipscomb JC, Parker JC. Metabolism of trichloroethylene. Environ Health Perspect. 2000a;108 (Suppl 2):177–200. doi: 10.1289/ehp.00108s2177. [DOI] [PMC free article] [PubMed] [Google Scholar]
- Lash LH, Jones DP, Anders MW. Glutathione homeostasis and glutathione S-conjugate toxicity in kidney. Rev Biochem Toxicol. 1988;9:29–67. [Google Scholar]
- Lash LH, Lipscomb JC, Putt DA, Parker JC. Glutathione conjugation of trichloroethylene in human liver and kidney: Kinetics and individual variation. Drug Metab Dispos. 1999b;27:351–359. [PubMed] [Google Scholar]
- Lash LH, Nelson RM, Van Dyke RA, Anders MW. Purification and characterization of human kidney cysteine conjugate β-lyase activity. Drug Metab Dispos. 1990;18:50–54. [PubMed] [Google Scholar]
- Lash LH, Parker JC, Scott CS. Modes of action of trichloroethylene for kidney tumorigenesis. Environ Health Perspect. 2000b;108 (Suppl 2):225–240. doi: 10.1289/ehp.00108s2225. [DOI] [PMC free article] [PubMed] [Google Scholar]
- Lash LH, Putt DA, Brashear WT, Abbas R, Parker JC, Fisher JW. Identification of S-(1,2-dichlorovinyl)glutathione in the blood of human volunteers exposed to trichloroethylene. J Toxicol Environ Health. 1999a;56:1–21. doi: 10.1080/009841099158204. [DOI] [PubMed] [Google Scholar]
- Lash LH, Qian W, Putt DA, Jacobs K, Elfarra AA, Krause RJ, Parker JC. Glutathione conjugation of trichloroethylene in rats and mice: Sex-, species-, and tissue-dependent differences. Drug Metab Dispos. 1998;26:12–19. [PubMed] [Google Scholar]
- Lash LH, Qian W, Putt DA, Hueni SE, Elfarra AA, Krause RJ, Parker JC. Renal and hepatic toxicity of trichloroethylene and its glutathione-derived metabolites in rats and mice: Sex-, species-, and tissue-dependent differences. J Pharmacol Exp Ther. 2001;297:155–164. [PubMed] [Google Scholar]
- Lash LH, Xu Y, Elfarra AA, Duescher RJ, Parker JC. Glutathione-dependent metabolism of trichloroethylene in isolated liver and kidney cells of rats and its role in mitochondrial and cellular toxicity. Drug Metab Dispos. 1995;23:846–853. [PubMed] [Google Scholar]
- Lipscomb JC, Fisher JW, Confer PD, Byczkowski JZ. In vitro to in vivo extrapolation for trichloroethylene metabolism. Toxicol Appl Pharmacol. 1998;152:376–387. doi: 10.1006/taap.1998.8485. [DOI] [PubMed] [Google Scholar]
- National Toxicology Program (NTP). 2002. Report on Carcinogens 10thEd., U.S. Department of Health and Human Services, Public Health Service, National Toxicology Program, Research Triangle Park, NC.
- Nomiyama K, Nomiyama H. Metabolism of trichloroethylene in human. Sex difference in urinary excretion of trichloroacetic acid and trichloroethanol. Int Arch Arbeitsmed. 1971;28:37–48. [PubMed] [Google Scholar]
- Stenner RD, Merdink JL, Fisher JW, Bull RJ. Physiologically-based pharmacokinetic model for trichloroethylene considering enterohepatic recirculation of major metabolites. Risk Anal. 1998;18:261–269. doi: 10.1111/j.1539-6924.1998.tb01293.x. [DOI] [PubMed] [Google Scholar]
- Templin MV, Stevens DK, Stenner RD, Bonate PL, Tuman D, Bull RJ. Factors affecting species differences in the kinetics of metabolites of trichloroethylene. J Toxicol Environ Health. 1995;44:435–447. doi: 10.1080/15287399509531972. [DOI] [PubMed] [Google Scholar]
- Uttamsingh V, Anders MW. Acylase-catalyzed deacetylation of haloalkene-derived mercapturates. Chem Res Toxicol. 1999;12:937–942. doi: 10.1021/tx990090p. [DOI] [PubMed] [Google Scholar]
- Wartenberg D, Reyner D, Scott CS. Trichloroethylene and cancer: Epidemiologic evidence. Environ Health Perspect. 2000;108 (Suppl 2):161–176. doi: 10.1289/ehp.00108s2161. [DOI] [PMC free article] [PubMed] [Google Scholar]