Abstract
Haplotype-based techniques are being used to estimate the relative age of alleles—particularly in screening loci for signals of recent positive selection—but does this approach capture even coarse age differences? Using simulations and empirical data from the International HapMap Project, we show that a simple pairwise metric of haplotype homozygosity gives significantly higher mean values for human single-nucleotide–polymorphism alleles that appear to be derived than for those that appear to be ancestral, as determined by comparison with the chimpanzee genome. Our results support the use of haplotype-based techniques, such as extended haplotypic homozygosity, to assess the age of alleles.
Gauging the age of alleles is a critical task in identifying SNPs that have been subject to recent positive selection and in understanding our evolutionary history. A new allele that arises by mutation will lie on a single haplotype, but, over time, the extensive linkage disequilibrium (LD) between the new allele and other markers on this ancestral haplotype breaks down as a result of recombination. Decay of LD around a target allele is considered to be a stopwatch by which its age can be estimated.1
Diverse metrics are employed to measure the LD between markers2; however, common ones, such as D′ and r2, do not differentiate between the alleles at a single locus. Haplotypic homozygosity (the probability of selecting two identical haplotypes at random from a population) is a measure of LD that has the ability to capture information about subgroups, or “partitions,” of haplotypes in the population marked by a specific allele.3 Furthermore, haplotypic homozygosity has recently become the basis of a strategy to detect loci that have undergone partial selective sweeps, by detecting “young” core haplotypes or alleles (as judged by the decay of haplotypic homozygosity) that have reached high frequency.4 Extended haplotypic homozygosity (in which the partitions of haplotypes are marked by a core set of markers) has been applied to detect selection at loci, such as the glucose-6-phosphate dehydrogenase gene,4 the CD40 ligand gene,4 the lactase gene,5 the spinocerebellar ataxia type 2 gene,6 the CCR5-Δ32 mutation,7 and the hemoglobin E variant.8 A related approach, the haplosimilarity score, has been suggested for screening regional data sets and was applied to the hemoglobin S variant.9 The recent publication by the International HapMap Consortium identified a number of outliers in the genomewide distribution of haplotype homozygosity, in the form of the long-range haplotype test statistic, as candidates for recent selective events.10
Haplotype homozygosity metrics are being used in the literature to judge the relative age of alleles, but how sensitive is this approach? Can we test whether even coarse age differences are detected? We employed the chimpanzee genome as an extant out-group for humans, to split alleles into putative ancestral (very old) or derived (much younger) alleles. Then, we investigated whether a simple metric of haplotype homozygosity could be applied at the level of the whole genome to distinguish this broad dichotomy of alleles, which are likely to have very different ages.
First, we employed simulated SNP data to demonstrate the theoretical differences in haplotype homozygosity between ancestral and derived alleles. Second, we repeated this experiment, using empirical data from (1) the HapMap project,10 to examine genomewide trends, and (2) the ENCODE (ENCyclopedia Of DNA Elements) project, to compensate for ascertainment bias. Third, we examined the range of haplotype homozygosity values around ancestral and derived alleles at the same SNPs. Finally, we investigated “private” alleles (see below) as a subset of alleles we expect to contain some particularly young alleles. Our results support the use of haplotype-based techniques, such as extended haplotypic homozygosity4 or the haplosimilarity score,9 to assess the age of alleles.
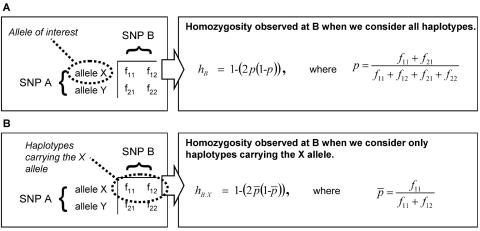
Given that the inference of extended haplotypes from genotype data is computationally intensive and intrinsically error prone, we opted for a simple pairwise metric of haplotypic homozygosity to rapidly investigate genomewide trends. Consider two biallelic SNPs, denoted A and B, where we are particularly interested in allele X of SNP A. We define the following metric:
where hB:X is the homozygosity observed at SNP B when we consider only haplotypes carrying allele X of SNP A, and hB is the homozygosity observed at SNP B when we consider all haplotypes (fig. 1). We are particularly interested in situations where the homozygosity of the partitioned haplotypes is unusually high or low compared with the result expected from the general population. Therefore, we calculated a calibrated partition homozygosity (HX) by subtracting the general-population homozygosity at SNP B (hB) from hB:X.
Figure 1.
Calculation of the HX metric. We define HX=hB:X-hB, where hB:X and hB are calculated as follows. A, Construct the classic 2×2 contingency table for marker combinations between SNPs A and B. Calculate hB, the general population homozygosity at SNP B, as determined by Hardy-Weinberg equilibrium. B, Calculate hB:X, the homozygosity at SNP B on the row, or partition, of haplotypes possessing allele X of SNP A.
A positive value of HX implies that the homozygosity at locus B on haplotypes marked by allele X of SNP A is greater than would be expected, given the population allele frequency of SNP B. An important feature of this metric is that each allele of a single SNP is likely to receive a different HX value, corresponding to the history of that allele.
To assess regional haplotypic homozygosity on haplotypes bearing the X allele of SNP A, we took the simple approach of averaging a target allele’s HX values for a window of nearby comparison SNPs. SNPs found to be monomorphic in a given population were ignored. The choice of window size was based on preliminary work that demonstrated a decay of HX with increasing window size (because of greater average distance between target and comparison SNPs). A window size of 50 kb centered on the target allele contains sufficient markers (∼20 SNPs) to demonstrate our signal clearly; however, alternative window sizes could be employed.
Conventional pairwise measures of LD are closely related to the HX metric. Given the familiar 2×2 table (fig. 1) representing the relationship between two markers and containing the observed pairwise haplotype frequencies—and with the assumption that we regard the population allele frequencies as fixed—there is only 1 df. We can express the relationship between HX and the other metrics with the following equations:
 |
and
 |
Here, fA, fa, fB, and fb are the major- and minor-allele frequencies of SNPs A and B, whereas HA and Ha are the partition haplotype homozygosities (HX values) for the A and a alleles of SNP A, respectively. If fB=fb (i.e., if SNP B has minor-allele frequency 0.5), D is simply  , which is of magnitude
  , but the sign is arbitrary because, in this case, the assignment of one allele as major and the other as minor is meaningless. To consider this in biological terms, r2 is the sum of the (scaled) homozygosities of two alleles—the histories of both alleles contribute to the overall correlation of the SNP—whereas D is related to the appropriately weighted difference between the homozygosities of the two alleles.
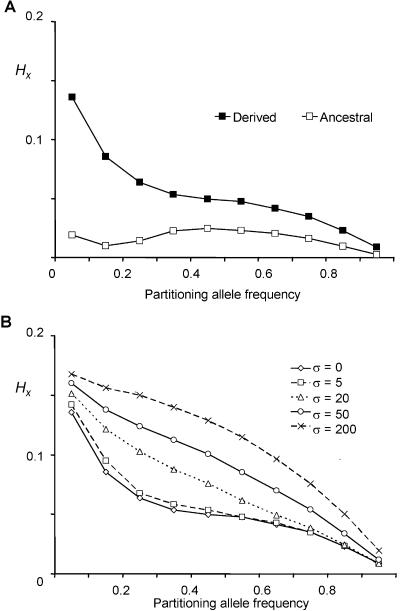
To explore the properties of the HX metric in a system for which the properties of the data are clearly known, we performed coalescent simulations of a 50-kb genomic sequence, using SelSim,11 version 2.1. The central SNP was set to attain specific allele frequencies (0.05, 0.15, 0.25, 0.35, 0.45, 0.55, 0.65, 0.75, 0.85, and 0.95), and the target allele was modeled (1) as a neutral site and (2) as an allele undergoing positive selection with different selection coefficients. The effective population size was Ne=10,000, with 1 SNP every 300 bp and a uniform population-scaled recombination rate of ρ=0.4/kb (∼1 cM/Mb). At the end of each simulation, 120 chromosomes were sampled from the population. Mean HX values and SEMs were calculated for the region. One thousand simulations were run for each particular setting. Regional HX and SEM values were averaged across the 1,000 runs for a given allele frequency (fig. 2).
Figure 2.
Comparison of mean regional HX values for ancestral and derived alleles for simulated data sets, with the central target allele set to attain a range of frequencies. A, Ancestral and derived alleles modeled as neutral sites. B, Derived alleles under positive selection with different population-scaled selection coefficients (σ=2Ns, where 2N is the population size and s is the selection coefficient). Each simulation was run 1,000 times for a given allele frequency. SEMs were always <0.00045—well within the symbols shown. As expected, HX values decay with increasing allele frequency. Haplotype homozygosity was preserved on haplotypes marked by derived alleles and around alleles that have undergone rapid positive selection.
The allele frequency of a derived allele has a direct relationship to age,12 and, as predicted from theory, the simulations demonstrated haplotypic homozygosity decaying with allele frequency. The simulated data suggested that, throughout the frequency range, derived alleles tend to have higher mean regional HX values than those of ancestral alleles. As expected, simulated alleles undergoing selective sweeps due to positive selection reached their target frequencies earlier and therefore retained greater regional haplotypic homozygosity.
We analyzed empirical genomewide trends in haplotypic homozygosity for ancestral and derived alleles. SNP genotypes were downloaded from HapMap release 16c.1 (phase 1, June 2005), along with ∼18,000 SNPs from the ENCODE regions. Pairwise relationships between nearby SNPs were determined from genotypes of paired markers by use of an expectation-maximization algorithm. We determined the putative ancestral state for 964,842 HapMap SNPs by comparison with the Pan troglodytes genome (CHIMP1, November 2003). The implicit assumption with this approach is that, for the vast majority of loci, where the Homo sapiens genome is presently polymorphic, the Pan troglodytes genome remains in the state of our most recent common ancestor. This is a practical approximation with an estimated error rate for typical SNPs of ∼0.5% (outside a CpG context) and an overall error rate of ∼1.6%.13
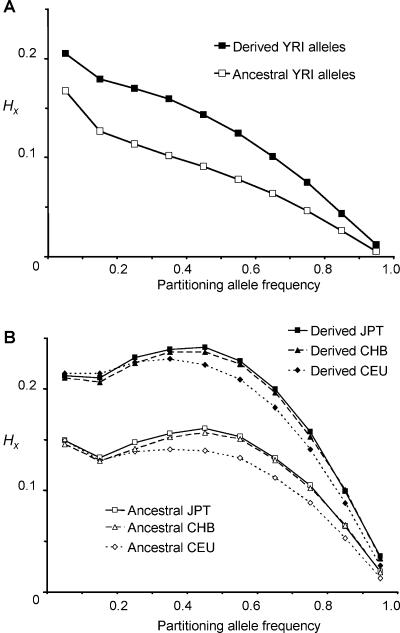
Regional HX values for each HapMap allele were binned by target (i.e., SNP A) allele frequency. Then, the mean values for these bins were plotted separately for ancestral and derived alleles. This was performed for all four HapMap populations (fig. 3): Yoruba from Ibadan, Nigeria (YRI); Japanese from Tokyo (JPT); Chinese Han from Beijing (CHB); and CEPH individuals from Utah (with northern and western European ancestry) (CEU). We found that haplotypes marked by derived alleles generally had higher regional haplotypic homozygosity throughout the frequency spectrum and in all populations. Alleles from the YRI had lower regional haplotypic homozygosity values than those from the Asian and European populations (CEU, CHB, and JPT), which all follow very similar patterns. The downward trend of haplotypic homozygosity with increasing allele frequency was confirmed—although the JPT, CHB, and CEU populations follow an apparently parabolic distribution. This analysis highlights the very different haplotypic structures between the YRI and the other three HapMap populations and reinforces the view that, because of their different demographic histories, the YRI have a relatively low genomewide LD, compared with Asian and European populations.14
Figure 3.
Comparison of mean regional HX values for ancestral and derived alleles for HapMap SNPs, binned by partitioning allele frequency—that is, the frequency of the target SNP A allele X. A, Data from 1,379,358 YRI alleles. B, Asian and European populations. Data from 1,194,358 JPT alleles, 1,307,740 CEU alleles, and 1,119,766 CHB alleles are plotted. SEMs were between 0.00002 and 0.0004—well within the symbols shown. Haplotypes marked by derived alleles had, on average, higher regional haplotypic homozygosity throughout the frequency spectrum and in all populations.
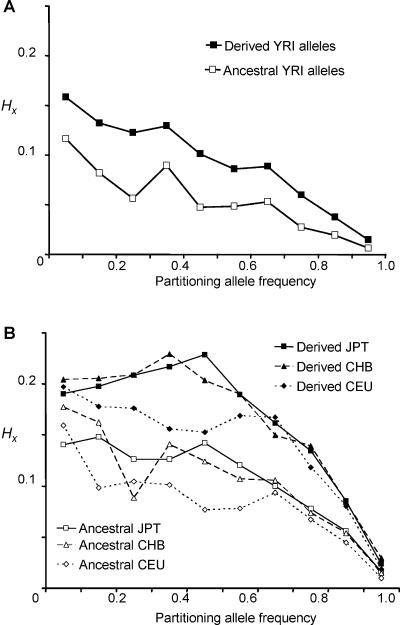
It is well established that the ascertainment strategy employed in the HapMap project (resequencing of a small SNP discovery panel, followed by targeted genotyping in all samples) has led to a bias against the genotyping of rare alleles. Regional statistical attributes that depend on the spectrum of allele frequencies, such as nucleotide diversity, Tajima’s D, FST, and LD (including HX), will be affected by this ascertainment bias.15 The density of HapMap phase 1 data means that the sampling window around a partitioning SNP contains only a proportion of the alleles actually present; however, the sampled alleles are skewed toward intermediate and high frequencies. To empirically determine whether the trends in HX difference between ancestral and derived alleles would remain after correction for ascertainment bias, we used ENCODE data. The ENCODE regions comprise ten 500-kb regions fully resequenced in 16 CEU, 16 YRI, 8 CHB, and 8 JPT samples. The polymorphisms found were genotyped in all 270 HapMap samples. Thus, the ENCODE data should be free of ascertainment bias. Regional HX values for alleles in ENCODE regions were calculated and then binned by SNP A allele frequency. The mean values for these bins were plotted separately for ancestral and derived alleles. This was performed for all four HapMap populations (fig. 4). Using the ENCODE data, we noted a reduction in average HX values; however, the general trends remained. Haplotypes marked by derived alleles generally had higher regional haplotypic homozygosity throughout the frequency spectrum and in all populations than did the ancestral alleles. Alleles from the YRI had lower regional haplotypic homozygosity values than alleles from the Asian and European populations, and there was still a decay of haplotypic homozygosity with increasing allele frequency. The lower HX values calculated from ENCODE data, particularly YRI data, were closer to our simulations of HX than those from phase 1 HapMap data. The remaining differences between the empirical and simulated data are likely the result of the simplicity of our simulated system, with uniform recombination, evenly spaced SNPs, and lack of demographic events.
Figure 4.
Comparison of mean regional HX values for ancestral and derived alleles of SNPs in the ENCODE regions, binned by partitioning allele frequency—that is, the frequency of the target SNP A allele X. A, Data from 15,614 YRI alleles. B, Asian and European populations. Data from 12,084 JPT alleles, 15,166 CEU alleles, and 11,042 CHB alleles are plotted. SEMs were between 0.000046 and 0.0018—well within the symbols shown. Even with complete SNP ascertainment, haplotypes marked by derived alleles had, on average, higher regional haplotypic homozygosity throughout the frequency spectrum and in all populations.
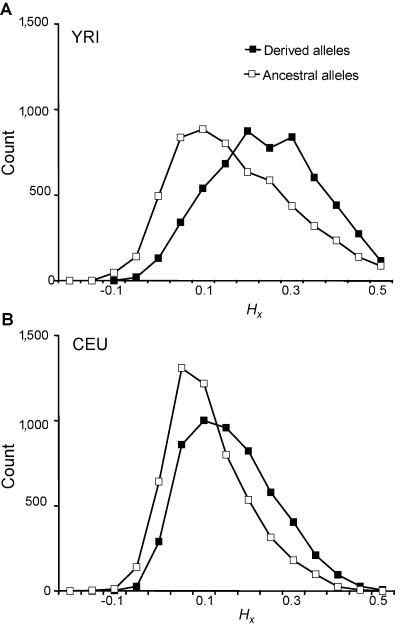
To compare regional HX values for ancestral and derived alleles at the same loci, we additionally analyzed SNPs with allele frequency of exactly 0.5, thus controlling for variation in HX with allele frequency. Histograms of HX distribution for ancestral and derived alleles from the CEU and YRI were plotted (fig. 5). Using a paired t test (two-tailed), we found a statistically significant difference between the regional HX values for ancestral and derived alleles for both the YRI (P=1×10-192) and the CEU (P<1×10-200). A nonancestral allele at frequency 0.5 had a higher regional haplotypic homozygosity value than its partner ancestral allele at the same SNP in ∼65.8% of YRI SNPs and 71.5% of CEU SNPs.
Figure 5.
Histograms demonstrating the range of HX values for ancestral and derived alleles with frequency 0.5. A, Data from 5,276 SNPs of the YRI population. B, Data from 5,630 SNPs of the CEU population. Although both ancestral and nonancestral alleles can have a wide distribution of values, nonancestral alleles generally had higher regional HX scores.
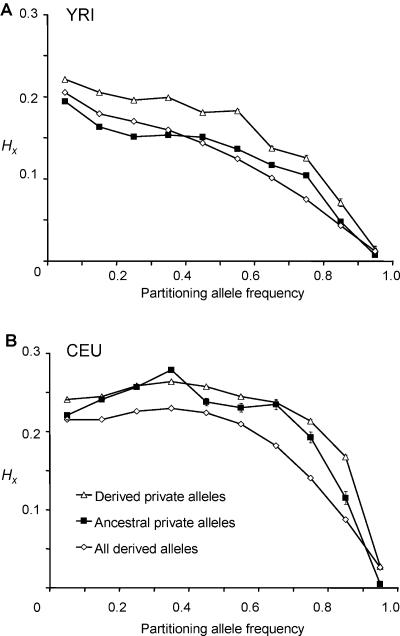
The majority of HapMap phase 1 SNPs (∼650,000) are polymorphic in all four populations, which suggests that, in general, the original mutations occurred some time before the groups separated. In contrast, “private” alleles (alleles found in only one population) should include a subset of particularly recent mutations. We investigated YRI private alleles (alleles polymorphic in YRI but not in any other HapMap population) and CEU alleles not seen in the YRI. The CEU, CHB, and JPT share many of the alleles not seen in YRI, so rather than studying the relatively small number of completely private alleles in the CEU, we investigated only those CEU alleles that were private in relation to YRI alone.
Many private alleles actually represent older mutations that occurred in the progenitor population before it split and, because of either lack of transmission or subsequent fixation, have become monomorphic in all but one of the populations. Therefore, we compared private derived alleles with private ancestral alleles. We expected private derived alleles to be enriched for young mutations specific to one population. In contrast, a population's private ancestral alleles are likely to represent old alleles that were present in the precursor population but have subsequently been lost from the comparison population(s). The plotted data (fig. 6) show that both types of private alleles were associated with elevated regional haplotype homozygosity values in the CEU and YRI. However, in general, private derived alleles scored higher than nonprivate alleles and private ancestral alleles (particularly in the YRI). This is consistent with our expectation that the private derived alleles are enriched for a subset of particularly recent mutations.
Figure 6.
Comparison of mean regional HX values for private derived alleles, private ancestral alleles, and all derived alleles, binned by partitioning allele frequency. A, Data from 62,207 YRI private derived alleles, 15,349 YRI private ancestral alleles, and 689,679 general derived alleles. B, Data from CEU alleles (as representative of the three Asian and European populations) that were private in relation to the YRI, including 41,312 CEU private derived alleles and 3,127 CEU private ancestral alleles, and from 653,870 general derived alleles. SEMs are plotted. Partitions marked by private derived alleles had higher regional haplotypic homozygosity than either general derived alleles or private ancestral alleles, in the majority of partitioning allele-frequency bins.
In these experiments, partitions of haplotypes marked by ancestral alleles gain haplotypic homozygosity as they fall in frequency. Demographic events such as founder effect, population bottlenecks, or admixture are likely to generate LD on haplotypes bearing ancestral and derived alleles. This is the most probable explanation of the high HX values in the Asian and European populations. In our simulated data sets for which demographic events are absent, the ancestral allele can still pick up some haplotypic homozygosity as it drops in frequency; one possibility is that it picks up LD by recombination with the homogenous haplotypes bearing the derived allele. Alternatively, as a partition of haplotypes becomes rarer, LD is generated relatively faster by genetic drift than it is removed by recombination.16 The existence of a minority of SNPs where the ancestral allele is misidentified could explain part of this trend, particularly the high HX values seen among private ancestral alleles. In the future, a range of primate genomes could be used to predict ancestral alleles with greater accuracy. A final consideration is the effect of measuring haplotype homozygosity in a finite sample size. This leads to exaggeration of the HX metric in rare partitions (e.g., a partition represented by 1 chromosome of 120 will automatically have maximum haplotype homozygosity). This is an issue in the first and second partitioning allele-frequency bins (a partition size of <10–20 chromosomes of 120), particularly when the population frequency of the comparison SNP (SNP B; see fig. 1) is close to 0.5, but rapidly diminishes thereafter.
To conclude, techniques such as haplotypic homozygosity are being used to estimate the date of origin of genetic variants thought to have undergone recent selection. The ability to reliably differentiate old and young alleles is critical to this strategy. Although other, more sophisticated haplotype-based methods may exist, we have shown here that a simple metric of haplotype homozygosity that can be rapidly applied to the whole genome can distinguish between alleles of broadly different ages.
Acknowledgments
This work was funded by a Wellcome Trust Clinical Research Training Fellowship (to A.E.F.) and by the Medical Research Council.
References
- 1.Stephens JC, Reich DE, Goldstein DB, Shin HD, Smith MW, Carrington M, Winkler C, et al (1998) Dating the origin of the CCR5-Δ32 AIDS-resistance allele by the coalescence of haplotypes. Am J Hum Genet 62:1507–1515 [DOI] [PMC free article] [PubMed] [Google Scholar]
- 2.Guo SW (1997) Linkage disequilibrium measures for fine-scale mapping: a comparison. Hum Hered 47:301–314 [DOI] [PubMed] [Google Scholar]
- 3.Sabatti C, Risch N (2002) Homozygosity and linkage disequilibrium. Genetics 160:1707–1719 [DOI] [PMC free article] [PubMed] [Google Scholar]
- 4.Sabeti PC, Reich DE, Higgins JM, Levine HZ, Richter DJ, Schaffner SF, Gabriel SB, Platko JV, Patterson NJ, McDonald GJ, Ackerman HC, Campbell SJ, Altshuler D, Cooper R, Kwiatkowski D, Ward R, Lander ES (2002) Detecting recent positive selection in the human genome from haplotype structure. Nature 419:832–837 10.1038/nature01140 [DOI] [PubMed] [Google Scholar]
- 5.Bersaglieri T, Sabeti PC, Patterson N, Vanderploeg T, Schaffner SF, Drake JA, Rhodes M, Reich DE, Hirschhorn JN (2004) Genetic signatures of strong recent positive selection at the lactase gene. Am J Hum Genet 74:1111–1120 [DOI] [PMC free article] [PubMed] [Google Scholar]
- 6.Yu F, Sabeti PC, Hardenbol P, Fu Q, Fry B, Lu X, Ghose S, Vega R, Perez A, Pasternak S, Leal SM, Willis TD, Nelson DL, Belmont J, Gibbs RA (2005) Positive selection of a pre-expansion CAG repeat of the human SCA2 gene. PLoS Genet 1:e41 10.1371/journal.pgen.0010041 [DOI] [PMC free article] [PubMed] [Google Scholar]
- 7.Sabeti PC, Walsh E, Schaffner SF, Varilly P, Fry B, Hutcheson HB, Cullen M, Mikkelsen TS, Roy J, Patterson N, Cooper R, Reich D, Altshuler D, O’Brien S, Lander ES (2005) The case for selection at CCR5-Δ32. PLoS Biol 3:e378 10.1371/journal.pbio.0030378 [DOI] [PMC free article] [PubMed] [Google Scholar]
- 8.Ohashi J, Naka I, Patarapotikul J, Hananantachai H, Brittenham G, Looareesuwan S, Clark AG, Tokunaga K (2004) Extended linkage disequilibrium surrounding the hemoglobin E variant due to malarial selection. Am J Hum Genet 74:1198–1208 [DOI] [PMC free article] [PubMed] [Google Scholar]
- 9.Hanchard N, Rockett K, Spencer C, Coop G, Pinder M, Jallow M, Kimber M, McVean G, Mott R, Kwiatkowski DP (2006) Screening for recently selected alleles by analysis of human haplotype similarity. Am J Hum Genet 78:153–159 [DOI] [PMC free article] [PubMed] [Google Scholar]
- 10.Altshuler D, Brooks LD, Chakravarti A, Collins FS, Daly MJ, Donnelly P (2005) A haplotype map of the human genome. Nature 437:1299–1320 10.1038/nature04226 [DOI] [PMC free article] [PubMed] [Google Scholar]
- 11.Spencer CC, Coop G (2004) SelSim: a program to simulate population genetic data with natural selection and recombination. Bioinformatics 20:3673–3675 [DOI] [PubMed] [Google Scholar]
- 12.Kimura M, Ota T (1973) The age of a neutral mutant persisting in a finite population. Genetics 75:199–212 [DOI] [PMC free article] [PubMed] [Google Scholar]
- 13.Chimpanzee Sequencing and Analysis Consortium (2005) Initial sequence of the chimpanzee genome and comparison with the human genome. Nature 437:69–87 10.1038/nature04072 [DOI] [PubMed] [Google Scholar]
- 14.Reich DE, Cargill M, Bolk S, Ireland J, Sabeti PC, Richter DJ, Lavery T, Kouyoumjian R, Farhadian SF, Ward R, Lander ES (2001) Linkage disequilibrium in the human genome. Nature 411:199–204 10.1038/35075590 [DOI] [PubMed] [Google Scholar]
- 15.Clark AG, Hubisz MJ, Bustamante CD, Williamson SH, Nielsen R (2005) Ascertainment bias in studies of human genome-wide polymorphism. Genome Res 15:1496–1502 10.1101/gr.4107905 [DOI] [PMC free article] [PubMed] [Google Scholar]
- 16.Terwilliger JD, Zollner S, Laan M, Paabo S (1998) Mapping genes through the use of linkage disequilibrium generated by genetic drift: “drift mapping” in small populations with no demographic expansion. Hum Hered 48:138–154 10.1159/000022794 [DOI] [PubMed] [Google Scholar]


