Abstract
A chromosome in an individual of recently admixed ancestry resembles a mosaic of chromosomal segments, or ancestry blocks, each derived from a particular ancestral population. We consider the problem of inferring ancestry along the chromosomes in an admixed individual and thereby delineating the ancestry blocks. Using a simple population model, we infer gene-flow history in each individual. Compared with existing methods, which are based on a hidden Markov model, the Markov–hidden Markov model (MHMM) we propose has the advantage of accounting for the background linkage disequilibrium (LD) that exists in ancestral populations. When there are more than two ancestral groups, we allow each ancestral population to admix at a different time in history. We use simulations to illustrate the accuracy of the inferred ancestry as well as the importance of modeling the background LD; not accounting for background LD between markers may mislead us to false inferences about mixed ancestry in an indigenous population. The MHMM makes it possible to identify genomic blocks of a particular ancestry by use of any high-density single-nucleotide–polymorphism panel. One application of our method is to perform admixture mapping without genotyping special ancestry-informative–marker panels.
The genome of an admixed individual represents a mixture of alleles inherited from multiple ancestral (or parental) populations. If the admixing occurred recently, we can imagine that each chromosome was assembled by stitching together long segments of DNA from a particular ancestral population; as a result, changes in ancestry occur only at the “stitch points.” We refer to these chromosomal segments as “ancestry blocks.” The distribution of block sizes depends on when the indigenous populations came into contact; more-recent gene flow gives rise to longer ancestral chromosome blocks on average. Inferences regarding the ancestry of admixed individuals not only are intriguing to population geneticists and anthropologists but also are becoming essential in gene discovery and characterization studies. Because of the potential confounding due to stratification among the ancestral populations, conventional case-control association studies in admixed groups need to adjust for ancestry structure. Moreover, descendants from matings between reproductively isolated ancestors, admixed populations offer unique opportunities to unravel the genetic and environmental components of a variety of diseases. The idea of using admixed populations to map genetic disease loci can be traced to Rife.1 The rationale of admixture mapping (or mapping by admixture linkage disequilibrium [MALD]) is that, if one of the ancestral populations carries a risk allele at a higher frequency than the other(s), then affected individuals are expected to share a greater level of ancestry from that population around that disease susceptibility locus, compared with the background ancestry level in the genome or compared with the ancestry sharing among unaffected individuals around the same location. The past decade has seen an emergence of theoretical calculations and methods development supporting the application of the method to gene mapping studies in humans.2–7 For all current MALD methods, the efficiency of the design depends on the accuracy with which one can infer the ancestry at any chromosome location.
Several approaches have been proposed to estimate ancestry at specific genomic locations4–6,8; all of them feature a hidden Markov model (HMM), which offers a succinct and computationally efficient framework.9 HMMs have been successfully used to model a myriad of biological processes; examples include linkage analysis,10 sequence alignment,11 nucleotide evolution,12 and DNA copy-number alterations.13 For ancestry inference, an HMM extracts more information than does a single-marker analysis, by combining observed genotypes at neighboring markers. This is because most genetic variation is shared across ancestral populations, and so, typically, a single allele does not allow unambiguous inference regarding ancestry at that location.14 Additionally, the simple structure of an HMM enables it to be augmented into more-complicated models. Thus, several existing approaches for estimating locus-specific ancestry integrate an HMM into a Markov chain Monte Carlo (MCMC) method, which accounts for uncertainties in model parameters, such as difference in allele frequencies between the true ancestors and their contemporary surrogates.4,5,8 These extensions allow more-accurate point estimates of ancestry as well as a more comprehensive assessment of sampling variability in the estimates. For the estimation of ancestry blocks, Seldin et al.15 used the program PHASE16 to estimate haplotypes in a 60-cM region in Europeans, Africans, and African Americans and inferred ancestry of the estimated African American haplotypes. However, our simulations demonstrate that haplotype inference at the level of an entire chromosome is often infeasible by use of autosomal genotypes in unrelated individuals.
As high-throughput genotyping platforms become available, it is now practical to genotype 1,000–500,000 SNPs in an individual in a single experiment. By inference of ancestry at dense locations along a chromosome, these large data sets offer opportunities to reconstruct the ancestry blocks; in other words, we can infer ancestry even at locations between markers. At the same time, however, high-density genotype data pose a major obstacle for HMM-based analytic approaches. The basic assumption of an HMM, which makes it computationally tractable, is that the observed states are independent conditional on the hidden state (see the “Methods” section). In genetic terms, this amounts to requiring the alleles to be independent, given the ancestral state. Clearly, these assumptions are violated when the marker map is dense and linkage disequilibrium (LD) exists within an ancestral population. Several authors have pointed out that this type of LD, referred to as “background LD,” poses a problem for HMM-based models.8,17,18 However, modeling haplotype structure within each ancestral population is computationally intractable.8
In this article, we propose an extended model, which we refer to as the “Markov–hidden Markov model” (MHMM), that accounts for background LD without a great sacrifice in computational efficiency. With phased data or the X chromosome in males, our algorithm infers ancestry blocks. If only unphased genotypes are available, we reconstruct diploid ancestry blocks; as we explain below, this means that we infer ancestry blocks up to a permutation of phase. Our simulation illustrates that the genotyping of markers at a density comparable to Affymetrix’s 100K SNP chip allows accurate inference of diploid ancestry blocks; at this density, however, background LD must be accounted for. We envision that the MHMM will prove useful in a variety of analyses of high-density SNP genotype data. In the area of disease association studies, our approach makes it possible to perform admixture mapping by use of any high-density genotyping platform. In the “Discussion” section, we explain why this is important.
Methods
This section describes the population model and statistical methods for estimating ancestry along a chromosome.
Data and Biological Model
We assume that each admixed individual is genotyped at T linked biallelic SNPs on a chromosome and that the recombination distance between consecutive markers, dt, t={2,3,…,T} (in Morgans), is known without error. Further, we assume individuals representing each of N ancestral populations have been genotyped at the corresponding marker loci, and, on the basis of these genotypes, we infer ancestral allele frequencies. The importance of including these individuals is discussed by Tang et al.19 We present methods for both phased and unphased data. However, to facilitate the exposition, we lay out the conceptual framework assuming genotypes are phased—that is, haplotypes are available. Our method for phased data may apply in a few special situations, such as in studying the X chromosome in males. Additionally, when samples are analyzed from parents-offspring trios, in which all individuals are genotyped, a majority of marker loci can be phased unambiguously. Markers at which both the parents and the child are heterozygous cannot be phased with certainty; however, chromosomal phase can often be inferred with high confidence on the basis of genotypes at neighboring markers.
Our primary goal is to recover the unobservable ancestry along the chromosomes. As described above, in an individual with recent admixture, we can imagine his or her genome as a mosaic of ancestry blocks. Since the resolution of admixture analyses depends on the length of these ancestral chromosome blocks,4 we are also interested in examining the variation in block sizes among individuals. For an admixed population with more than two ancestral populations, we expect the distribution of block size to differ depending on the ancestral state, because the indigenous populations may have come into contact at different times. As we will explain below, one important parameter in our model is τ={τ1,…,τN}, where the inverse of τi reflects the average length of chromosome blocks derived from ancestral population i. We estimate τ for each individual. If, in a person’s genealogy, gene flow from each ancestral population occurs in a single generation, then  is an estimate of the time (in generations) since admixing.8 Since gene flow may have occurred over many generations continuously, one should be cautious about equating τ with the admixing time. Nonetheless, this parameter provides some information regarding average time of gene flow.
The MHMM
Let {Oft}Tt=1 denote a haplotype of observed alleles along a chromosome, say the paternally inherited chromosome of an admixed individual; correspondingly, denote the unobservable ancestral states along this chromosome as {Zft}t. The maternally inherited haplotype and its corresponding ancestral states can be similarly defined and are denoted as {Omt}t and {Zmt}t, respectively. Conditional on model parameters, we model the ancestral states along the paternal and the maternal chromosomes as two independent and identical Markov processes. We wish to point out that this model is only approximate. First, because of the constraints imposed by an underlying genealogy, the process along each chromosome is not Markovian.20 Second, the paternal side of the genealogy and the maternal side of the genealogy may have different levels of admixture, and, therefore, the two processes are not necessarily identical. Finally, we assume that matings are random with respect to ancestry, an assumption that may be violated in some populations. Future work may allow modeling of asymmetric and nonrandom admixing history in a pedigree. For unphased data, we will use the shorthand notation Ot={g1,g2} to denote the unordered genotypes and Zt={Zft,Zmt} to denote the ordered ancestral states combination. Because we analyze each individual independently, we do not need the index for an individual.
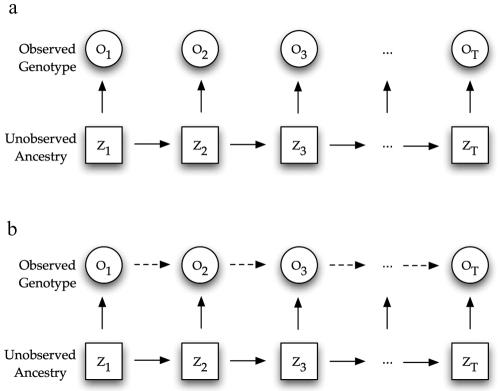
The MHMM, with which we propose to model the relationship between the unobservable ancestral states and the observed haplotype along each chromosome, is an example of a Markov-switching model.21 As illustrated in figure 1a, in an HMM, the observed states, Of, are conditionally independent given the underlying unobservable states, Zf—that is,
In contrast, in a Markov-switching model (compare fig. 1b), the observed state Oft* depends not only on Zft* but also on the past history, {Zft}t<t* and {Oft}t<t*. Ideally, we would model the background haplotype structure within each ancestral population by allowing Oft* to depend on the entire past history. As such a model becomes computationally intractable, we make a compromise and consider only the first-order Markovian dependency along a haplotype. Thus,
 |
In other words, if the ancestral state switches between markers t-1 and t, the probability of the observed allele depends on only the ancestral allele frequencies at marker t. On the other hand, if the ancestral states do not change between markers t-1 and t, then the probability of observing an allele is proportional to the ancestral two-marker haplotype frequency.
Figure 1. .
Graphical representation of an HMM (a) and an MHMM (b).
As in an HMM, three sets of parameters specify the MHMM: the initial-states distribution (π), the transition matrices (𝒜={𝒜t}), and the emission probabilities (ℬt). For simplicity, we will denote λ={𝒜,ℬ,π}. The initial-states distribution and the transition matrices specify the distribution and conditional distribution of the hidden variables. Falush et al.,8 for example, adopted the following initial-states distribution and transition probabilities: P(Z1=i∣π)=πi, (i=1,…,N), and, for 1<t⩽T,
 |
where a multinomial probability vector π represents the genomewide average admixture of the individual. Under a simple intermixing model and when dt is measured in Morgans, τ has the interpretation of the time since admixing.8 In the “Transition Matrix” section, we discuss how we formulate a transition matrix that allows multiple admixing times.
In an HMM, the emission probability describes the distribution of Oft given Zft. A natural choice of emission probabilities at a marker is the allele frequencies in each ancestral population. In the MHMM, we require additionally the joint distribution of alleles at two neighboring markers. The emission probability at marker t is defined by
 |
where  denotes the frequency of allele v in ancestral population j, whereas
  denotes the probability of observing allele v at marker t, conditioned on observing allele u at marker t-1, given that both alleles are derived from ancestral population j.
Efficient computational algorithms have been developed for HMMs and include (1) the forward algorithm, which computes the likelihood of a parameter set given the observed data; (2) the backward algorithm, which, combined with the forward algorithm, estimates the posterior distribution of the hidden state at each observation; (3) the Viterbi algorithm, which searches for the sequence of hidden states that is jointly most likely; and (4) the Baum-Welch method, an expectation-maximization (EM)–based algorithm for estimating the model parameters. An excellent tutorial with examples can be found in the work of Rabiner.22 In the following sections, we explain how to adapt the forward and backward algorithms to compute the likelihood of a parameter set, to estimate the posterior probability of the hidden states in the MHMM, and to sample the sequences of hidden states according to the posterior likelihood.
Likelihood Computation
This section describes modified forward algorithms, which enable us to compute the log likelihood, ℓ, of a parameter set, λ, given genotype data (phased or unphased) on a chromosome:
First, let us assume that phase information is available and that, conditional on λ, {Zft}t and {Zmt}t are independent:
The forward algorithm for computing ℓ(λ∣Of1,…,OfT) closely resembles the corresponding algorithm for an HMM.23
Algorithm 1: forward algorithm for phased data
Define αft(i)=P(Of1,…,Oft,Zft=i∣λ). These variables are computed inductively in three steps.
-
1. Initialization.

-
2. Induction. For 1<t⩽T,
where 𝒜ij stands for the shorthand notation 𝒜ij(t-1).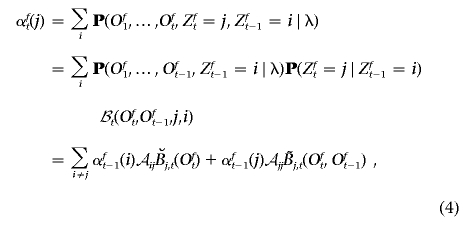
-
3.
Termination. The likelihood of the parameters can be computed by
 .
.
To improve numerical stability, we compute the induction step using a rescaled version of αft that sums to 1 and denote the left-hand side in equation (4) as  . Let
. Let  . It can be shown that the log likelihood is:
To analyze unphased genotype data in a diploid organism, we need to keep track of the phase between consecutive pairs of markers. We introduce a set of variables, Xt. Recall {g1,g2} denotes the (arbitrarily) ordered pairs of alleles at a marker, and Om and Of indicate the maternally and paternally inherited alleles. Then, define
 |
Note that Xt=0 if the genotype at marker t is homozygous (g1=g2). Algorithm 1 can be modified to compute the likelihood in equation (3). Define
These variables are computed in three steps:
-
1. Initialization.
and

-
2. Induction. For 1<t⩽T,
where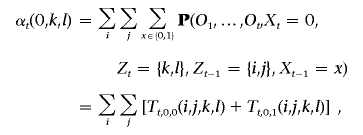
and, when Ot-1 is heterozygous,
If Ot-1 is homozygous, Tt,0,1(i,j,k,l)=0. When Ot is heterozygous, we compute αt(1,k,l) in a similar fashion; otherwise, this term is simply 0.
-
3. Termination. As in the algorithm for the phased data, we define a scaled α-matrix in the induction for numerical stability,
and compute the log likelihood of the parameter by

In genomewide association studies and admixture mapping studies, genotypes are often available from all chromosomes. Under the assumption that the hidden processes on all chromosomes are generated independently by identical parameters, the log likelihood computed on each chromosome can be summed. The parameter, τ, approximates the average time since admixing and is of particular interest in admixture studies. Assuming other parameters are known without error, we can use a grid search or the Newton-Raphson algorithm to find the maximum-likelihood estimates (MLEs) of τ.
Posterior Probability of Ancestral States
For phased data, we estimate the marginal posterior probability that an allele (say, the paternally inherited allele) originates from a specific ancestral population. Our approach to computing these probabilities is an extension of the computation for an HMM.22 Define
 |
We then compute the posterior probability at each allele by
 |
The αf-matrix is computed using algorithm 1, described in the previous section. Analogously, we modify the backward algorithm to compute the βf-matrix.
For unphased data, we estimate the posterior probability that a randomly chosen allele at marker t has ancestry from a specific population. Define
and
 |
The marginal posterior probability for an allele is computed by
 |
The quantity  represents the excess ancestry at marker t. Several admixture mapping approaches aim to locate markers at which this quantity deviates from zero in affected individuals but not in healthy controls.3,5,6
Posterior Sample of Ancestry Blocks
In HMM literature, the Viterbi algorithm was developed to find the single best-state sequence. In phased data, this is the sequence of ancestral states, which jointly achieves the maximum likelihood given a haplotype. In practice, however, this sequence does not capture all the information; we may want to know, for example, whether there are many other likely sequences of states. For unphased data, an additional complication arises that one cannot unambiguously phase the ancestral states. To see this, suppose the true ancestral sequences along the two haplotypes are {ABA} and {BBB}, where A and B denote the two ancestral populations. By the Markov property, the true ancestral sequences cannot be distinguished from the configuration of {ABB} along one haplotype and {BBA} on the other. This makes it difficult to study, for example, the length of ancestral chromosome blocks. To overcome this difficulty and to gain additional information about the likelihood surface, we choose to sample ancestral sequences from the posterior distribution; in fact, because we put a noninformative prior on all possible ancestral sequences, the single most likely ancestral sequence configuration selected by the Viterbi algorithm is the posterior mode. In this section, we describe an algorithm for sampling sequences of ancestral states according to the posterior probability of the entire sequence.
As before, we first consider phased data. This algorithm bears close resemblance to the backward Gibbs sampling step in STRUCTURE.8 To begin, sample ZT according to the distribution P(ZfT=j)∝αfT(j). Subsequently, iteratively sample Zt according to
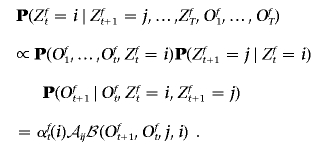 |
For unphased data, we sample
and, subsequently,
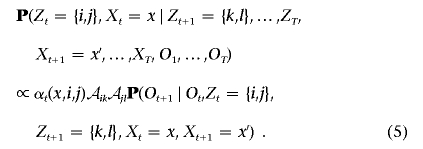 |
The last term in equation (5) is the emission probability, which depends on the phase indicators, Xt and Xt+1, and can be evaluated in a similar fashion as we computed the Tx,i,j terms in the modified forward algorithm.
Transition Matrix
The transition matrix models the probability with which the ancestry switches between two consecutive markers. The transition matrix implemented in STRUCTURE8 models a simple intermixing process, which assumes that all chromosomes in the sampled admixed subjects descended from a mixed group of ancestral chromosomes g generations ago, who have subsequently mated randomly.24 Under this model, the transition matrix specified in equation (1) has several appealing properties: it guarantees that the stationary distribution of the Markov chain coincides with the genome-average individual admixture (IA); it applies for an arbitrary number of ancestral populations; and, when intermarker distance is measured in Morgans, the parameter τ has an approximate interpretation as the admixing time, g. The transition matrix that represents a continuous gene-flow model has been worked out by Zhu et al.6 The result, however, applies only to the two-ancestral population case and becomes cumbersome to derive as the number of populations increases.
Here, we extend the transition matrix of Falush et al.8 to reflect different admixing times for N (N⩾3) parental populations. Let τn, n∈1,…,N, be the inverse of the expected length of the chromosome blocks that are derived from ancestral population n. Define the N-by-N matrix Q by
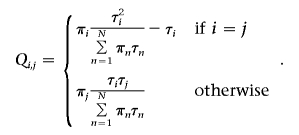 |
Qij represents the instantaneous rate of transition from ancestral state i to j. Our formulation of the transition rate is based on two observations. First, given the current state i, the waiting time to the first jump (point of recombination that may lead to a change in ancestral state) follows an exponential distribution with an expectation inversely proportional to the number of meioses since admixing (τi). Second, holding the stationary distribution, π, constant, the probability of switching into a given state should be inversely related to the expected length of time that the Markov process stays in that state. Therefore, we choose the new state with a probability proportional to πiτi. The stationary distribution, taken as the genome-average ancestry, can be estimated jointly with other parameters. However, for high-density genotype data, in which many markers are tightly linked, it is computationally more efficient to estimate the stationary distribution by using a subset of weakly linked markers and existing methods8,4,19 (X. Zhu, S. Zhang, H. Tang, and R. Cooper, unpublished data). Therefore, in the simulations below, we assume that individual admixtures are known. Let d be the distance (in Morgans) between two markers. The transition matrix is then computed by matrix exponentiation25:
It can be shown that 𝒜 retains all the appealing features of equation (1) but is more flexible to permit the average length of a chromosome block to depend on its ancestry. In the case τ1=τ2=…=τN, matrix 𝒜 simplifies to equation (1).
Estimation of Ancestral Haplotype Frequencies
The computation of the forward (α) and the backward (β) matrices requires, for the emission probabilities, both the ancestral allele frequency and two-marker haplotype frequencies, (g1,g2). In this section, we explain how to estimate these frequencies.
To estimate ancestral-allele frequencies, we can simply count alleles in each ancestral population. However, because the number of ancestral individuals genotyped is often limited, the sampling variance of these estimates can be large. Incorporating genotypes from the admixed individuals increases the information on those frequencies. For example, STRUCTURE uses a Gibbs step to update the ancestral allele frequency estimates.8,26 Alternatively, X. Zhu, S. Zhang, H. Tang, and R. Cooper (unpublished data) and Tang et al.19 suggest updating these frequencies via an EM algorithm.27 All these methods produce more-accurate allele frequency estimates. Furthermore, several large genotyping projects are underway, including the HapMap project28 and the ALFRED29 database, and we expect rapid improvements in the estimates of population-specific allele frequencies.
Similarly, we can estimate the two-marker haplotype frequencies by using the ancestral individuals alone. Various methods have been proposed to estimate haplotype frequencies from unphased population genotype data.16,30–34 Again, such estimates have large sampling errors because of the limited number of ancestral individuals. The problem is especially prominent when one or both SNPs have rare alleles. For example, within a large ancestry block, observing a single two-marker haplotype in an admixed individual that is absent in the corresponding ancestral population would force an abrupt change in ancestral state. The absence of the allele in the ancestral population may be the result of the sheer paucity of ancestral individuals examined. In theory, as for the allele frequency estimates, we could also improve the haplotype frequency estimates by using either the EM algorithm or a Gibbs sampling method, which would incorporate the genotypes in the admixed individuals. This, however, is computationally expensive. We choose an alternative approach by observing that there is often richer information on ancestral allele frequency than on haplotype frequency. As we explained in the previous paragraph, more-accurate allele frequency estimates either can be computed jointly on ancestral and admixed individuals or may be obtained from external sources. In other words, in the notation illustrated in the tabulation below, we assume the allele frequencies p1•, p2•, p•1, and p•2 to be known from a larger data set. We then model the observed ancestral haplotype counts n11, n12, n21, and n22 as a sample from an underlying multinomial distribution, whose parameter is of interest.
| SNP 2 Allele |
|||
| SNP 1 Allele | B | b | |
| A | n11 | n12 | p1• |
| a | n21 | n22 | p2• |
| p•1 | p•2 | N | |
Because we consider the marginal frequencies to be fixed, there is only one unknown parameter in the model, which is the LD parameter D=PAB-PAPB. Thus, we compute  by
by  , where
  and
and  are the conditional frequency and the marginal frequency, respectively, of the B allele defined in equation (2). This is likely to improve the haplotype frequency estimates. Because the estimate of the LD parameter D tends to have an upward bias in small samples,35 we introduce a shrinkage procedure. We assume that a number, c, of haplotypes have been observed a priori, which falls into the four cells in the tabulation above according to linkage equilibrium. Thus, we seek D that maximizes the likelihood of the multinomial data, n11+cp1•p•1, n12+cp1•p•2, n21+cp2•p•1, and n22+cp2•p•2. In our simulations, we take c=5. For fixed c, the shrinkage becomes negligible as the sample size N increases; for a fixed sample size N, increasing c shrinks D closer toward 0. Note that, if we ignore background LD and let D=0, the MHMM is reduced to a standard HMM.
Simulations
Simulation 1
The first simulation aims to illustrate the advantage of the haplotype frequency estimation procedure described in the previous section. We generated a large haplotype pool by resampling haplotypes of chromosome 22 in the 60 unrelated European parents (CEPH individuals from Utah [CEU]) genotyped in the HapMap project.28 The observed haplotype frequencies are taken as the underlying truth. Next, we created 50 diploid and unphased individuals by sampling 100 haplotypes from the haplotype pool. We then compare two approaches for estimating the two-marker haplotype frequencies. The naive method uses an EM algorithm and jointly estimates allele frequencies and haplotype frequencies from the 50 individuals. In the second approach, we assume the allele frequencies at both markers are known without error and use the EM algorithm to estimate LD, as described in the previous section. We then compare both estimates with the true sampling frequencies.
Simulation 2
Next, we examine the importance of modeling background LD, using a combination of simulated and real data. For the simulation, we consider an admixed population with three ancestral populations: two populations admixed 25 generations ago and a third ancestral population introduced 10 generations ago. Underlying ancestral states along the genome were generated according to a Markov chain, the transition matrix of which is given by equation (6). To simulate the observed genotypes, we sample from the phased data produced by the HapMap project. This way, our simulated data incorporates a realistic level of high-order dependency among linked markers, and we have the opportunity to examine whether the MHMM is adequate. The three ancestral populations consist of 120 European chromosomes (CEU), 120 African chromosomes (Yoruba), and 178 East Asian chromosomes (90 Han Chinese and 88 Japanese). We then scan along the simulated ancestry sequence, identifying segments of the genome in which the ancestry does not change. For each of these segments, a segment of a haplotype is sampled independently from an individual from the corresponding genomic region and ancestral population. Markers are chosen at a density comparable to that in the Affymetrix 100K SNP chip, with an average spacing of 30 kb. In our analysis, we eliminated any marker that was either in complete LD with its left neighbor or within 10-kb distance to its left neighbor; dropping such markers reduces computation time without losing much ancestry information. The ancestral allele frequencies are estimated under both the HMM and the MHMM, by use of the unphased HapMap genotypes. The two-marker haplotype frequencies are inferred from the same ancestral individuals. MLEs of admixing times, τ, are computed by evaluating the likelihood, over a dense grid, by use of the modified forward algorithm. Similarly, we compute the MLEs under the HMM. Posterior ancestry estimates are obtained according to both the HMM and the MHMM. Under the MHMM, we also obtained 10 posterior samples of ancestry sequences.
Simulation 3
We hypothesize that, as the markers become more densely located, the impact of background LD becomes more prominent. To test this hypothesis and to understand the adequacy of the MHMM for analyzing denser marker sets, we randomly sampled 100K markers from a Han Chinese individual genotyped by the HapMap project. This individual is removed from the ancestral individuals when ancestral allele and haplotype frequencies are estimated. Posterior mean ancestry was estimated assuming IA proportions of (1/3,1/3,1/3) and τ=(25,25,25). The experiment was repeated for a randomly sampled panel of 500K markers and for the complete set of HapMap markers.
Simulation 4
As we discussed in the “Transition Matrix” section, the admixing model from which our method is derived represents a simplification of the historical process. Therefore, the final simulation provides an example illustrating how our proposed ancestry-block-reconstruction approach performs when the data-generating mechanism deviates from the assumed model. In this simulation, we assume that admixing occurred 25 generations ago in the paternal lineage with ancestry proportions of 0.4, 0.4, and 0.2, whereas, in the maternal lineage, admixing occurred 2 generations ago with ancestry proportions of 0.75, 0.125, and 0.125. All other parameters are the same as in simulation 2. We obtained the posterior ancestry estimates, assuming various parameter values of τ and π.
Results
Simulation 1
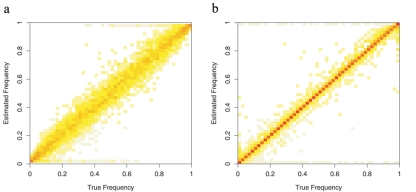
Although inferring haplotype frequencies on the basis of a small number of ancestral individuals produces large sampling errors, the estimates are substantially better when we incorporate external information about allele frequencies at each marker (fig. 2). Each plot can be thought of as a two-dimensional histogram, in which the X-axis represents the true haplotype frequency and the Y-axis represents the corresponding estimated frequencies. The intensity at each pixel indicates the height of the histogram, or the number of marker pairs whose true haplotype frequency is at the X-coordinate while the estimated haplotype-frequency is at the Y-coordinate. If the estimated frequencies entirely coincide with the true values, we will see red pixels on the diagonal and white elsewhere. On the other hand, if the estimated frequencies bear no relationship to the truth, all pixels will show the same color intensity. Clearly, the estimated frequencies clusters more tightly around the true values in figure 2b (allele frequencies known) than they do in figure 2a (allele frequencies unknown).
Figure 2. .
Estimation of two-marker haplotype frequency estimation. Unphased genotype data in 50 individuals were simulated on the basis of chromosome 22 haplotypes of the CEU individuals genotyped in the HapMap project. Each plot can be viewed as a two-dimensional histogram, in which the X-axis represents the true haplotype frequency, and the Y-axis represents the corresponding estimated frequencies. The intensity at each pixel indicates the height of the histogram, or the number of marker pairs whose true haplotype frequency is at the X-coordinate while the estimated haplotype frequency is at the Y-coordinate. a, Naive haplotype frequency estimates. Both allele frequencies and haplotype frequencies are estimated from a small sample of individuals. b, Augmented haplotype frequency estimates. Haplotype frequencies were estimated from same set of individuals as in panel a, but allele frequencies were estimated from a larger sample.
Simulation 2
Estimating model parameter, τ
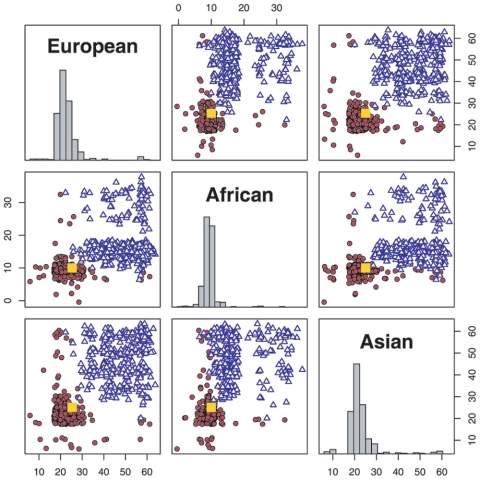
Figure 3 shows the distribution of the MLE of admixing time. Under the MHMM, the mean estimated admixing times are 23.3, 9.6, and 23.2 generations, respectively, compared with the true parameter values of 25, 10, and 25 generations. In contrast, in ignoring the background LD, an HMM substantially overestimates the times, with mean estimates of 47.5, 17.6, and 43.7 generations, respectively. Note that the comparison is between the MHMM and an HMM algorithm we implemented, which resembles the MHMM in all respects except that it does not account for the background LD. This HMM algorithm we implemented is similar to the core component used in programs such as STRUCTURE,8 ADMIXMAP,4 and ANCESTRYMAP5 but differs in two important aspects. First, these latter programs may have somewhat different parameter estimates, since they iteratively update all model parameters through MCMC algorithms. Second, as we explain in the “Transition Matrix” section, all these programs use only a single τ for all ancestral populations. Because of computational challenges and because our primary goal is to investigate the importance of accounting for background LD, we have not analyzed the simulated data with the use of MCMC-based programs.
Figure 3. .
Estimated admixing time, τ, of 400 simulated individuals. Red circles represent the MLE under the MHMM; blue triangles represent the MLE under the HMM by use of the same genotype data. True times are 25, 10, and 25, indicated with a yellow square. Some jitter is added to the MLEs to aid visualization.
A few points in figure 3 appear to have poor estimates under the MHMM. Upon inspection, we find that the likelihood surface of the time parameters are very flat in these individuals. In most cases, the genomewide average ancestry from one population is close to 0 or 1. In the former case, few segments in the person’s genome are derived from the corresponding ancestral population; in the latter case, there are few transitions in the underlying ancestral states. Therefore, parameter estimates for an individual with a low level of admixture can be unreliable.
Inferring ancestry of an admixed individual
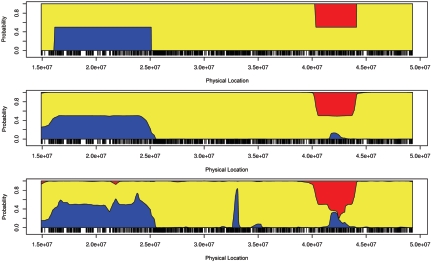
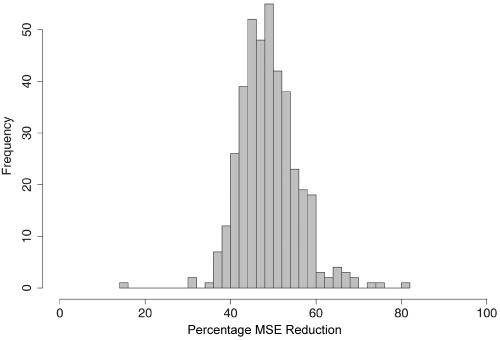
Figure 4 shows the posterior mean estimates of the ancestry on chromosome 22 in a simulated individual. The X-axis represents the physical locations of the SNP markers. The Y-axis is the probability that a randomly sampled allele at that locus has an ancestry from a specific population (blue = European, red = African, and yellow = Asian). The true ancestry is delineated in the top panel; both paternal and maternal copies of the chromosome are largely Asian (yellow), with one chromosome having a small African ancestry block (red) and the other chromosome having a European ancestry block (blue). The middle panel shows the MHMM estimates, and the bottom panel shows the HMM estimates. The MHMM appears to produce more-accurate ancestry estimates than the HMM. For each of the 400 simulated admixed individuals, we compared the mean squared error (MSE) of the posterior estimates produced by the HMM and MHMM. The MSE of the nth individual is a sum over all markers:
 |
where  denote the posterior mean estimates of ancestry at marker t and pt,i represents the true ancestry composition—for example, if one allele at the marker originates from population 1 and the other allele from population 3, then we take (p1,p2,p3)=(1/2,0,1/2). Figure 5 presents a histogram of the MSE reduction by use of the MHMM, compared with use of the HMM—that is, (MSEHMMn-MSEMHMMn)/MSEHMMn. The reduction appears to be quite striking, ranging from 15% to >70%.
Figure 4. .
Ancestry for a simulated admixed individual. The Y-axis represents the posterior probability that one allele is derived from a specific ancestry; the X-axis indicates the physical locations of the markers. Top, True ancestral states. Middle, MHMM estimates. Bottom, HMM estimates.
Figure 5. .
Comparison of percentage reduction in MSE. Percentage reduction for individual n is defined as (MSEHMMn-MSEMHMMn)/MSEHMMn.
Reconstructing ancestry blocks
Of 10 posterior samples obtained for this region under the MHMM, all correctly identified the presence of the European and the African blocks, although there is slight ambiguity with respect to the precise locations at which ancestry changes. Posterior samples of the ancestry sequences under the HMM appear more variable, with some samples identifying a spurious European block of ∼3.3×10⁷ bp or ∼4.2×10⁷ bp. However, we wish to point out that, when analyzing unphased genotype data, neither the MHMM nor the HMM resolves the phase of these ancestry blocks; in other words, we cannot distinguish the true block configuration in figure 4 from the one in which both the European (blue) and African (red) blocks resides on one chromosome, while the other chromosome is entirely Asian (yellow). The posterior sampling algorithm described in the “Posterior Probability of Ancestral States” section would choose the two-phase configuration with equal probability; thus, we construct diploid ancestry blocks. Of course, for phased data or X-chromosome data in males, we can construct ancestry blocks with no phase ambiguity.
Simulation 3: Inferring Ancestry of an Indigenous Individual
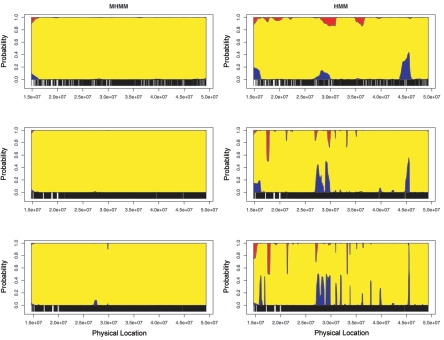
Figure 6 shows the posterior mean estimates of ancestry for chromosome 22 in a Han Chinese individual from Beijing. The intermarker spacing is 30 kb, 6 kb, and 3 kb for the three rows. The MHMM (left column) estimates predominantly Asian ancestry, as we would expect. This held even when we used all HapMap SNPs and therefore expected the background LD to be quite strong. In contrast, ignoring background LD, the HMM (right column) mistakenly identifies several regions as having European ancestry or African ancestry. Furthermore, the unexpected ancestry switches occur increasingly often as the markers become more densely located. Thus, not accounting for background LD between markers may mislead us to false inferences about mixed ancestry in an indigenous population.
Figure 6. .
Estimated ancestry for a Han Chinese individual from Beijing. The Y-axis represents the posterior probability that one allele is derived from a specific ancestry; the X-axis indicates the physical locations of markers. Markers were sampled at an average spacing of 30 kb (top panels), 6 kb (middle panels), and 3 kb (bottom panels), which approximated the density of a 100K SNP chip, approximated the density of a 500K SNP chip, and used all HapMap SNPs, respectively. Left panels, MHMM correctly infers Asian ancestry (yellow) at most markers. Right panels, HMM assigns considerable probability of European ancestry (blue) or African ancestry (red) in several regions.
Simulation 4: Robustness to Model Deviation
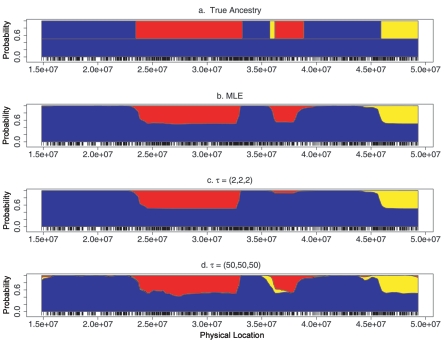
We simulated ancestry blocks and genotypes in an individual with asymmetric admixing history in the paternal and maternal lineages. The top panel in figure 7 depicts the true ancestry blocks: the paternal chromosome (upper strand) consists of European, African, and Asian blocks, each relatively short, and reflects a longer time since admixing; in contrast, the maternal chromosome is entirely European, reflecting a history of more recent admixing. Subsequent panels in figure 7 present posterior ancestry estimates with various values of the parameter τ. Although the ancestry was simulated using unequal ancestry proportions in the paternal and the maternal chromosomes, we assumed an IA of (1/3,1/3,1/3) in performing the MHMM analyses. Despite the erroneous assumptions about the model and parameter values, the posterior ancestry estimates captured the major blocks accurately. Although this demonstrates the robustness of the MHMM in an example that deviates substantially from the generating model, more-comprehensive insights will be obtained through analysis of real genetic data, which are rapidly accumulating.
Figure 7. .
Estimated ancestry for a simulated individual with asymmetric admixing history. The Y-axis represents the posterior probability that one allele is derived from a specific ancestry; the X-axis indicates the physical locations of markers. a, True ancestry along the paternal and the maternal chromosomes. The paternal chromosome was generated assuming τ=(25,25,25) and π=(0.4,0.4,0.2), whereas the maternal chromosome was generated assuming τ=(2,2,2) and π=(0.75,0.125,0.125). b, Posterior ancestry estimates at the MLE of τ. c, Posterior ancestry estimates under the assumption τ=(2,2,2). d, Posterior ancestry estimates under the assumption τ=(50,50,50).
Discussion
Ancestry inference, whether for mapping disease loci or for conducting gene-association studies, is a critical component of genetic analysis in an admixed population. LD between tightly linked markers within ancestral populations complicates such analyses. One option to circumvent the background LD problem is to eliminate markers that are in LD in each ancestral population. Toward this end, a panel of ancestry-informative markers (AIMs) has been developed for admixture mapping in African Americans. Such a map does not exist for other admixed populations but may become available in the near future. However, as Patterson et al.5 recognize, admixture mapping cannot replace genotype- or haplotype-based association analyses. First, there is considerable risk in genotyping a large number of AIMs, which are tailored for one special design. The superiority of admixture mapping over conventional association approaches hinges on the assumption that the frequency of the risk allele differs greatly between ancestral populations. While this may sometimes be the case, genetic differentiation between ancestral populations will generally not be sufficiently large.14 Furthermore, in the event that admixture mapping is not successful, the researchers cannot use the genotype data for conventional analyses, because the AIMs are chosen to eliminate background LD and thus are very far apart.
The estimates of the parameter τ shed light on aspects of admixing history. For example, in the simulation example we presented,  and
and  are generally greater than
  , conveying that ancestral population 2 (African) admixed more recently than the other two populations. However, we warn against equating
  with the actual time of admixing. The transition matrix we adopted represents a compromise between realism and model complexity. Although we generalize the transition matrix of Falush et al.8 to allow different admixing times, it nonetheless represents a great simplification of the historical process of admixing, in which the gene flow from each ancestral population may have occurred continuously or intermittently over many generations.
Having to estimate the two-marker haplotype frequencies substantially enlarges the parameter space of the MHMM compared with an HMM. The estimate can be particularly unreliable when the ancestral information is sparse or inaccurate or when one of the alleles is rare. Thus, a potential weakness of the MHMM, compared with an HMM, is its requirement for richer genetic information on the ancestral populations. Fortunately, high-density SNP platforms are becoming more available and less expensive.
In this article, we propose a computationally tractable model for inferring admixing times and delineating ancestry along admixed chromosomes, which also accounts for background LD in ancestral populations. This approach opens up the possibility that admixture analyses, including MALD and candidate-gene association studies, can be performed using the existing high-density genotype platform, even if the marker panel has not been preselected to be ancestry informative. The simulation results we presented demonstrate the importance of accounting for background LD, both for estimating model parameters and for estimating underlying ancestry. We find it encouraging that the MHMM appears to adequately account for background LD, even for very dense marker panels. The MHMM is implemented in a program, SABER, which will be available online.
Acknowledgments
This research was supported by National Institutes of Health grants GM073059 (to H.T.) and HG003054 (to X.Z.). We thank E. Burchard, S. Choudhry, H. Li, R. Olshen, E. Ziv, and the anonymous reviewers for helpful discussions and comments.
Web Resource
The URL for data presented herein is as follows:
References
- 1.Rife D (1954) Populations of hybrid origin as source material for the detection of linkage. Am J Hum Genet 6:26–33 [PMC free article] [PubMed] [Google Scholar]
- 2.McKeigue P (1998) Mapping genes that underlie ethnic differences in disease risk: methods for detecting linkage in admixed populations, by conditioning on parental admixture. Am J Hum Genet 63:241–251 [DOI] [PMC free article] [PubMed] [Google Scholar]
- 3.Montana G, Pritchard J (2004) Statistical tests for admixture mapping with case-control and cases-only data. Am J Hum Genet 75:771–789 [DOI] [PMC free article] [PubMed] [Google Scholar]
- 4.Hoggart C, Shriver M, Kittles R, Clayton D, McKeigue P (2004) Design and analysis of admixture mapping studies. Am J Hum Genet 74:965–978 [DOI] [PMC free article] [PubMed] [Google Scholar]
- 5.Patterson N, Hattangadi N, Lane B, Lohmueller K, Hafler D, Oksenberg J, Hauser S, Smith M, O’Brien S, Altshuler D, Daly M, Reich D (2004) Methods for high-density admixture mapping of disease genes. Am J Hum Genet 74:979–1000 [DOI] [PMC free article] [PubMed] [Google Scholar]
- 6.Zhu X, Cooper R, Elston R (2004) Linkage analysis of a complex disease through use of admixed populations. Am J Hum Genet 74:1136–1153 [DOI] [PMC free article] [PubMed] [Google Scholar]
- 7.Zhu X, Luke A, Cooper R, Quertermous T, Hanis C, Mosley T, Gu C, Tang H, Rao D, Risch N, Weder A (2005) Admixture mapping for hypertension loci with genome-scan markers. Nat Genet 37:177–181 10.1038/ng1510 [DOI] [PubMed] [Google Scholar]
- 8.Falush D, Stephens M, Pritchard J (2003) Inference of population structure using multilocus genotype data: linked loci and correlated allele frequencies. Genetics 164:1567–1587 [DOI] [PMC free article] [PubMed] [Google Scholar]
- 9.Baum LE, Petrie T (1966) Statistical inference for probabilistic functions of finite state Markov chains. Ann Math Stat 37:1554–1563 [Google Scholar]
- 10.Lander E, Green P (1987) Construction of multilocus genetic linkage maps in humans. Proc Natl Acad Sci USA 84:2363–2367 10.1073/pnas.84.8.2363 [DOI] [PMC free article] [PubMed] [Google Scholar]
- 11.Hughey R, Krogh A (1996) Hidden Markov models for sequence analysis: extension and analysis of the basic method. Comput Appl Biosci 12:95–107 [DOI] [PubMed] [Google Scholar]
- 12.Felsenstein J, Churchill G (1996) A hidden Markov model approach to variation among sites in rate of evolution. Mol Biol Evol 13:93–104 [DOI] [PubMed] [Google Scholar]
- 13.Fridlyand J, Snijders AM, Pinkel D, Albertson DG, Jain AN (2004) Hidden Markov models approach to the analysis of array CGH data. J Multivariate Anal 90:132–153 10.1016/j.jmva.2004.02.008 [DOI] [Google Scholar]
- 14.Rosenberg N, Pritchard J, Weber J, Cann H, Kidd K, Zhivotovsky L, Feldman M (2002) Genetic structure of human populations. Science 298:2381–2385 10.1126/science.1078311 [DOI] [PubMed] [Google Scholar]
- 15.Seldin M, Morii T, Collins-Schramm H, Chima B, Kittles R, Criswell L, Li H (2004) Putative ancestral origins of chromosomal segments in individual African Americans: implications for admixture mapping. Genome Res 14:1076–1084 10.1101/gr.2165904 [DOI] [PMC free article] [PubMed] [Google Scholar]
- 16.Stephens M, Smith N, Donnelly P (2001) A new statistical method for haplotype reconstruction from population data. Am J Hum Genet 68:978–989 [DOI] [PMC free article] [PubMed] [Google Scholar]
- 17.Reich D, Patterson N (2005) Will admixture mapping work to find disease genes? Philos Trans R Soc Lond B Biol Sci 360:1605–1607 10.1098/rstb.2005.1691 [DOI] [PMC free article] [PubMed] [Google Scholar]
- 18.McKeigue P (2000) Multipoint admixture mapping [letter]. Genet Epidemiol 19:464–467 [DOI] [PubMed] [Google Scholar]
- 19.Tang H, Peng J, Wang P, Risch N (2005) Estimation of individual admixture: analytical and study design considerations. Genet Epidemiol 28:289–301 10.1002/gepi.20064 [DOI] [PubMed] [Google Scholar]
- 20.McPeek M, Sun L (2000) Statistical tests for detection of misspecified relationships by use of genome-screen data. Am J Hum Genet 66:1076–1094 [DOI] [PMC free article] [PubMed] [Google Scholar]
- 21.Cappé O, Moulines E, Rydén T (2005) Inference in hidden Markov models. Springer, New York [Google Scholar]
- 22.Rabiner L (1989) A tutorial on hidden Markov models and selected applications in speech recognition. Proc IEEE 77:257–286 10.1109/5.18626 [DOI] [Google Scholar]
- 23.Baum L, Petrie T, Soules G, Weiss N (1970) A maximization technique occurring in the statistical analysis of probabilistic functions of Markov chains. Ann Math Stat 41:164–171 [Google Scholar]
- 24.Long J (1991) The genetic structure of admixed populations. Genetics 127:417–428 [DOI] [PMC free article] [PubMed] [Google Scholar]
- 25.Karlin S, Taylor HM (1975) A first course in stochastic processes. Academic Press, London, p 152 [Google Scholar]
- 26.Pritchard J, Stephens M, Donnelly P (2000) Inference of population structure using multilocus genotype data. Genetics 155:945–959 [DOI] [PMC free article] [PubMed] [Google Scholar]
- 27.Dempster A, Laird N, Rubin D (1977) Maximum likelihood from incomplete data via the EM algorithm. J R Stat Soc Ser B 39:1–38 [Google Scholar]
- 28.International HapMap Consortium (2005) A haplotype map of the human genome. Nature 437:1299–1320 10.1038/nature04226 [DOI] [PMC free article] [PubMed] [Google Scholar]
- 29.Rajeevan H, Osier M, Cheung K, Deng H, Druskin L, Heinzen R, Kidd J, Stein S, Pakstis A, Tosches N, Yeh C, Miller P, Kidd K (2003) Inference of population structure using multilocus genotype data. Nucleic Acids Res 31:270–271 10.1093/nar/gkg043 [DOI] [PMC free article] [PubMed] [Google Scholar]
- 30.Excoffier L, Slatkin M (1995) Maximum-likelihood estimation of molecular haplotype frequencies in a diploid population. Mol Biol Evol 12:921–927 [DOI] [PubMed] [Google Scholar]
- 31.Hawley M, Kidd K (1995) Haplo: a program using the EM algorithm to estimate the frequencies of multi-site haplotypes. J Hered 86:409–411 [DOI] [PubMed] [Google Scholar]
- 32.Long J, Williams R, Urbanek M (1995) An E-M algorithm and testing strategy for multiple-locus haplotypes. Am J Hum Genet 56:799–810 [PMC free article] [PubMed] [Google Scholar]
- 33.Clark A (1990) Inference of haplotypes from PCR-amplified samples of diploid populations. Mol Biol Evol 7:111–122 [DOI] [PubMed] [Google Scholar]
- 34.Fallin D, Schork N (2000) Accuracy of haplotype frequency estimation for biallelic loci, via the expectation-maximization algorithm for unphased diploid genotype data. Am J Hum Genet 67:947–959 [DOI] [PMC free article] [PubMed] [Google Scholar]
- 35.Weiss K, Clark A (2002) Linkage disequilibrium and the mapping of complex human traits. Trends Genet 18:19–24 10.1016/S0168-9525(01)02550-1 [DOI] [PubMed] [Google Scholar]


