Abstract
We studied the properties of a voltage-operated Na+ conductance in descending vasa recta (DVR) pericytes isolated from the renal outer medulla. Whole-cell patch-clamp recordings revealed a depolarization-induced, rapidly activating and rapidly inactivating inward current that was abolished by removal of Na+ but not Ca+ from the extracellular buffer. The Na+ current (INa) is highly sensitive to tetrodotoxin (TTX, Kd = 2.2 nm). At high concentrations, mibefradil (10 μm) and Ni+ (1 mm) blocked INa. INa was insensitive to nifedipine (10 μm). The L-type Ca+ channel activator FPL-64176 induced a slowly activating/inactivating inward current that was abolished by nifedipine. Depolarization to membrane potentials between 0 and 30 mV induced inactivation with a time constant of ∼1 ms. Repolarization to membrane potentials between −90 and −120 mV induced recovery from inactivation with a time constant of ∼11 ms. Half-maximal activation and inactivation occurred at −23.9 and −66.1 mV, respectively, with slope factors of 4.8 and 9.5 mV, respectively. The Na+ channel activator, veratridine (100 μm), reduced peak inward INa and prevented inactivation. We conclude that a TTX-sensitive voltage-operated Na+ conductance, with properties similar to that in other smooth muscle cells, is expressed by DVR pericytes.
Voltage-operated Na+ channels (VONa) play a vital role in action potential generation (Fozzard & Hanck, 1996; Catterall, 2000; Ogata & Ohishi, 2002). VONa pore-forming α subunits are large membrane glycoproteins with four similar domains, each comprising six transmembrane segments, that are structurally similar to voltage-operated Ca+ channels (VOCa). VONa arise from 10 separate genes and exhibit variable kinetics and sensitivity to tetrodotoxin (TTX). VONa have been observed in smooth muscle. Uterine smooth muscle expresses VONa in a manner that increases near term, suggesting a role in the contractions of parturition (Ohya & Sperelakis, 1989; Sperelakis et al. 1992; Yoshino et al. 1997). A fast activating/inactivating, TTX-insensitive VONa current was first described in vascular myocytes by Sturek & Hermsmeyer, (1986) who observed its co-existence with two voltage-operated Ca2+ channels (VOCa) currents. Several reports of VONa in aortic, mesenteric and lymphatic smooth muscle have also appeared, generally identifying TTX-sensitive currents (Bova et al. 1990; Shinjoh et al. 1991; Shinjoh et al. 1992; Hollywood et al. 1997; Berra-Romani et al. 2005). It is interesting to note the recent finding that observation of VONa in mesenteric myocytes depends upon use of a proper enzymatic isolation method. That finding raises questions about the sensitivity of the channels to digestion schemes; it seems possible that VONa are more prevalent in vascular smooth muscle than previously recognized (Berra-Romani et al. 2005). In this report, we show that VONa inward currents are present in pericytes of descending vasa recta (DVR) freshly dissected from the renal medulla. In voltage-clamp experiments, depolarization of DVR pericytes elicits a rapidly activating/inactivating inward current that is eliminated by removal of Na+ and not affected by removal of Ca2+ from the extracellular buffer. The VONa current is highly sensitive to TTX, exhibits kinetic properties similar to that described for VONa in other smooth muscle preparations, and is co-expressed with an FPL-64176- and nifedipine-sensitive VOCa inward current.
Methods
Isolation of DVR
Investigations involving animal use were performed according to protocols approved by the Institutional Animal Use and Care Committee of the University of Maryland. Rats were anaesthetized with an intraperitoneal injection of ketamine (80 mg kg−1) and xylazine (10 mg kg−1). Under full anaesthesia, the abdomen was opened and the kidneys excised. The rats were killed by exsanguination under anaesthesia, without regaining conciousness, immediately after severing the renal artery for removal of the kidneys. Tissue slices were stored at 4°C in a physiological saline solution (PSS) containing (mm): NaCl 155, KCl 5, MgCl2 1, CaCl2 1, Hepes 10 and glucose 10; pH 7.4. Small wedges of renal medulla were dissected and transferred to Blendzyme 1 (collagenase/dispase; Roche Applied Science, Indianapolis, IN, USA) at 0.27 mg ml−1 in high-glucose Dulbecco's modified Eagle's Medium (DMEM; Invitrogen), incubated at 37°(for 45 min, transferred to PSS, and stored at 4°C. Serum was not added to the DMEM. In some experiments, to ensure that DMEM does not induce VONa expression, PSS was substituted for DMEM during the 45-min digestion. At intervals, DVR were isolated from the enzyme-digested renal tissue by hand dissection and transferred to a perfusion chamber for patch-clamp recording. Gigaseals were directly formed on abluminal pericytes of intact vessels as previously described (Pallone & Huang, 2002).
Whole-cell patch-clamp recording
Patch pipettes were made from borosilicate glass capillaries (external diameter, 1.5 mm; internal diameter, 1.0 mm; World Precision Instruments, Sarasota, FL, USA), using a two-stage vertical pipette puller (Narshige PP-830), heat polished to a final resistance of 4–8 MΩ. Whole-cell ruptured patch-clamp recording was performed with a CV201AU headstage and Axopatch 200 amplifier (Axon Instruments, Union City, CA, USA) at room temperature as previously described (Pallone & Huang, 2002; Rhinehart et al. 2002; Zhang et al. 2002; Pallone et al. 2004). The following solution, designed to achieve intracellular free Ca2+ concentration of ∼50 nm was used in the electrode: (mm) caesium methanesulphonate 115, CsCl 18, NaCl 10, MgATP 2.35, CaCl2 1, EGTA 5 mm and Hepes 10; pH adjusted to 7.2 with CsOH. The extracellular buffer was PSS (see above). To inhibit K+ channels and Cl− channels, respectively, all measurements were performed in PSS containing angiotensin II (AngII; 10 nm) and niflumic acid (100 μm). We have previously shown that AngII suppresses K+ currents (Pallone et al. 2004) and that niflumic acid is a potent inhibitor of the Ca2+-dependent Cl− conductance present in DVR pericytes (Pallone & Huang, 2002; Pallone et al. 2004). Whole-cell currents were sampled at 50 kHz during 50 ms pulses from various holding potentials, as described for individual experiments below. As previously described, results have been corrected for junction potentials (Neher, 1992; Pallone & Huang, 2002).
Reagents
FPL-64176 and TTX were from Tocris-Cookson (Ellisville, MO, USA). Angiotensin II (AngII), NiCl2, niflumic acid, mibefradil, nifedipine and all other chemicals were from Sigma. Nifedipine, FPL-64176 and niflumic acid were dissolved in DMSO. TTX was dissolved in aqueous 10 mm sodium acetate buffer (pH 4.5). AngII, mibefradil and NiCl2 were dissolved in water. Reagents were stored frozen at −20°C, thawed and diluted 1: 1000 on the day of the experiment. Excess reagents were discarded daily. Blendzyme was stored in 40-μl aliquots of 4.5 mg ml−1 in water and diluted into high-glucose DMEM or PSS on the day of the experiment.
Statistics
Curve fits were performed with Clampfit 9.2 (Axon Instruments) using Levenberg-Marquardt algorithms. Data in the text and figures are reported as mean ± s.e.m. The significance of differences was evaluated with SigmaStat 3.11 (Systat Software, Inc., Point Richmond, CA, USA) using parametric or non-parametric tests as appropriate for the data. Comparisons between two groups were performed with Student's t test (paired or unpaired, as appropriate) or the rank sum test (non-parametric). Comparisons between multiple groups employed one-way ANOVA, repeated measures ANOVA or repeated measures ANOVA on ranks (non-parametric). Post hoc comparisons were performed using Tukey's or Holm-Sidak tests. P < 0.05 was uses to reject the null hypothesis.
Results
Fast voltage-operated inward currents in DVR pericytes are carried by Na+ ions
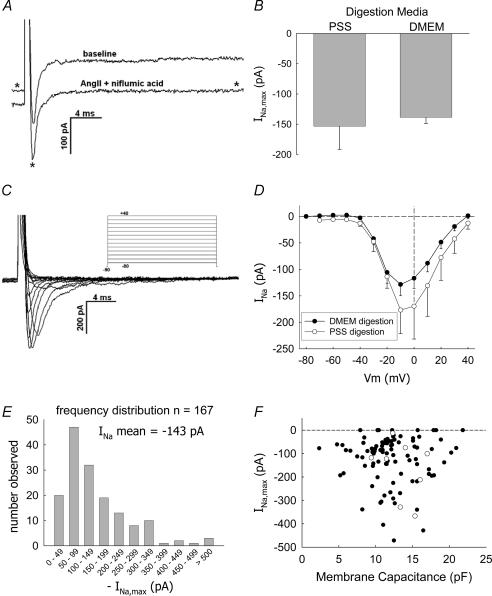
Depolarization of DVR pericytes from a holding level of −90 mV to test potentials greater than −40 mV elicited a rapidly activating and inactivating inward current. To isolate that current, Cs+-containing electrode solution was combined with external application of AngII (10 nm) and niflumic acid (100 μm) to suppress contaminating K+ and Cl− currents. The fast inward current was present prior to application of AngII and niflumic acid (Fig. 1A). The magnitude of the fast inward current, estimated as the difference between its inward peak and the end-pulse current, was unaffected by AngII and niflumic acid (Table 1). Reduction of holding and outward K+ and Cl− currents by these reagents has been previously described (Pallone & Huang, 2002; Pallone et al. 2004).
Figure 1. Depolarizing pulses elicit a rapidly deactivating inward current in DVR pericytes.
A, depolarization of a DVR pericyte from −90 mV to −10 mV elicits a rapidly inactivating inward current. Exposure to AngII (10 nm) and niflumic acid (100 μm) reduces the holding and end-pulse currents (trace identified with an asterisk) but does not affect the overall magnitude of the fast current (similar to n = 12, see Table 1 for summary). B, comparison of mean (± s.e.m.) maximal Na+ inward currents (INa,max) elicited from pericytes of DVR digested with Blendzyme in either DMEM (n = 155) or PSS (n = 9). C, example shows inward current traces obtained by depolarizing a DVR pericyte from −90 mV to the pulse potentials defined by the protocol in the inset. D, summary of peak INa as a function of pulse potential, mean (± s.e.m.), n = 23 cells digested in DMEM (•) and n = 9 cells digested in PSS (○). E, frequency distribution of the peak INa elicited from n = 167 cells. INa was generated by depolarizing from holding potentials of either −90 or −100 mV to a test potential of −10 mV. The mean INa was −143 pA. Data deviate significantly from a normal distribution with skewness and kurtosis of −2.7 and 12.1, respectively. F, graph shows maximal INa versus cell membrane capacitance (Cm) for cells in which the latter was recorded. Pericytes digested in DMEM (•) or PSS (○) are shown. The magnitude of INa does not correlate with Cm.
Table 1.
Effect of AngII on current elicited by pulse depolarizations (n = 12)
| Baseline (pA) | Post-AngII (pA) | |
|---|---|---|
| Holding current | −68.6 ± 8.1 | −36.5 ± 7.5* |
| End-pulse current | 136 ± 30 | 5.5 ± 4.7* |
| Peak inward current | −71.5 ± 43.6 | −198 ± 43* |
| Peak inward – end pulse difference | −208 ± 39 | −203 ± 46 |
Currents elicited by depolarization from a holding potential of −90 mV to −10 mV for 100 ms.
P < 0.05 versus baseline. See Fig. 1A for illustration.
We routinely used DMEM as the medium for enzymatic digestion. Previous investigations found that induction of VONa expression occurred in smooth muscle in culture medium containing serum (Kusaka & Sperelakis, 1994a). Although we did not use serum, for completeness we tested whether use of PSS instead of DMEM as the incubation medium during enzymatic digestion could eliminate the currents. DMEM (n = 155) and PSS (n = 9) yielded cells with similar currents (Fig. 1B). The currents were greatest at pulse potentials of −10 and 0 mV. There was no statistical difference in the magnitude of currents measured after PSS or DMEM digestion (Fig. 1C and D). Figure 1E shows the frequency distribution (n = 167) of the peak inward current, generated by test pulses to −10 mV, from the various protocols in this study. Most peak inward currents were between −50 and −200 pA. In a few cells, currents exceeding −500 pA were observed. Nine of the cells (5.4%) had no discernable inward current. The magnitude of INa was not related to cell capacitance (Fig. 1F).
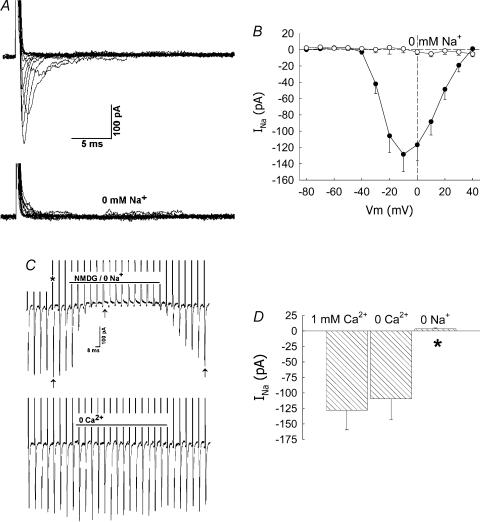
Na+ ions provide the charge that carries the fast inward current. Replacement of Na+ by N-methyl-d-glucamine (NMDG) abolished the inward current (Fig. 2). Similar removal of extracellular Ca2+ was without effect. Figure 2A and B illustrates the abolition of the inward current over a range of pulse potentials. In other experiments, pericytes were held at −90 mV and repeatedly pulsed, at 5-s intervals, to −10 mV for 50 ms as Na+ and Ca2+ were sequentially removed from the extracellular buffer by isosmotic NMDG substitution and then replaced into the extracellular buffer. An example is shown as a concatenated display in Fig. 2C. Inward currents, identified by the arrows, disappear in 0 mm Na+ buffer and reappear when Na+ is returned to the bath. The upward current deviations are capacitance transients (indicated by an asterisk). The mean (± s.e.m.) peak inward currents at baseline (PSS, 1 mm Ca2+), in 0 mm Ca2+ or 0 mm Na+ are shown in Fig. 2D.
Figure 2. Abolition of inward current by removal of extracellular Na+.
A, example shows inward current traces obtained by depolarizing a DVR pericyte from −90 mV to the pulse potentials defined in the inset of Fig. 1A. Inward currents are abolished in 0 mm Na+-containing buffer. B, summary of current–voltage relationship for n = 4 cells in 0 mm Na+-containing buffer. For comparison, the data from n = 23 cells in PSS (155 mm Na+) have been reproduced from Fig. 1B. C, every 5 s, DVR pericytes were depolarized from a holding potential of −90 mV to −10 mV (50 ms pulse). Na+ was removed from and then returned to the extracellular buffer by isosmotic replacement by NMDG (top trace). Subsequently, Ca2+ was removed from and then returned to the buffer (bottom trace). The currents are shown as a concatenated display in which the time between successive pulses has been deleted. Inward INa (arrows) are abolished by Na+ removal. Outward current deviations (*) are cell capacitance transients. D, summary of the mean (± s.e.m.) peak inward INa measured as shown in C in PSS (1 mm Ca2+ and 155 mm Na+), 0 Ca2+, and 0 Na2+ buffers (*P < 0.05 versus PSS, n = 8).
Inhibition of inward current by VONa and VOCa blockers
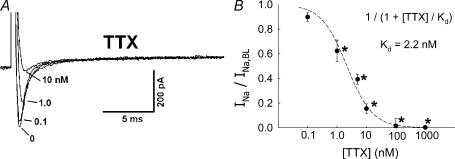
VONa are often classified according to their sensitivity or resistance to TTX. In a series of experiments, TTX (0.1–1000 nm) was added to the extracellular buffer while the DVR pericytes were depolarized, at 5 s intervals, from a holding level of −90 mV to −10 mV for 50 ms. Figure 3A shows an example of superimposed current traces in the presence of TTX at 0, 0.1, 1 and 10 nm. The ratios of the peak Na+ currents (INa) elicited during depolarizations in TTX to that at baseline (INa,BL, 0 mm TTX) are summarized in Fig. 3B. The current was potently inhibited by TTX. Fit of the data to the expression:
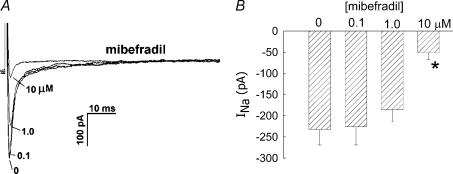
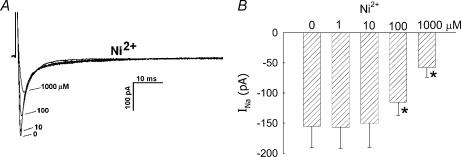
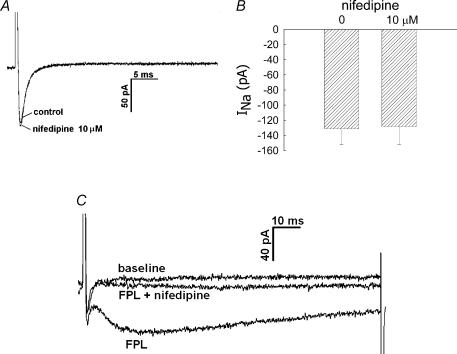
where INa,TTX is the Na+ current in the presence of TTX, yielded a Kd value of 2.2 nm. Inhibition was readily reversible upon washout (data not shown). We also examined the ability of classical VOCa blockers, mibefradil, Ni2+ and nifedipine, to inhibit the current. Mibefradil, at a high concentration (10 μm), well in excess of that typically needed to selectively inhibit T-type VOCa (CaV3.x) (Randall, 1998), reduced INa (Fig. 4). Similarly, Ni2+ inhibited INa, but a high concentration (1000 μm) was again required (Fig. 5). Both mibefradil and Ni2+ blockade were readily reversible after washout (data not shown). The CaV1.x, L-type VOCa2+ blocker, nifedipine, did not affect INa currents (Fig. 6A and B). This shows that the Na+ conductance is insensitive to nifedipine and also demonstrates that L-type VOCa currents do not significantly contaminate the recordings generated under the conditions of our experiments. VOCa channel isoforms are expressed in DVR pericytes (Hansen et al. 2000, Hansen, 2001; Jensen et al. 2004) and we previously showed that the L-type VOCa blocker, diltiazem, inhibits vasoconstriction and Ca2+ entry into these cells (Zhang et al. 2002). Although L-type VOCa conductance was not the focus of this study, we verified that it is present in DVR pericytes. Introduction of the L-type VOCa activator, FPL-64176 (FPL, 10 μm), into the extracellular buffer elicited characteristic L-type currents. During pulsation from −90 mV to −10 mV, the FPL-64176-stimulated inward current peaked later than INa, was slowly inactivating, and was completely blocked by nifedipine (Fig. 6C similar to n = 6).
Figure 3. Inhibition of INa by TTX.
A, every 5 s, DVR pericytes were depolarized from a holding potential of −90 mV to −10 mV for 50 ms. During those pulses, increasing concentrations of TTX were introduced into the extracellular buffer. Superimposed traces show an example of the inhibition of INa as TTX was increased from 0 nm to 0.1, 1 and 10 nm. B, summary of INa, normalized to baseline (INa,BL, 0 nm TTX), versus TTX concentration. Fitting the data to the expression INa/INa, BL= 1/(1 +[TTX]/Kd) yielded Kd of 2.2 nm. *P < 0.05 versus 0 nm TTX, n = 4–16 cells at each concentration.
Figure 4. Inhibition of INa by mibefradil.
A, every 5 s, DVR pericytes were depolarized from a holding potential of −90 mV to −10 mV for 50 ms. During the pulses, increasing concentrations of mibefradil were introduced into the extracellular buffer. Superimposed traces show an example of the inhibition of INa as mibefradil was increased from 0 μm to 0.1, 1 and 10 μm. B, summary of peak inward INa versus mibefradil concentration. *P < 0.05 versus 0 μm mibefradil, n = 4, 6 and 10 cells at 0.1, 1.0 and 10 μm, respectively.
Figure 5. Inhibition of INa by Ni2+ ion.
A, every 5 s, DVR pericytes were depolarized from a holding potential of −90 mV to −10 mV for 50 ms. During those pulses, increasing concentrations of Ni2+ were introduced into the extracellular buffer. Superimposed traces show an example of the inhibition of INa as Ni2+ was increased from 0 μm to 1.0, 10, 100 and 1000 μm. B, summary of peak inward INa versus Ni2+ concentration. *P < 0.05 versus 0 μm Ni2+, n = 13, 7, 13 and 5 cells at 1.0, 10, 100 and 1000 μm, respectively).
Figure 6. Inhibition of inward currents by nifedipine.
A, every 5 s, DVR pericytes were depolarized from a holding potential of −90 mV to −10 mV for 50 ms. During the pulses, nifedipine (10 μm) was introduced into the extracellular buffer. Superimposed traces show an example of the INa in 0, and 10 μm nifedipine. B, summary of peak inward INa in 0 and 10 μm nifedipine (n = 11, n.s). C, every 5 s, DVR pericytes were depolarized from a holding potential of −90 mV to −10 mV for 50 ms. During the pulses, the L-type voltage-operated Ca2+ channel opener FPL-64176 (FPL, 10 μm) was added to the bath alone, and then in combination with nifedipine (10 μm). Superimposed traces show examples of the inward currents elicited at baseline, in the presence of FLP, and with FLP plus nifedipine (similar to n = 6).
Properties of VONa conductance in DVR pericytes
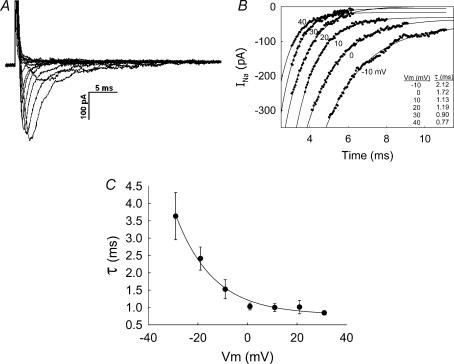
To characterize the pericyte VONa conductance, we quantified its properties. After activation by depolarization, voltage-operated Na+, K+ and Ca2+ channels spontaneously inactivate. The kinetics of inactivation vary markedly between ion channel classes and subclasses (Nelson et al. 1990). Figure 7A provides an example of activation and inactivation in a single cell. Figure 7B shows the fits of the associated post-peak inactivating currents to exponentials of the form INa=C1(1 − exp(t/τ)) +C0, where C1 and C0 are constants. Summary of the time constant of inactivation (τ) for seven cells is shown in Fig. 7C. Inactivation was most rapid at pulse potentials ≥ 0 mV. Time constants of 1.03 ± 0.10, 1.00 ± 0.11, 1.01 ± 0.19 and 0.84 ± 0.06 ms were obtained at 0, 10, 20, 30 and 40 mV, respectively.
Figure 7. Inactivation of INa.
A, example shows inward current traces obtained by depolarizing a DVR pericyte from −90 mV to the pulse potentials as shown in the inset of Fig. 1A. B, the graph shows exponential fits to the post-peak deactivating currents of traces in A. Inset shows the time constants obtained by those fits for traces elicited by depolarizing test pulses between −10 and +40 mV. C, summary of the mean (± s.e.m.) time constants (τ, ordinate) obtained from seven cells that were analysed by the method illustrated in A and B. The line through the data has been fitted to an exponential.
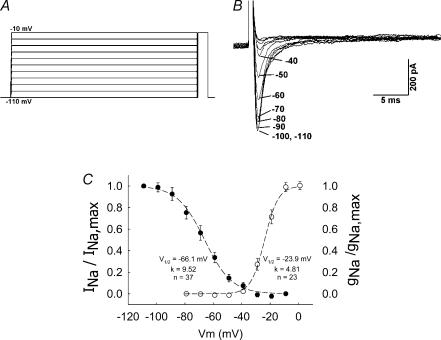
To examine the voltage dependence of inactivation of the DVR pericyte VONa conductance, the protocol illustrated in Fig. 8A was used. Pericytes were conditioned at various potentials for 2 s following which they were depolarized to a test potential of −10 mV to elicit INa. The example in Fig. 8B shows superimposed current traces obtained by depolarizing from conditioning potentials between −110 and −40 mV. A summary of the results for 37 cells is provided in Fig. 8C (left-hand ordinate) where the mean (± s.e.m.) INa, normalized to the value elicited by depolarization from −110 mV (INa,max), is shown as a function of the conditioning potential. Conditioning at greater than −40 mV resulted in complete inactivation (Fig. 8C, •). The mean values were fitted to the Boltzman equation:
where Vm is membrane potential, s is −1 or +1 for activation or inactivation, respectively, and V1/2 and K are constants. V1/2 and K for inactivation were −66.1 mV and 6.5 mV, respectively. Activation properties, from the 23 cells illustrated in Fig. 1B, are also shown in Fig. 8C (○). Activation was computed from the Na+ chord conductance (gNa), from the equation:
where Naeq is the Na+ equilibrium potential (+73 mV). Values of gNa were normalized to maximum conductance (gNa,max). Fitting the mean values to the Boltzman relationship yielded V1/2 and K for activation of −23.9 mV and 4.8 mV, respectively. Take together, the current window for the VONa conductance in DVR pericytes is predicted to lie between about −50 and −25 mV.
Figure 8. Activation and inactivation of INa.
A, protocol used to examine inactivation of VONa conductance in DVR pericytes. Pericytes were held at −110 mV and subjected to a 2-s conditioning pulse between −100 and −10 mV (10 mV increments, 5 s between sweeps). After the conditioning pulse, the cells were depolarized to a test potential of −10 mV. B, superimposed current traces show INa elicited by the test pulse. The labels refer to the magnitude of the preceding conditioning pulse (−110 to −40 mV). INa could not be elicited when the conditioning level exceeded −40 mV. C, superimposed inactivation (•, left-hand ordinate, n = 37) and activation (○, right-hand ordinate, n = 23) plots for the DVR pericyte VONa conductance. Dashed lines and inset values show the best fit of the mean data to Boltzman equations (see text).
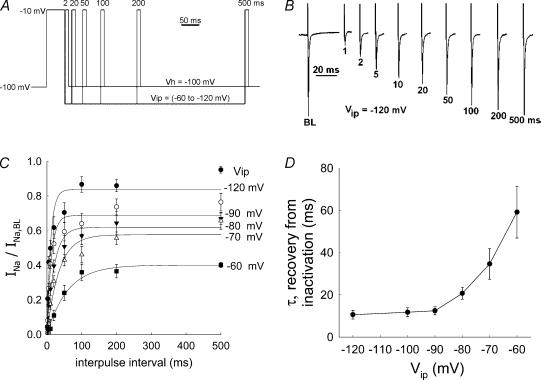
The time required for recovery from inactivation was investigated using the protocol shown in Fig. 9A. DVR pericytes were held at −100 mV and depolarized to −10 mV for 50 ms. That initial pulse elicited a baseline Na+ current (INa,BL) and induced inactivation. In separate sweeps, cells were repolarized to an interpulse potential (Vip) for intervals of 1, 2, 10, 20, 50, 100, 200 or 500 ms. To measure the extent of recovery from inactivation after those intervals, depolarization to −10 mV was repeated to elicit a second INa. Following the second depolarization, cells were returned to the holding potential (−100 mV) for 5 s between sweeps. To determine the effect of Vip on reactivation, protocols were performed with Vip of −60, −70, −80, −90, −100 or −120 mV. An example (Vip, −120 mV) of an experiment is illustrated in Fig. 9B. Figure 9C summarizes the results of many experiments performed at various levels of Vip. Fitting the data to a relationship of the form:
where τ is the time constant for recovery from inactivation, is superimposed upon the data points in Fig. 9C. The time constants for recovery from inactivation are summarized as a function of Vip in Fig. 9D. Recovery from inactivation was most rapid at the more negative interpulse potentials.
Figure 9. Recovery of VONa conductance from inactivation.
A, protocol used to examine recovery from inactivation. Pericytes were held at −100 mV and depolarized to −10 mV for 50 ms to elicit the baseline Na+ current (INa,BL) and inactivate the associated Na+ conductance. Subsequently, the cells were repolarized to a specified interpulse potential (Vip). Pericytes were maintained at Vip for 1, 2, 5, 10, 20, 50, 100, 200 or 500 ms (separate sweeps, not all values are shown in the illustration). Subsequently, a repeat test pulse to −10 mV for 10 ms was performed to obtain a measurement of INa after the interpulse recovery period at Vip. Intersweep intervals of 5 s were employed. Using separate executions of similar protocols, Vip was varied between −60 and −120 mV. B, example of INa traces elicited at baseline (BL) and then again, following various interpulse intervals (1–500 ms, Vip, −120 mV). Upward deviations are cell capacitance transients and downward deviations are INa. C, the mean (± s.e.m.) INa, normalized to INa,BL, is plotted against the interpulse interval. Results obtained at the various interpulse potentials (Vip) are superimposed to illustrate the effect on the rate of recovery from inactivation. D, the mean (± s.e.m.) time constant for recovery of INa (τ) is plotted for n = 8–10 cells tested at each Vip. Exponential fits to the data are superimposed (see text).
VONa activation by veratridine
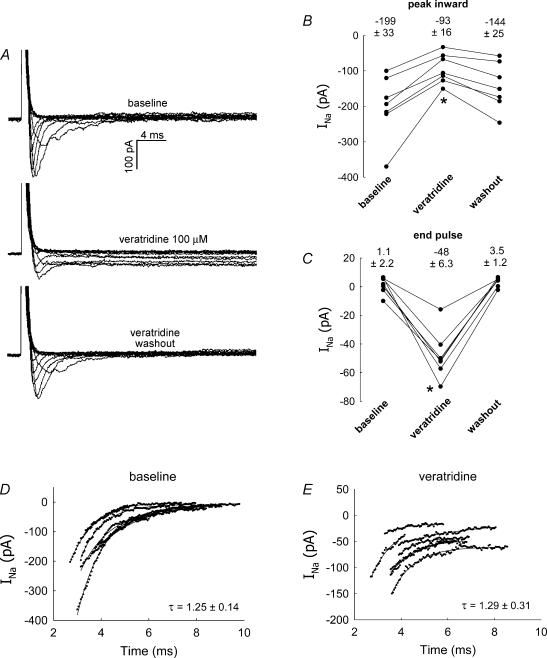
Veratridine increases VONa currents by preventing inactivation and maintaining channels in an open state (Fozzard & Hanck, 1996; Wang & Wang, 2003). We tested the sensitivity of pericyte VONa to this compound. As previously described by others, veratridine (100 μm) had dual agonist/antagonist effects through which it reduced the peak Na+ inward current but prevented its inactivation (Kusaka & Sperelakis, 1994b). This is illustrated in Fig. 10A, wherein a family of current traces, elicited using the pulse protocol defined in Fig. 1A, is shown before, during and after veratridine exposure. In a separate series of experiments, veratridine (100 μm) was introduced into and then removed from the bath of seven pericytes held at −90 mV and depolarized to −10 mV for 50 ms at 5-s intervals. Veratridine reversibly decreased the peak inward current (Fig. 10B) while enhancing the end-pulse currents (Fig. 10C). Veratridine was partially effective at 10 μm (data not shown) but had no observable effect below that concentration.
Figure 10. Enhancement of INa by veratridine.
A, example shows inward current traces obtained by depolarizing a DVR pericyte from −90 mV to the pulse potentials as shown in the inset of Fig. 1A. The pulse protocol was executed before and during administration of veratridine (100 μm) and again after washout. Veratridine reduced the peak inward current and prevented inactivation. B, every 5 s, DVR pericytes were depolarized from a holding potential of −90 mV to −10 mV for 50 ms. During the pulses, veratridine was introduced into the extracellular buffer and then washed out. Summary shows the peak inward currents before and during exposure to veratridine and again after washout (P < 0.05, veratridine versus baseline, n = 7). C, summary shows the end-pulse current before and during application of veratridine and again after washout (P < 0.05, veratridine versus baseline, n = 7). D and E, exponential fits to the post-peak currents of the seven cells, depolarized to −10 mV, from B and C yield inactivation time constants before and after exposure to veratridine of 1.25 ± 0.14 ms and 1.29 ± 0.31 ms (mean ± s.e.m.), respectively (n.s).
To determine whether the deactivation time constant was affected by veratridine, the inactivating currents of the seven cells described in Fig. 10B and C, depolarized to −10 mV, were fitted to exponentials (Fig. 10D and E). To estimate τ, the data points from traces at baseline and in the presence of veratridine, corresponding to the most rapid change in INa between the peak inward current and the final plateau after inactivation, were selected by eye and fitted to an exponential of the form:
where C1 and C2 are constants. Time on the abscissa of Fig. 10D and E is from the original recordings and not shifted to zero. Inactivation time constants before and during exposure to veratridine were nearly identical, 1.25 ± 0.14 and 1.29 ± 0.31 ms, respectively.
Discussion
Blood flow to the medulla of the kidney is supplied by DVR, which are ∼13- to 15-μm diameter vessels that arise from juxtamedullary efferent arterioles and traverse vascular bundles of the inner stripe of the outer medulla. DVR are closely associated with ascending vasa recta with which they exchange solutes and water to trap NaCl and urea by countercurrent exchange. DVR express aquaporin 1 water channels and the type B urea transporter (UTB) to accommodate transvessel solute and water equilibration, and are contractile so that they presumably regulate renal medullary perfusion and intramedullary blood flow distribution (Pallone et al. 2003a, b). Pericytes surround the DVR endothelial monolayer in both the outer and inner medulla and contract in response to a variety of hormones and paracrine agents (Pallone & Silldorff, 2001). Regulation of perfusion of the medulla plays a role in antidiuresis, blood pressure control and sodium balance (Cowley, 1997). In view of the importance of the DVR pericyte to those physiological processes, we adapted electrophysiological methods to investigate channel architecture and the control of membrane potential that regulates Ca2+ influx to the cells. We have shown that AngII activates a 16.8-pS Cl− channel (Zhang et al. 2001), and a Ca2+-activated, niflumic acid-sensitive Cl− conductance (Pallone & Huang, 2002). As part of its actions, AngII also inhibits DVR pericyte K+ conductance (Pallone et al. 2004). The combined Cl− channel activation and K+ channel inhibition depolarizes membrane potential from resting values between −50 and −70 mV towards the equilibrium potential of Cl−, stimulating voltage-gated Ca2+ influx and elevation of cytoplasmic Ca2+ concentration (Rhinehart et al. 2002; Zhang et al. 2002).
In this report we describe the unexpected finding of a prominent voltage-gated Na+ conductance in the DVR pericyte. We cannot attribute the VONa current to induction of channels by growth factors (Kusaka & Sperelakis, 1994b) because serum was not used in the 45-min digestions and incubation in physiological saline instead of DMEM did not affect the presence or magnitude of the currents (Fig. 1B). Depolarization of the majority of voltage-clamped pericytes induced a rapid inward current the charge carrier of which is Na+ (Figs 1 and 2). The current is abolished by removal of Na+ from the extracellular buffer (Fig. 2) and is exquisitely sensitive to TTX (Kd= 2.2 nm, Fig. 3). It is resistant or insensitive to classical blockers of voltage-gated Ca2+ channels (mibefradil, Ni2+ and nifedipine, Figs 4, 5, 6). VONa currents are characteristically fast; upon depolarization of the plasma membrane they typically activate and inactivate within several milliseconds (Fozzard & Hanck, 1996; Catterall, 2000). That characteristic is reproduced in DVR pericytes with an inactivation time constant of ∼1 ms at the most positive test potentials (Fig. 7). The DVR VONa current activates with threshold depolarization near −40 mV and reaches a maximum at −10 to 0 mV (Figs 1 and 8). The VONa current partially inactivates when pericytes are held in the range of voltages typical for membrane potential (−70 to −50 mV) and becomes completely inactive at potentials greater than about −25 mV. From this, we infer that the ‘current window’ of membrane potential that is above the threshold for activation, but below the level that induces complete inactivation, lies between −50 and −25 mV (Fig. 8). Those values are within the range of membrane potentials to which constrictors such as AngII depolarize DVR pericytes under current-clamp conditions (Pallone & Huang, 2002).
To observe DVR pericyte VONa currents, we depolarized cells from holding levels near the K+ equilibrium potential (−90 mV) to values that can generate K+ and Cl− outward currents. Contaminating K+ and Cl− currents were blocked. We included niflumic acid in the extracellular buffer to eliminate the prominent Ca2+-dependent Cl− conductance in these cells (Pallone & Huang, 2002). We also performed these experiments after pre-exposure to AngII (10 nm) which, in our hands, effectively blocks K+ currents (Pallone et al. 2004). Use of AngII augments the ability of Cs+-based electrode buffers to prevent outward currents through K+ channels. Thus, DVR pericytes may express a K+ conductance or a non-selective cation channel that conducts Cs+. AngII stimulation is not a prerequisite for observation of VONa currents; they are observed in pericytes that have not been exposed to AngII (Fig. 1A, Table 1). Without AngII, VONa currents are superimposed upon other contaminating outward currents (Fig. 1A).
The protocols we employed to elicit VONa involve depolarization to test potentials that can also activate Ca2+ inward currents through VOCa channels. There is substantial evidence that the VOCa α subunits CaV1.x, 2.x and 3.x are expressed in DVR pericytes; their protein and mRNA have been identified using immunochemical staining and RT-PCR (Hansen et al. 2000, 2001; Jensen et al. 2004). In addition, both DVR constriction and elevation of pericyte cytoplasmic Ca2+ concentration are blocked by diltiazem (Zhang et al. 2002). The complete elimination of VONa currents by removal of Na+ from the extracellular buffer (Fig. 2) or by exposure to TTX (Fig. 3) supports the notion that VOCa currents did not contaminate our records. The ability to elicit nifedipine-sensitive L-type currents with FPL-64176 (Fig. 6C and D) shows that CaV1.x is expressed but is either dormant or conducts negligible current in our buffers (1 mm extracellular Ca2+). With these protocols, we did not observe currents typical of T-type CaV3.x channels, but the conditions were not optimized to elicit them. It is possible that greater Ca2+ buffering in the electrode, the use of faster chelators than EGTA, the use of a high concentration of Ba2+ in the extracellular buffer, or temperature elevation would demonstrate baseline T-type and/or L-type VOCa currents. It is also possible that CaV currents are suppressed by prolonged exposure to AngII. Additional studies will be needed to quantify the contributions of VOCa channels in these cells.
We have identified a VONa current in DVR pericytes. This is, to our knowledge, the first description of such a current in the renal microcirculation. VONa expression in smooth muscle from vascular and non-vascular tissues has been described by several authors. Kinetics of the pericyte current are similar to most of them. The earliest identification of VONa in the vasculature by Sturek & Hermsmeyer (1986) revealed TTX resistance. Subsequent studies in vascular myocytes have identified TTX-sensitive conductances (Berra-Romani et al. 2005). The TTX-resistant skeletal muscle isoform NaV1.5 seems to be prevalent in gastrointestinal smooth muscle (Muraki et al. 1991; Yamamoto et al. 1993; Strege et al. 2003). To date, 10 isoforms of voltage-operated Na+ channels have been identified. Nine are reasonably placed into a single family (NaV1.1–Nav1.9). An additional isoform, Nax, has divergent structure and properties. Six of the 10 isoforms are TTX-sensitive while NaV1.5, 1.8, 1.9 and NaX are TTX-resistant (Ogata & Ohishi, 2002). The DVR pericyte Na+ conductance is exquisitely TTX-sensitive (Fig. 3) and should prove to be one of the former.
The physiological role of the Na+ conductance in DVR pericytes has not been determined as part of this study. The equilibrium potential of Na+ is very positive. As such, entry of Na+ into the DVR pericyte could augment membrane depolarization and secondarily favour activation of VOCa channels. On the other hand, the resting potential of these cells is sufficiently negative (−70 to −50 mV) so that basal VONa activity is likely to be very low (Fig. 8). Indeed, our preliminary experiments have shown that TTX exposure does not depolarize DVR pericytes (data not shown). An alternate hypothesis is that low levels of Na+ entry via VONa serves to modulate ‘near membrane’ Ca2+ concentration by influencing the rate of Na+–Ca2+ exchange (Blaustein & Lederer, 1999). Such localized Na+ entry has been proposed as a primary mechanism that modulates endoplasmic reticulum/sarcoplasmic reticulum (ER/SR) store Ca2+ loading (Arnon et al. 2000).
The physiological effects of VONa activation in smooth muscle have been studied by several investigators. Reduction of extracellular Na+ or elevation of intracellular Na+ concentration enhances smooth muscle contraction (Bova et al. 1990). Activation of Na+ channels induces contraction of aortic myocytes (Shinjoh et al. 1992). The VONa-activating brevetoxin from Ptychodiscus brevis depolarizes and constricts bronchial and tracheal smooth muscle as well as rat vas deferens (Asai et al. 1982; Sakamoto et al. 1985). VONa in DVR pericytes may have similar roles to favour contraction, elevation of cytoplasmic Ca2+ concentration or ER/SR Ca2+ loading. Due to preferential loading of Ca2+-sensitive fluorophores into endothelium, Ca2+ transients in DVR pericytes are particularly difficult to investigate (Rhinehart et al. 2002; Pallone et al. 2003b). Additional, extensive efforts with sophisticated imaging methods will probably be required to delineate the role(s) of voltage-gated Na+ entry into these cells.
Acknowledgments
Studies in our laboratory are supported by National Institutes of Health (NIH) grants R37 DK42495, R01 DK68492 and R01 DK67621.
References
- Arnon A, Hamlyn JM, Blaustein MP. Ouabain augments Ca2+ transients in arterial smooth muscle without raising cytosolic Na+ Am J Physiol. 2000;279:H679–H691. doi: 10.1152/ajpheart.2000.279.2.H679. [DOI] [PubMed] [Google Scholar]
- Asai S, Krzanowski JJ, Anderson WH, Martin DF, Polson JB, Lockey RF, et al. Effects of toxin of red tide, Ptychodiscus brevis, on canine tracheal smooth muscle: a possible new asthma-triggering mechanism. J Allergy Clin Immunol. 1982;69:418–428. doi: 10.1016/0091-6749(82)90116-6. [DOI] [PubMed] [Google Scholar]
- Berra-Romani R, Blaustein MP, Matteson DR. TTX-sensitive voltage-gated Na+ channels are expressed in mesenteric artery smooth muscle cells. Am J Physiol. 2005;289:H137–H145. doi: 10.1152/ajpheart.01156.2004. [DOI] [PubMed] [Google Scholar]
- Blaustein MP, Lederer WJ. Sodium/calcium exchange: its physiological implications. Physiol Rev. 1999;79:763–854. doi: 10.1152/physrev.1999.79.3.763. [DOI] [PubMed] [Google Scholar]
- Bova S, Goldman WF, Yauan XJ, Blaustein MP. Influence of Na+ gradient on Ca2+ transients and contraction in vascular smooth muscle. Am J Physiol. 1990;259:H409–H423. doi: 10.1152/ajpheart.1990.259.2.H409. [DOI] [PubMed] [Google Scholar]
- Catterall WA. From ionic currents to molecular mechanisms: the structure and function of voltage-gated sodium channels. Neuron. 2000;26:13–25. doi: 10.1016/s0896-6273(00)81133-2. [DOI] [PubMed] [Google Scholar]
- Cowley AW., Jr Role of the renal medulla in volume and arterial pressure regulation. Am J Physiol. 1997;273:R1–R15. doi: 10.1152/ajpregu.1997.273.1.R1. [DOI] [PubMed] [Google Scholar]
- Fozzard HA, Hanck DA. Structure and function of voltage-dependent sodium channels: comparison of brain II and cardiac isoforms. Physiol Rev. 1996;76:887–926. doi: 10.1152/physrev.1996.76.3.887. [DOI] [PubMed] [Google Scholar]
- Hansen PB, Jensen BL, Andreasen D, Friis UG, Skott O. Vascular smooth muscle cells express the α1A subunit of a P-/Q-type voltage-dependent Ca2+ channel, and it is functionally important in renal afferent arterioles. Circ Res. 2000;87:896–902. doi: 10.1161/01.res.87.10.896. [DOI] [PubMed] [Google Scholar]
- Hansen PB, Jensen BL, Andreasen D, Skott O. Differential expression of T- and L-type voltage-dependent calcium channels in renal resistance vessels. Circ Res. 2001;89:630–638. doi: 10.1161/hh1901.097126. [DOI] [PubMed] [Google Scholar]
- Hollywood MA, Cotton KD, Thornbury KD, McHale NG. Tetrodotoxin-sensitive sodium current in sheep lymphatic smooth muscle. J Physiol. 1997;503:13–20. doi: 10.1111/j.1469-7793.1997.013bi.x. [DOI] [PMC free article] [PubMed] [Google Scholar]
- Jensen BL, Friis UG, Hansen PB, Andreasen D, Uhrenholt T, Schjerning J, et al. Voltage-dependent calcium channels in the renal microcirculation. Nephrol Dial Transplant. 2004;19:1368–1373. doi: 10.1093/ndt/gfh176. [DOI] [PubMed] [Google Scholar]
- Kusaka M, Sperelakis N. Fast sodium currents induced by serum in human uterine leiomyosarcoma cells. Am J Physiol. 1994a;267:C1288–C1294. doi: 10.1152/ajpcell.1994.267.5.C1288. [DOI] [PubMed] [Google Scholar]
- Kusaka M, Sperelakis N. Veratridine actions on two types of fast Na+ channels in human uterine leiomyosarcoma cells. Eur J Pharmacol. 1994b;271:387–393. doi: 10.1016/0014-2999(94)90798-6. [DOI] [PubMed] [Google Scholar]
- Muraki K, Imaizumi Y, Watanabe M. Sodium currents in smooth muscle cells freshly isolated from stomach fundus of the rat and ureter of the guinea-pig. J Physiol. 1991;442:351–375. doi: 10.1113/jphysiol.1991.sp018797. [DOI] [PMC free article] [PubMed] [Google Scholar]
- Neher E. Correction for liquid junction potentials in patch clamp experiments. Methods Enzymol. 1992;207:123–131. doi: 10.1016/0076-6879(92)07008-c. [DOI] [PubMed] [Google Scholar]
- Nelson MT, Patlak JB, Worley JF, Standen NB. Calcium channels, potassium channels, and voltage dependence of arterial smooth muscle tone. Am J Physiol. 1990;259:C3–C18. doi: 10.1152/ajpcell.1990.259.1.C3. [DOI] [PubMed] [Google Scholar]
- Ogata N, Ohishi Y. Molecular diversity of structure and function of the voltage-gated Na+ channels. Jpn J Pharmacol. 2002;88:365–377. doi: 10.1254/jjp.88.365. [DOI] [PubMed] [Google Scholar]
- Ohya Y, Sperelakis N. Fast Na+ and slow Ca2+ channels in single uterine muscle cells from pregnant rats. Am J Physiol. 1989;257:C408–C412. doi: 10.1152/ajpcell.1989.257.2.C408. [DOI] [PubMed] [Google Scholar]
- Pallone TL, Cao C, Zhang Z. Inhibition of K+ conductance in descending vasa recta pericytes by ANG II. Am J Physiol Renal Physiol. 2004;287:F1213–F1222. doi: 10.1152/ajprenal.00241.2004. [DOI] [PubMed] [Google Scholar]
- Pallone TL, Huang JM. Control of descending vasa recta pericyte membrane potential by angiotensin II. Am J Physiol Renal Physiol. 2002;282:F1064–F1074. doi: 10.1152/ajprenal.00306.2001. [DOI] [PubMed] [Google Scholar]
- Pallone TL, Silldorff EP. Pericyte regulation of renal medullary blood flow. Exp Nephrol. 2001;9:165–170. doi: 10.1159/000052608. [DOI] [PubMed] [Google Scholar]
- Pallone TL, Turner MR, Edwards A, Jamison RL. Countercurrent exchange in the renal medulla. Am J Physiol Regul Integr Comp Physiol. 2003a;284:R1153–R1175. doi: 10.1152/ajpregu.00657.2002. [DOI] [PubMed] [Google Scholar]
- Pallone TL, Zhang Z, Rhinehart K. Physiology of the renal medullary microcirculation. Am J Physiol Renal Physiol. 2003b;284:F253–F266. doi: 10.1152/ajprenal.00304.2002. [DOI] [PubMed] [Google Scholar]
- Randall AD. The molecular basis of voltage-gated Ca2+ channel diversity: is it time for T? J Membr Biol. 1998;161:207–213. doi: 10.1007/s002329900327. [DOI] [PubMed] [Google Scholar]
- Rhinehart K, Zhang Z, Pallone TL. Ca2+ signaling and membrane potential in descending vasa recta pericytes and endothelia. Am J Physiol Renal Physiol. 2002;283:F852–F860. doi: 10.1152/ajprenal.00065.2002. [DOI] [PubMed] [Google Scholar]
- Sakamoto Y, Krzanowski J, Lockey R, Martin DF, Duncan R, Polson J, et al. The mechanism of Ptychodiscus brevis toxin-induced rat vas deferens contraction. J Allergy Clin Immunol. 1985;76:117–122. doi: 10.1016/0091-6749(85)90814-0. [DOI] [PubMed] [Google Scholar]
- Shinjoh M, Nakaki T, Otsuka Y, Sasakawa N, Kato R. Vascular smooth muscle contraction induced by Na+ channel activators, veratridine and batrachotoxin. Eur J Pharmacol. 1991;205:199–202. doi: 10.1016/0014-2999(91)90820-g. [DOI] [PubMed] [Google Scholar]
- Shinjoh M, Nakaki T, Otsuka Y, Sasakawa N, Kato R. Contraction of vascular smooth muscle by Na+ channel activators: involvement of Ca2+ channels. Jpn J Pharmacol. 1992;58(suppl. 2):376P. [PubMed] [Google Scholar]
- Sperelakis N, Inoue Y, Ohya Y. Fast Na+ channels and slow Ca2+ current in smooth muscle from pregnant rat uterus. Mol Cell Biochem. 1992;114:79–89. [PubMed] [Google Scholar]
- Strege PR, Holm AN, Rich A, Miller SM, Ou Y, Sarr MG, et al. Cytoskeletal modulation of sodium current in human jejunal circular smooth muscle cells. Am J Physiol Cell Physiol. 2003;284:C60–C66. doi: 10.1152/ajpcell.00532.2001. [DOI] [PubMed] [Google Scholar]
- Sturek M, Hermsmeyer K. Calcium and sodium channels in spontaneously contracting vascular muscle cells. Science. 1986;233:475–478. doi: 10.1126/science.2425434. [DOI] [PubMed] [Google Scholar]
- Wang SY, Wang GK. Voltage-gated sodium channels as primary targets of diverse lipid-soluble neurotoxins. Cell Signal. 2003;15:151–159. doi: 10.1016/s0898-6568(02)00085-2. [DOI] [PubMed] [Google Scholar]
- Yamamoto Y, Fukuta H, Suzuki H. Blockade of sodium channels by divalent cations in rat gastric smooth muscle. Jpn J Physiol. 1993;43:785–796. doi: 10.2170/jjphysiol.43.785. [DOI] [PubMed] [Google Scholar]
- Yoshino M, Wang SY, Kao CY. Sodium and calcium inward currents in freshly dissociated smooth myocytes of rat uterus. J Gen Physiol. 1997;110:565–577. doi: 10.1085/jgp.110.5.565. [DOI] [PMC free article] [PubMed] [Google Scholar]
- Zhang Z, Huang JM, Turner MR, Rhinehart KL, Pallone TL. Role of chloride in constriction of descending vasa recta by angiotensin II. Am J Physiol Regul Integr Comp Physiol. 2001;280:R1878–R1886. doi: 10.1152/ajpregu.2001.280.6.R1878. [DOI] [PubMed] [Google Scholar]
- Zhang Z, Rhinehart K, Pallone TL. Membrane potential controls calcium entry into descending vasa recta pericytes. Am J Physiol Regul Integr Comp Physiol. 2002;283:R949–R957. doi: 10.1152/ajpregu.00251.2002. [DOI] [PubMed] [Google Scholar]


