

Abstract
The most serious side-effect of the widely used aminoglycoside antibiotics is irreversible intracellular damage to the auditory and vestibular hair cells of the inner ear. The mechanism of entry into the hair cells has not been unequivocally resolved. Here we report that extracellular dihydrostreptomycin not only blocks the mechano-electrical transducer channels of mouse outer hair cells at negative membrane potentials, as previously shown, but also enters the cells through these channels, which are located in the cells' mechanosensory hair bundles. The voltage-dependent blocking kinetics indicate an open-channel block mechanism, which can be well described by a two barrier–one binding site model, quantifying the antibiotic's block of the channel as well as its permeation in terms of the associated rate constants. The results identify the open transducer channels as the main route for aminoglycoside entry. Intracellularly applied dihydrostreptomycin also blocks the transducer channels, but at positive membrane potentials. However, the potency of the block was two orders of magnitude lower than that due to extracellular dihydrostreptomycin. Extracellular Ca2+ increases the free energy of the barrier nearest the extracellular side and of the binding site for dihydrostreptomycin. This reduces both the entry of dihydrostreptomycin into the channel and the channel's affinity for the drug. In vivo, where the extracellular Ca2+ concentration in the endolymph surrounding the hair bundles is < 100 μm, we predict that some 9000 dihydrostreptomycin molecules per second enter each hair cell at therapeutic drug concentrations.
Aminoglycosides are the most commonly used antibiotics worldwide (Forge & Schacht, 2000). They are highly effective in the treatment of serious Gram-negative bacterial infections. However, these drugs are nephro and ototoxic (Garetz & Schacht, 1996; Forge & Schacht, 2000). While renal toxicity is reversible, any damage to the inner ear is usually permanent because the drugs mainly affect the sensory hair cells (Hawkins, 1976), which in mammals have no (cochlea) or limited (vestibular organs) regeneration potential (Forge et al. 1993; Warchol et al. 1993). Protracted exposure to aminoglycoside antibiotics leads at first to stereociliary damage and subsequently to hair-cell degeneration (Wersäll et al. 1973), most likely due to the formation of free radicals and the apoptotic cell-death pathway (Forge & Schacht, 2000). Mitochondrial dysfunction due to genetic variation may exacerbate the susceptibility to aminoglycoside ototoxicity (Cortopassi & Hutchin, 1994). In the cochlea, the toxic effects of aminoglycosides are first evident in outer hair cells (OHCs) positioned in the basal (high frequency) region of the sensory neuroepithelium, with inner hair cells (IHCs) being more resistant than OHCs (Forge & Schacht, 2000; Nakashima et al. 2000).
Aminoglycosides are large, lipid insoluble, polycationic molecules that are known to block a variety of ion channels including large-conductance Ca2+-activated K+ channels (Nomura et al. 1990), Ca2+ channels (Pichler et al. 1996) and ryanodine receptors (Mead & Williams, 2002). In hair cells, aminoglycosides have been reported to block transducer channels (Ohmori, 1985; Kroese et al. 1989; Denk et al. 1992; Kros et al. 1992; Kimitsuki & Ohmori, 1993; Ricci, 2002), ATP receptors (Lin et al. 1993), nicotinic acetylcholine receptors (nAChRs; Blanchet et al. 2000) and large-conductance Ca2+-activated K+ channels (Dulon et al. 1995). The ototoxic effects of aminoglycosides have been suggested to be due to intracellular cytotoxic effects depending upon entry of the drug molecules into the hair cells (Hiel et al. 1993). Blockage of these various ion channels was not thought to lead directly to entry into the hair cells. Instead, various endocytotic pathways via the basolateral (Lim, 1986) or apical cell membranes (de Groot et al. 1990; Hashino & Shero, 1995; Richardson et al. 1997) have been proposed to be responsible. The possibility that these molecules might enter the cells through the transducer channel pore was considered unlikely (Kroese et al. 1989) as the relevant dimensions of aminoglycosides were estimated to be larger than the pore size of the transducer channel (about 0.7 nm, based on permeation by TEA: Ohmori, 1985; Howard et al. 1988). However, a recent study on turtle hair cells has re-estimated the diameter of the transducer channel pore, using amine compounds, to be around 1.25 nm in its narrowest part (Farris et al. 2004), suggesting that aminoglycoside antibiotics may after all be able to pass through the transducer channel. For example, dihydrostreptomycin (DHS) is an elongated linear molecule with an estimated end-on diameter of the order of 0.8 nm. Recent findings using mouse OHCs have demonstrated that in the presence of FM1-43, a permeant blocker of the transducer channel (Gale et al. 2001; Meyers et al. 2003), the ototoxicity of neomycin was reduced, suggesting that both drugs may compete for the same mechanism to enter these sensory cells (Gale et al. 2001). The aim of this study was to investigate the molecular nature of the blocking mechanism of the mechano-electrical transducer channel by the representative aminoglycoside antibiotic DHS and to test the hypothesis that aminoglycosides can permeate these channels.
Methods
Tissue preparation
OHCs (n = 114) were studied in acutely dissected organs of Corti from CD-1 mice (Swiss CD-1, Charles Rivers, Margate, UK) from postnatal day 5 (P5) to P8, where the day of birth is P0. Mice were killed by cervical dislocation in accordance with UK Home Office regulations. The organs of Corti were dissected and transferred to a microscope chamber and immobilized under a nylon mesh with a stainless steel ring. The chamber (volume about 2 ml) was perfused at a flow rate of about 10 ml h−1 by a peristaltic pump, with extracellular solution containing (mm): 135 NaCl, 5.8 KCl, 1.3 CaCl2, 0.9 MgCl2, 0.7 NaH2PO4, 5.6 d-glucose, 10 Hepes-NaOH, 2 sodium pyruvate. Amino acids and vitamins for Eagle's minimum essential medium (MEM), without l-glutamine, were added from concentrates (Invitrogen, Paisley, UK). The pH was adjusted to 7.5 with NaOH and the osmolality was about 308 mmol kg−1. The preparations were observed under an upright microscope (Zeiss ACM, Germany) with Nomarski differential interference contrast optics (40× water immersion objective and 16× eyepieces). To expose the basolateral surfaces of the cells, a small tear was made in the epithelium with a suction pipette (tip diameter about 2–4 μm) filled with normal extracellular solution. Only cells of healthy appearance (criteria included smooth surface of the cell membrane, absence of vacuoles in the cytoplasm and lack of Brownian motion of mitochondria) and with well-preserved hair bundles were investigated.
Electrical recordings
Third-row OHCs, positioned in the apical coil of the cochlea, were whole-cell voltage clamped using an EPC7 or EPC8 (HEKA, Lambrecht, Germany) patch clamp amplifier. All current recordings were performed at room temperature (22–24°C). Patch pipettes were pulled from soda glass capillaries (Harvard Apparatus, Edenbridge, UK). In order to reduce the electrode capacitance, the shank of the electrode was coated with surf wax (Mr Zogs SexWax, Carpinteria, CA, USA). The recording electrodes had a resistance in the extracellular solution of about 2–3 MΩ. The pipette filling solution contained (mm): 135 CsCl, 2.5 MgCl2, 1 EGTA-CsOH, 2.5 Na2ATP, 10 sodium phosphocreatine, 5 Hepes-CsOH (pH adjusted to 7.3 with CsOH, osmolality about 290 mosmol kg−1). For the experiments designed to determine the effects of intracellular dihydrostreptomycin (DHS; Sigma, Gillingham, UK) on the transducer current, different concentrations (10 μm, 100 μm, 1 mm or 10 mm) of the antibiotic were added to the above intracellular solution. When 10 mm DHS was used, the concentration of CsCl was reduced to keep osmolality constant. Data were acquired using Asyst software (Keithley Instruments, Rochester, NY, USA), filtered at 2.5 kHz, sampled at 5 kHz and stored on computer for off-line analysis using Origin software (OriginLab, Northampton, MA, USA).
Hair bundles (3.5–4.5 μm height) of OHCs were mechanically stimulated by a fluid jet driven by a piezoelectric disc as described before (Kros et al. 1992; Rüsch et al. 1994). Saturating mechanical stimuli were applied either as 45 Hz sinusoids or as force steps of 50 ms duration (filtered at 1 or 1.5 kHz, 8-pole Bessel). Excitatory and inhibitory steps of the same magnitude were always alternated to avoid building up pressure in the fluid jet. The size of the transducer currents was obtained as the difference between the currents in response to excitatory and inhibitory stimuli (measured as peak-to-peak currents for sinusoids and steady-state current for steps). In four cells bundle movements in response to saturating sinusoids were recorded with a laser differential interferometer (Géléoc et al. 1997), resulting in maximum displacement amplitudes at the bundles' tips of 196 ± 8 nm (n = 4). Mechanical steps filtered at 1 kHz were sigmoidal in onset but could be approximately fitted with a single exponential with a time constant of 140 μs. Membrane capacitance (Cm) was 6.3 ± 0.1 pF (n = 114) and series resistance after electronic compensation of up to 80% (Rs) was 3.3 ± 0.2 MΩ (n = 144, range from 0.7 to 8.3 MΩ), resulting in voltage-clamp time constants of 20.6 ± 1.1 μs (n = 114). All membrane potentials were corrected for a −4 mV liquid junction potential between pipette and bath solution. No correction was made for the voltage drop across this series resistance, which was at most 6 mV at extreme potentials. The majority of voltage clamp protocols are referred to a holding potential of −84 mV.
Extracellular superfusion
OHCs were locally superfused with DHS at concentrations ranging from 0.1 μm to 1 mm. These concentrations were obtained by diluting 10 or 100 mm stock solutions of DHS (molecular weight = 730.7) with extracellular solution. Extracellular Ca2+ concentrations tested were nominally zero (no added EGTA), 30 μm, 100 μm, 1.3 mm and 5 mm. We initially chose 100 μm as the standard low Ca2+ concentration in order to reach a reliable concentration of the ion by simple addition of CaCl2 without the need to measure with a Ca2+-sensitive electrode, as there might be some contamination in the other salts or in the purified H2O. The nominal zero Ca2+ irreversibly abolished the transducer currents after about a minute of continuous superfusion (n = 6), indicating any Ca2+ contamination in the superfusion solution was likely to be below 10 μm (Corey & Hudspeth, 1979; Crawford et al. 1991). Mg2+, amino acids and vitamins were omitted from all locally superfused solutions and the concentration of NaCl was adjusted to keep the osmolality constant. These solutions were applied through a multibarrelled pipette positioned close to the patched hair cell. For every solution change, the fluid jet used for stimulating the hair bundles was filled with the new solution by suction through its tip to prevent dilution of the drug concentration in the superfused solution around the hair bundle during stimulation. Since the block of the transducer current by DHS developed rapidly and was usually completely reversible within a few seconds after washout, in some OHCs more than one concentration of the drug was tested. Normal DHS-free extracellular solution was superfused over these cells and control responses were recorded before application of the next concentration of the drug.
Statistical analysis
Statistical comparisons of means were made by Student's two-tailed t test (paired or unpaired as appropriate) or, for multiple comparisons, using analysis of variance (one-way ANOVA followed by Tukey's test). Two-way ANOVA followed by Bonferroni's test was used to compare the effects of DHS application in the presence of different extracellular Ca2+ concentrations (Figs 8A and 9A). P < 0.05 was used as the criterion for statistical significance. Mean values are quoted ± s.e.m. in text and figures.
Figure 8. Extracellular Ca2+ reduces the potency of the block of the transducer channel by dihydrostreptomycin.

A, dose–response curves for the block of the transducer current by DHS during the superfusion of 0.1 mm (n = 22), 1.3 mm (n = 35) and 5 mm (n = 25) Ca2+ at a membrane potential of −84 mV. The fitted parameters (eqn (4)) are: 0.1 mm Ca2+: KD= 1.6 ± 0.1 μm, nH= 0.82 ± 0.05 (number of measurements from left to right: 5, 4, 6, 3, 5, 5, 4, 5, 3); 1.3 mm Ca2+: as in Fig 2D; and 5 mm Ca2+: KD= 19.0 ± 1.5 μm, nH= 0.83 ± 0.05 (8, 4, 9, 6, 7, 7, 3, 4). B, averaged normalized transducer currents, including those shown in Fig. 7B–D, recorded in the presence of 50 μm DHS and different extracellular Ca2+ concentrations plotted as a fraction of the control currents (IDHS/Ic). The fits through the data are according to eqns (1) and (2) in which Δδ (0.91) and δb (0.79) were kept constant as in Fig. 5, but with different values of ΔE (0.1 mm Ca2+: 5.84 kT; 5 mm Ca2+: 4.34 kT) and Eb (0.1 mm Ca2+: −8.24 kT; 5 mm Ca2+: −6.94 kT).
Figure 9. The kinetics of dihydrostreptomycin entering the transducer channel are slowed by extracellular Ca2+.

A, decay time constant of the current recorded at a membrane potential of −84 mV during superfusion with different DHS concentrations in the presence of 0.1 mm (n = 17), 1.3 mm (n = 34) and 5 mm (n = 11) Ca2+. Numbers of measurements from left to right are: 0.1 mm Ca2+ 5, 5, 5, 6, 5; 1.3 mm Ca2+ 6, 6, 7, 18, 7, 10; 5 mm Ca2+ 5, 3, 6, 3, 4, 3, 4. B, analysis of DHS-binding kinetics to obtain the rate-constant k1. The inverse of the time constant of binding (1/τ) as a function of [Do] was evaluated to obtain the rate-constant k1 (eqn (3)). Continuous lines indicate the slopes at 0.1 mm Ca2+ (open triangles, 3.52 × 10⁸ s−1· m−1), 1.3 mm Ca2+ (filled circles, 1.23 × 10⁸ s−1· m−1) and 5 mm Ca2+ (open circles, 0.73 × 10⁸ s−1· m−1). The holding potential was −84 mV in all experiments.
Two barrier–one binding site model of DHS blockage and permeation of the hair cell transducer channel and quantitative determination of DHS entry
The voltage and concentration dependence of extracellular DHS blockage and permeation of the hair cell transducer channel can be quantitatively described by a two barrier–one binding site model (Fig. 1; Woodhull, 1973; cf. Hille, 2001). The reaction scheme, assuming a Hill coefficient nH= 1 (cf. Fig. 2D) is:
where C indicates the unblocked transducer channels, CD the blocked channels, Do and Di the extra- and intracellular blocker, k1 and k2 the forward and k−1 and k−2 the reverse rate constants, which are dependent on the membrane voltage, Vm. Different from what has been previously suggested in bullfrog sacculus (Kroese et al. 1989), DHS was found to block the transducer channel from the intracellular side (Fig. 3) although it was two orders of magnitude less effective than extracellular DHS. This much lower sensitivity of the transducer channel to intracellular DHS can be most parsimoniously modelled by assuming that the concentration of the blocker at the intracellular face of the transducer channels is negligible, i.e. [D]i= 0, which effectively imposes a zero backward flow of DHS. The transducer current that remains in the presence of the blocker, IDHS, normalized to the control current Ic then depends on the extracellular drug concentration [Do], and applied voltage Vm, according to (e.g. Woodhull, 1973; Lane et al. 1991):
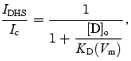 |
(1) |
which equals the Hill equation (eqn (4)) with nH= 1 and half-blocking concentration KD (same unit as [D]o):
 |
(2) |
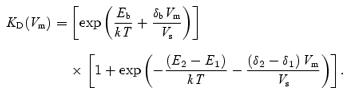
The voltage dependence of the block is thus expressed in terms of KD, which depends on the free energy of the binding site (Eb), the free energy difference of the two barriers (ΔE =E2−E1) at Vm= 0, and the related fractional electrical position of the binding site across the membrane, δb, and distance between the barriers, Δδ=δ2−δ1 (Fig. 1), while the slope factor:
if kT = 4.1 × 10⁻²¹ J (thermal noise energy at room temperature) and z = 2 (valence of DHS), where e is the unitary charge. Fits made using eqns (1) and (2) thus yield values for ΔE, Eb, Δδ and δb.
Figure 1. Energy profile of the two barrier–one binding site model used to describe the blockage and permeation of the hair cell transducer channel by dihydrostreptomycin.

In the absence of a voltage across the membrane (Vm= 0), the two barriers have estimated free energies E1 (11.05 kT) and E2 (15.68 kT) above the free energy level of the minima at the extra- and intracellular sides of the membrane. The barriers are located at relative electrical distances δ1 (range 0–0.09) and δ2 (range 0.91–1), as measured across the membrane from the extracellular side. The two barriers sandwich the binding site of DHS with a minimum in free energy, Eb (−8.27 kT), below zero. The binding site is located at a relative electrical distance δb of 0.79, measured from the extracellular side. Relative electrical positions across the membrane of the two barriers and the binding site, as well as their respective energies are drawn according to values found from fitting these model parameters in 1.3 mm Ca2+.
Figure 2. Extracellular dihydrostreptomycin blocks the OHC transducer channel.

A and B, transducer currents recorded from an apical P7 OHC before (A) and during (B) the superfusion of 50 μm dihydrostreptomycin (DHS) when sinusoidal force stimuli of 45 Hz were used. The cell was held at −84 mV and the membrane potential was stepped, in 20 mV increments, between −144 mV and +96 mV. For clarity only responses to every other voltage step are shown. Driver voltage (DV, amplitude 35 V) to the fluid jet is shown above the traces. Positive DVs are excitatory. Membrane potentials are shown next to some of the traces. Recordings in A and B are the average of 4 repetitions and are offset so that the zero-transducer current levels (responses to inhibitory stimuli) are equally spaced. Cm 6.0 pF; Rs 0.8 MΩ. C, average normalized current–voltage curves for the control transducer currents (n = 30) and the current recorded during the superfusion of 3 μm (n = 9), 10 μm (n = 8) and 50 μm (n = 13) DHS (1.3 mm extracellular Ca2+), when both sine waves and voltage step stimuli were used. Note that the currents have been normalized to the maximal current recorded at +96 mV (Control: 878 ± 36 pA; 3 μm: 980 ± 55 pA; 10 μm: 708 ± 73 pA; 50 μm: 924 ± 61 pA). D, dose–response curves for the block of the transducer current by DHS at three different membrane potentials obtained from 35 apical-coil OHCs. Continuous lines are the fits through the data using eqn (4). Fit at −164 mV: half blocking concentration (KD) = 11.4 ± 0.6 μm, Hill coefficient (nH) = 0.90 ± 0.03 (number of measurements from left to right: 1, 10, 9, 4, 1, 10); −84 mV: KD= 7.0 ± 0.2 μm, nH= 0.96 ± 0.03 (2, 3, 12, 9, 4, 8, 1, 5, 13, 6, 1); −44 mV: KD= 21.2 ± 0.9 μm, nH= 0.96 ± 0.04 (number of measurements as for −84 mV). E, average KD and nH plotted as a function of the membrane potential. Number of measurements: 35 at −164 mV; 50 at −144 mV and −24 mV and 64 for all other potentials tested. The fit through the KD data points is according to eqn (2) with: ΔE =E2−E1= 4.63 kT, Δδ=δ2−δ1= 0.91, Eb=−8.27 kT and δb= 0.79.
Figure 3. Block of the transducer channel by intracellular dihydrostreptomycin.

A and B, transducer currents recorded from apical P7 OHCs in the absence (A) and presence (B) of 10 mm DHS in the intracellular solution and 1.3 mm Ca2+ in the extracellular solution. The cells were held at −84 mV and the membrane potential was stepped, in 20 mV increments, between −164 mV and +156 mV. For clarity only responses to every other voltage step are shown. Driver voltage to the fluid jet was 35 V. Recordings in A and B are averaged from 2 and 3 repetitions, respectively, and are offset so that the zero-transducer current levels (responses to inhibitory stimuli) are equally spaced. A: Cm 5.9 pF; Rs 1.6 MΩ. B: Cm 5.5 pF; Rs 2.0 MΩ. C, normalized current–voltage curves for the transducer currents recorded in the absence (control, n = 7) and in the presence of DHS (10 μm: n = 5; 100 μm: n = 5; 1 mm: n = 6; 10 mm: n = 3) in the intracellular solution, including those shown in A and B. Currents have been normalized to the maximal current recorded at −164 mV (Control: −1417 ± 79 pA; 10 μm: −1437 ± 141 pA; 100 μm: −1367 ± 107 pA; 1 mm: −1294 ± 124 pA; 10 mm: −1271 ± 76 pA). D, dose–response curves for the block of the transducer current by intracellular DHS at three different membrane potentials obtained from 19 apical OHCs. Continuous lines are fits through the data using eqn (4). Fit at +156 mV: KD= 277 ± 44 μm, nH= 0.88 ± 0.10; +76 mV: KD= 742 ± 131 μm, nH= 0.73 ± 0.09; +36 mV: KD= 3567 ± 881 μm, nH= 0.71 ± 0.12 (number of measurements from left to right: 5, 5, 4, 3). E, average KD and nH plotted as a function of the membrane potential including those shown in D. Number of measurements as in D.
Since the drug's binding time constants (Fig. 9A) were found to be at least an order of magnitude slower (∼0.5–3 ms) than the presumed time constant of activation of the transducer current (< 50 μs, Kennedy et al. 2003) absolute rate constants could be determined. First-order kinetics of the reaction scheme (see above, with [D]i= 0) leads to a drug binding time constant, τ, related to the rate constants and extracellular concentration [D]o according to:
| (3) |
At low concentrations (< 5 μm) the observed behaviour of 1/τversus[D]o (Fig. 9B) shows a linear relationship of which the slope was taken to define k1, according to eqn (3) (continuous lines, Vm=−84 mV). From k1 the absolute values of the energy barriers E1 and E2 were calculated using Eyring's rate theory (cf. Hille, 2001) and the values obtained for Eb, ΔE, δb and Δδ. The values of δ2 and δ1, required for this calculation, are restricted by the fitted value obtained for Δδ (i.e. 0 ≤δ1≤ 1 −Δδ= 0.09; 0.91 =Δδ≤δ2≤ 1), and thus lead to a range of values for both E1 and E2 (see Results). Combining these values allows for calculation of k−1 and k2 so that the drug's rate of entry into the hair cells, determined by k2, could also be quantified.
Results
Block of the transducer current by dihydrostreptomycin
Mechano-electrical transducer current in apical-coil OHCs was elicited by alternating inhibitory and excitatory bundle displacements using either sinusoidal or step mechanical stimuli (Kros et al. 1992; Géléoc et al. 1997). The OHCs responded with large transducer currents, up to −1290 pA in the present study, at −84 mV and in 1.3 mm extracellular Ca2+, when the hair bundles were deflected towards the excitatory direction using saturating force stimuli. Figure 2A shows a typical example of mechano-electrical transducer currents from a P7 OHC, elicited by a large sinusoidal mechanical stimulus in which the membrane potential was stepped to a series of levels between −144 mV and +96 mV, from a holding potential of −84 mV. For negative membrane potentials large inward transducer currents were elicited upon moving the bundles towards the kinocilium in the excitatory direction. When the bundles were moved towards the inhibitory direction any transducer channels open in the absence of mechanical stimulation (normally about 5–10%) were closed, resulting in a reduction of the inward current. Starting from −144 mV and stepping the membrane potential to more depolarized values, the transducer currents decreased in size at first and then reversed at +5.5 ± 0.4 mV (n = 43). For more positive membrane potentials, fluid jet stimuli in the excitatory direction caused outward currents. Superfusion of 50 μm DHS reduced the transducer currents in a voltage-dependent manner so that the block was clearly evident at negative potentials and completely released at positive potentials (Fig. 2B).
Figure 2C shows the average current–voltage curves (normalized for the currents at +96 mV) for the peak-to-peak transducer current recorded using either sinusoids or voltage step stimuli, before and during the superfusion of different DHS concentrations. In the absence of the drug the current–voltage relation (Fig. 2C, control) shows the non-linearity that has been described before for OHCs as a possible effect due to the voltage-dependent block of the transducer channel by divalent cations (Kros et al. 1992; Gale et al. 2001). This is consistent with the idea that transducer channels are non-selective cation channels with relatively high permeability, but low conductance, for calcium ions (Ohmori, 1985; Ricci & Fettiplace, 1998). Superfusion of DHS at concentrations between 0.3 μm and 1 mm (see Fig. 2C for 3 μm, 10 μm and 50 μm) resulted in an increase, at hyperpolarized potentials, of the non-linearity of the current–voltage relation. For relatively modest hyperpolarized voltages (down to about −80 mV) DHS increasingly reduces the transducer current when the potential becomes more negative. This result might indicate that DHS behaves as a conventional voltage-dependent blocker (Woodhull, 1973), i.e. the drug molecules enter the channel from the outside and block the ion conducting pathway and this block increases with voltage. However, for large hyperpolarized voltages (negative to about −80 mV) the transducer current recorded in the presence of DHS increases again, implying the blocking site is somehow cleared. This could be explained by the drug molecule escaping through the channel pore into the intracellular side due to the large electrical driving force (permeant channel blocker).
The dose–response curves of the block of the transducer current by DHS are shown in Fig. 2D. The data were fitted with the Hill equation, which is compatible (if nH= 1) with the two barrier–one binding site model described by eqns (1) and (2):
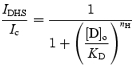 |
(4) |
where IDHS is the current in the presence of the drug, Ic is the control current, KD is the dissociation constant, [D]o the extracellular concentration of the drug and nH is the Hill coefficient. KD was clearly voltage dependent (Fig. 2E, filled circles) in accordance with the model (continuous line through the data fitted with eqn (2)). The Hill coefficient was negligibly voltage dependent, ranging from 0.90 to 0.99 (Fig. 2E, open circles), indicating one binding site for DHS in the transducer-channel pore.
The effect of intracellular DHS on the transducer channel was investigated in 26 apical OHCs (P7). Figure 3A shows mechano-electrical transducer currents recorded, over a range of membrane potentials, from an OHC in the absence of DHS. When concentrations of up to 10 mm DHS were present in the intracellular solution, transducer currents as large as those in the absence of the drug were recorded at negative membrane potentials. However, at increasingly positive potentials the currents were progressively reduced (Fig. 3B). The normalized current–voltage curves for the peak-to-peak transducer current recorded in the control condition and in the presence of different intracellular concentrations of DHS are shown in Fig. 3C. The size of the currents recorded at −164 mV was similar in control and all intracellular DHS concentrations. The presence of DHS resulted in an increase, at depolarized potentials, of the nonlinearity of the normal current-voltage relation, suggesting that at positive membrane potentials the drug molecules are able to enter the channel from the inside and block the ion conducting pathway. Dose–response curves, at three different membrane potentials, of the block of the transducer current by intracellular DHS are shown in Fig. 3D. The KD was strongly voltage dependent (Fig. 3E, filled circles) although it was at least two orders of magnitude larger than that obtained when DHS was applied extracellularly (Fig. 2E). Again, as for extracellular DHS, the Hill coefficient was hardly voltage dependent, ranging from 0.71 to 0.92 (Fig. 3E, open circles).
Time and voltage dependence of the block by extracellular dihydrostreptomycin
The time dependence of the block of the transducer current by extracellular DHS was investigated using force steps instead of sinusoids to stimulate the bundles. To minimize any confounding effects of transducer current adaptation the force steps were made sufficiently large to evoke saturating transducer currents. Figure 4A shows transducer currents from a P7 apical OHC, elicited by excitatory mechanical steps. In the presence of 10 μm DHS and at negative potentials, the transducer current showed a rapid exponential decline to a steady-state value after an initial peak (Fig. 4B), similar to previous findings for amiloride (Rüsch et al. 1994). The time constant of the current relaxation, measured from −164 mV to −64 mV in four OHCs, showed little variation with membrane potential (Fig. 4C). The modest voltage dependence of the time constant is commensurate with the two barrier–one binding site model used to describe the nature of the block throughout the paper, as shown by the continuous line through the data (eqn (3) in Methods). The large noise in the current traces at negative potentials (Fig. 4B) is likely to be due to the stochastic nature of the binding of the drug molecules causing the block. This noise was minimal or absent when very low or high drug concentrations were used and when the block was released at positive potentials, and it was maximal when the concentration of DHS was in the range that causes about 50% reduction of the current.
Figure 4. Time-dependent block of the transducer current by dihydrostreptomycin.

A and B, saturating transducer currents elicited in an apical P7 OHC before (A) and during (B) the superfusion of 10 μm DHS in response to a series of excitatory steps (DV, 25 V). The holding current before the onset of mechanical steps (t = 0 ms) was set to 0 pA. Cm 5.6 pF; Rs 2.8 MΩ. C, time constant of the transducer current relaxation in the presence of 10 μm DHS as a function of membrane potential (P7, n = 4). The fit through the data is according to the two barrier–one binding site model used to describe the nature of the block throughout the paper (eqn (3) in Methods). The fitted parameters are E1= 11.13 kT and E2= 16.34 kT, Eb=−8.27 kT, Δδ=δ2−δ1= 0.91, and δb= 0.79. D, current–voltage curves, constructed by subtracting steady-state currents in response to inhibitory steps from the excitory responses shown in A and B (1.3 mm extracellular Ca2+). For the control current the continuous line through the data is fitted using a single energy barrier model for Ca2+ binding (eqn (5)): Vrev=+6.9 mV, Vrect= 55 mV, Is= 363 pA, γ= 0.48 (n = 43). In the presence of 10 μm DHS the fit through the data was achieved by multiplying the fit to the control currents (eqn (5)) by the blocked fraction prescribed by the two barrier-one binding site model for DHS binding to the channel (eqns (1) and (2), see Methods). Fitting parameters for the DHS-binding model as for Fig. 2E.
The I–Vm curve for the steady-state transducer current recorded in normal extracellular solution (Fig. 4D, continuous line through filled circles) is the fit of a model containing a single energy barrier limiting the Ca2+ conductance (Kros et al. 1992; Gale et al. 2001):
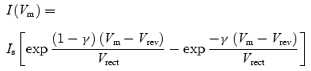 |
(5) |
where Vrev is the reversal potential, Vrect is a proportional measure of the voltage range over which rectification occurs, Is is the current factor, which when divided by Vrect yields the slope conductance at Vrev, and γ is the fractional distance measured from the outside within the membrane's electrical field of the energy barrier. The fit through the data in the presence of 10 μm DHS (Fig. 4D, continuous line through open circles) was achieved by multiplying the fit to the control currents (eqn (5), continuous line through filled circles in Fig. 4D) by the blocked fraction prescribed by the two barrier–one binding site model (eqns (1) and (2), Fig. 1), consistent with a fraction of the blocking drug molecules permeating through the channel.
The voltage dependence of the block of the transducer channel by DHS can be better appreciated by plotting the transducer current in the presence of the drug as a fraction of the control currents against the membrane potential (IDHS/Ic, Fig. 5). At depolarized potentials, the curves for different drug concentrations approach 1, consistent with the positively charged drug molecules being repelled from the channel binding site back into the extracellular solution, thus resulting in a release of the block. At progressively hyperpolarized potentials the block of the transducer current increases. However, for membrane potentials negative to about −80 mV a reduction of the block by DHS of the transducer current is evident over a wide range of concentrations. This is consistent with the blocker being pushed from its binding site and forced through the channel pore into the cytoplasm when sufficient electrical driving force is applied. The fits through the data are according to eqns (1) and (2). In support of the proposed model, the data obtained using the different extracellular concentrations of DHS in 1.3 mm Ca2+ (Fig. 5) could all be satisfactory fitted using the same values for ΔE =E2−E1 (4.63 kT), Δδ (0.91), Eb (−8.27 kT) and δb (0.79) that were obtained from the fit of the voltage dependence of KD with eqn (2) (continuous line in Fig. 2E).
Figure 5. Voltage-dependent block of the transducer current by dihydrostreptomycin.

Transducer currents recorded in the presence of different concentrations of DHS plotted as a fraction of the current in the control solution. OHC bundles were stimulated by either force steps or sinusoids. Continuous lines are fits according to eqns (1) and (2). The data obtained at all DHS concentrations are fitted using the same values as used for Fig. 2E. Number of cells are: 3 (1 μm), 12 (2 μm), 9 (3 μm), 4 (6 μm), 8 (10 μm), 1 (20 μm), 13 (50 μm), 6 (100 μm). Data for 3 μm, 10 μm and 50 μm same as in Fig. 2C.
Mechanism of the block of the transducer channels by extracellular dihydrostreptomycin
To investigate the underlying mechanism for the rapid initial decline in transducer current at negative potentials in the presence of the blocker (Fig. 4B) we performed a more elaborate experimental protocol in which a voltage step was applied during a saturating mechanical step (Rüsch et al. 1994). Starting from the holding potential of −84 mV, large mechanical steps in the excitatory direction resulted in a rapid inward transducer current (Fig. 6A, control). At the start of the mechanical step (t = 0), DHS did not affect the onset kinetics of the transducer current. Following that, the drug caused the current to relax to a steady level, similar to the observations in Fig. 4B, with a time constant that became shorter with increasing drug concentration. This could be interpreted as a sign of open-channel block, i.e. the transducer channel gate has to open first before block can occur, with the time constant reflecting the binding of the blocker to the channel. Stepping the membrane potential to +96 mV (t = 30 ms) fully and rapidly released the block; the initial outward current was even consistently slightly larger in the presence of DHS than in the controls, probably because the drug, by reducing the Ca2+ influx, caused the transducer channels to be less adapted at −84 mV than they would normally be (cf. Denk et al. 1992). The open-channel block interpretation is supported by the time course of the block of the open channels caused by a voltage step from +96 mV, at which the block is fully released, back to −84 mV (t = 90 ms). The time constants following the voltage step were similar to those of the relaxations following the mechanical step, although consistently slightly longer by about 20%. The average time constant of the current decay, obtained by combining the values from both the mechanical and electrical step conditions (Fig. 6A), varied significantly (P < 0.0001) with the DHS concentration (see Fig. 9A).
Figure 6. Extracellular dihydrostreptomycin is an open-channel blocker of the transducer channel.

A, voltage jump experiment in a P7 OHC, before (average of 6 repetitions) and during superfusion of 6 μm and 10 μm (10 averages each) of DHS. Between the applications of each drug concentration, the cell was superfused with a drug-free solution. The washout refers to the end of the experiment (6 repetitions). The OHC was held at a membrane potential of −84 mV and voltage stepped to +96 mV during the application of a 35 V mechanical step. Electrical stimuli and a combination of mechanical and electrical stimuli were alternated. Currents shown are the result of subtracting responses to electrical stimuli alone from the combination of both stimuli to eliminate linear leak and voltage-dependent currents. Cm 6.7 pF; Rs 5.6 MΩ. B, transducer channels were first closed by inhibitory bundle displacement (DV: −25 V; first 3 ms). Then, a large saturating current was elicited by stimulating the bundles in the excitatory direction (DV, +25 V) at the holding potential of −84 mV. The P6 OHC was first superfused in drug-free solution and then with 100 μm DHS. The peak current was −711 pA for the control current and −107 pA for current in the presence of the drug (both average of 10 repetitions). The tail currents at the end of the excitatory step were fitted by a single exponential (control, τ= 0.14 ms) or a double exponential (100 μm DHS, τfast= 0.20 ms, τslow= 2.27 ms), superimposed on the data. Cm 6.2 pF; Rs 3.6 MΩ.
The kinetics of closure of the transducer channel were investigated by analysing the tail current upon the transition from a large excitatory mechanical step to a large inhibitory step, in the presence and absence of the drug (Fig. 6B). In the control condition, the offset of the transducer current could be well fitted by a single exponential with a mean time constant of 0.24 ± 0.04 ms (n = 8). This was slightly slower, but not significantly so, than the onset time constants for these same cells (0.17 ± 0.03 ms). In the presence of 100 μm DHS fitting the tail currents required an additional slow time constant, so that paradoxically the transducer current in the presence of the blocker is larger than in the control condition. The fast component, measured using 50 or 100 μm of the drug, was not significantly different from the control and was 0.22 ± 0.03 ms (n = 8) and the slow time constant was 2.69 ± 0.32 ms (n = 8). The additional slow component when DHS was present implies that the drug has to be removed from its binding site in the open state before the channel can close, as described for the block of the K+ current by TEA in squid giant axons (Armstrong, 1966). This mechanism fits in with the disappearance of the gating compliance under blocked conditions of the transducer channel (Howard & Hudspeth 1988), so that the conformational swing of the open to the closed state, normally reflected in a gating compliance, is prevented (e.g. Denk et al. 1992; Wiersinga-Post & van Netten, 1998) or slowed down by the presence of the drug in the channel pore.
The block of the transducer channel by extracellular dihydrostreptomycin is Ca2+ dependent
Calcium entry into the hair cells through the mechano-electrical transducer channel exerts a major role in regulating adaptation properties of the transducer current (Eatock et al. 1987; Assad et al. 1989; Crawford et al. 1989). Typical examples of transducer currents elicited at the holding potential of −104 mV, using 45 Hz sinusoidal force stimuli, in the presence of 100 μm (red trace), 1.3 mm (black trace) and 5 mm (blue trace) Ca2+ are shown in Fig. 7A. The decrease of the resting transducer current, i.e. in the absence of bundle deflection, as extracellular Ca2+ is increased is consistent with Ca2+ inducing a degree of adaptation and thus closing some transducer channels (Assad et al. 1989; Crawford et al. 1989). Moreover, the maximum amplitude of the transducer current was reduced when the extracellular Ca2+ was increased, thus supporting the idea mentioned above that Ca2+ acts as a permeant blocker of the transducer channel (Howard et al. 1988; Crawford et al. 1991; Kros et al. 1992; Ricci & Fettiplace, 1998; Gale et al. 2001). Since Ca2+ and DHS are both capable of blocking but also permeating the transducer channel, we studied the effects of the drug when the extracellular Ca2+ concentration was varied. Figure 7B–D shows transducer currents recorded before (left panels) and during (right panels) superfusion of 50 μm DHS in the presence of 100 μm (Fig. 7B), 1.3 mm (Fig. 7C) or 5 mm (Fig. 7D) extracellular Ca2+. The block of the transducer current by DHS, at negative membrane potentials, was clearly Ca2+ dependent, being more effective for lower Ca2+ concentrations (Fig. 7B–D, right panels). At −84 mV the amplitude of the transducer current remaining in the presence of 50 μm DHS depended significantly (P < 0.005) on Ca2+ concentration. In 5 mm Ca2+ the remaining current was larger (−207 ± 21 pA, n = 7, P < 0.001) compared to that obtained in either 1.3 mm Ca2+ (−106 ± 10 pA, n = 13) or 100 μm Ca2+ (−44 ± 6 pA, n = 3) despite the fact that the control current in 5 mm Ca2+ in the absence of the blocker was significantly (P < 0.001) smaller (5 mm Ca2+: −471 ± 50 pA; 1.3 mm Ca2+: −770 ± 47 pA; 100 μm Ca2+: −1170 ± 82 pA).
Figure 7. The block of the transducer channel by dihydrostreptomycin is Ca2+ dependent.

A, transducer currents in a P6 OHC elicited by sinusoidal force stimuli of 45 Hz (DV, amplitude 35 V) at a potential of −104 mV, using 0.1 mm (red trace), 1.3 mm (black trace) and 5 mm (blue trace) extracellular Ca2+. Note that the sizes of both the maximum and the resting transducer current change with the extracellular Ca2+ concentration. Cm 6.8 pF; Rs 2.6 MΩ. B–D, transducer currents recorded (DV: 35 V) in the presence of different extracellular Ca2+ concentrations before (left column) and during (right column) superfusion of 50 μm DHS. The OHCs were held at −84 mV and the membrane potential was stepped between −104 mV and +96 mV in 20 mV increments. For clarity only responses to −104 mV and +96 mV voltage steps are shown. All records are single traces. B, P7 Cm 6.3 pF; Rs 2.1 MΩ. C, P5 Cm 6.2 pF; Rs 5.3 MΩ. D, P6 Cm 6.5 pF; Rs 5.6 MΩ.
Dose–response curves of the block of the transducer current by DHS at a membrane potential of −84 mV, in the presence of 100 μm, 1.3 mm and 5 mm Ca2+ are shown in Fig. 8A. The data are fitted with the Hill equation (eqn (4)). KD (P < 0.0001) but not nH varied significantly as a function of the Ca2+ concentration. The block by DHS increased with decreasing Ca2+ concentration. A similar Ca2+ dependence of the block of the transducer channel by DHS has been previously reported in lateral line, vestibular and auditory hair cells of lower vertebrates (Kroese & van den Bercken, 1980, 1982; Kroese et al. 1989; Ricci, 2002). While most experiments investigating the effect of low extracellular Ca2+ were conducted using 100 μm Ca2+, 30 μm Ca2+, nearer the concentration measured in rat endolymph (Bosher & Warren, 1978), was also used. In 30 μm Ca2+ the fraction of current remaining in 3 μm DHS, at −84 mV, was 0.39 ± 0.06 (n = 4), similar to that using 100 μm Ca2+ (0.38 ± 0.02, n = 5). The effect of extracellular Ca2+ on the voltage dependence of the block of the current by DHS is depicted in Fig. 8B, where the transducer current as a fraction of the control current is plotted against membrane potential. Measurements at a fixed DHS concentration (50 μm) and different Ca2+ concentrations were well fitted using eqns (1) and (2) with the same Δδ and δb values used for the fits in Fig. 5 but with different values for ΔE and Eb (see Discussion). The curves show that when extracellular Ca2+ was reduced the block by the drug at negative membrane potentials was increased.
To test whether the time constant of the transducer current relaxation in the presence of DHS, indicative of open-channel block, was affected by changing the extracellular Ca2+ concentration we used the combined mechanical and voltage step protocol of Fig. 6A. Figure 9A shows that the time constant of the current decay at −84 mV (averaged from responses to mechanical and voltage steps as in Fig. 6A) in the presence of the drug, varies significantly (P < 0.0001) with Ca2+ concentration, with faster time constants being observed in lower Ca2+ concentrations. In experiments with 30 μm Ca2+ the time constant of the onset of block by 3 μm DHS (0.54 ± 0.06 ms, n = 7) was slightly faster than in 100 μm Ca2+ (0.74 ± 0.06 ms, n = 5).
The time constants of binding were further analysed to obtain the absolute rate of entry of DHS molecules into the hair cells. For this, the rate constants associated with the two energy barriers of the model need to be calculated (see Fig. 1 and Methods). Using the inverse of the time constant of DHS binding kinetics and its dependence on DHS concentration [D]o (Fig. 9A), values of the rate constant k1 (identical to the slopes of the linear fits to Fig. 9B) were determined at different Ca2+ concentrations (eqn (3)). Values of k1 were further used to estimate E1 (range 10.75–11.34 kT; mean 11.05 kT at 1.3 mm Ca2+), in combination with the range of δ1 that is limited by the fitted parameter Δδ= 0.91 (see Methods). Equivalently, using ΔE = 4.63 kT, obtained from fitting dose–response (Fig. 2D) and current–voltage (Fig. 5) curves and E1, the value of E2 (range 15.38–15.97; mean 15.68 kT) was derived. This in turn enabled the calculation of the mean rate constants k−1 and k2. Figure 1 shows the position and the size of the energy barriers and the DHS binding site for 1.3 mm extracellular Ca2+. Results for the three different Ca2+ concentrations for which sufficiently complete data were collected are summarized in Table 1.
Table 1.
Energy barriers, their locations, and rate constants
| [Ca2+] (mm) | E1 (kT) | E2 (kT) | ΔE (kT) | Eb (kT) | Δδ | δb | k1 (−84 mV) (s−1m−1) | k−1 (−84 mV) (s−1) | k2 (−84 mV) (s−1) |
|---|---|---|---|---|---|---|---|---|---|
| 0.1 | 10.00 | 15.84 | 5.84 | −8.24 | 0.91 | 0.79 | 3.52 × 10⁸ | 522 | 594 |
| 1.3 | 11.05 | 15.68 | 4.63 | −8.27 | 0.91 | 0.79 | 1.23 × 10⁸ | 177 | 675 |
| 5 | 11.62 | 15.96 | 4.34 | −6.94 | 0.91 | 0.79 | 0.73 × 10⁸ | 670 | 3410 |
Summary of parameters obtained from fitting the two barrier one-binding-site model to the measured data.
Discussion
Nature of the interaction between dihydrostreptomycin and the transducer channel
The present study demonstrates that the aminoglycoside antibiotic dihydrostreptomycin rapidly and reversibly blocks the current flowing though mechano-electrical transducer channels in mouse cochlear OHCs. The voltage-dependent block of the transducer channel by DHS applied extracellularly, with positive membrane potentials releasing the block, is consistent with previous findings in bullfrog saccular (Kroese et al. 1989) and chick cochlear (Kimitsuki & Ohmori, 1993) hair cells. The observed increase of the block of the current by DHS for hyperpolarizing potentials up to about −80 mV could be explained as the enhanced rate of movement of positively charged molecules from the extracellular solution to a binding site within the membrane's electric field (Woodhull, 1973). Our novel finding that intracellular DHS can also block the transducer current shows that the drug binding site is accessible from both sides of the membrane, contributing to the various lines of evidence discussed below that the binding site is inside the channel pore. Due to the high internal energy barrier (Fig. 1), DHS block is much less effective from the intracellular side. This, together with the broadly opposite voltage dependence to extracellular DHS, means that block by intracellular DHS can be ignored at physiological driving forces of about −150 mV across the transducer channel. Another interesting behaviour of the blocking mechanism by extracellular DHS is its Ca2+ dependency, with near endolymphatic (100 μm) extracellular Ca2+ increasing the potency of DHS block (Fig. 8). The dependence of the DHS-induced channel block on Ca2+, itself a permeant blocker of the hair cells transducer channel (Howard et al. 1988; Crawford et al. 1991; Ricci & Fettiplace, 1998), adds further support to the idea that the drug-binding site is within the channel permeation pathway. A similar interaction between a permeant ion like Ca2+ and channel blockers has previously been described for Ca2+ channels (Lansman et al. 1986; Hille, 2001) and the transducer channel itself (Gale et al. 2001) and explained as the permeant ion competing with the charged blocker molecule for the same binding site within the channel pore. A reduction in the blocking effect of aminoglycosides by Ca2+ has also been described in the lateral line (Kroese & van den Bercken, 1980, 1982), the vestibular system (Bernard, 1983; Kroese et al. 1989) and the cochlea (Takada & Schacht, 1982; Ricci, 2002).
The exponential time course of relaxation of the transducer current with the drug present in the extracellular solution (Figs 4B and 6) indicates that DHS molecules move into the pore to block the channel only after it has been opened by the mechanical stimulus, indicative of an open-channel block (Armstrong, 1966). Although no evidence for an open-channel block mechanism by DHS was found in chick and turtle cochlear hair cells (Kimitsuki & Ohmori, 1993; Ricci, 2002) the authors have suggested that the binding of the drug to the transducer channel was possibly too fast to be detected under their recording conditions. However, indirect evidence based on hair-bundle mechanics for open-channel block by aminoglycosides has been presented for the transducer channel in frog saccular hair cells (Denk et al. 1992).
Since a charged blocker molecule situated in the channel pore is sensitive to the transmembrane potential, large negative or positive membrane potentials should produce either a complete block (non-permeant blocker) of the channel or a relief of the block (permeant blocker) (Woodhull, 1973; French & Wells, 1977; Lane et al. 1991). In hair cells, DHS produced a voltage-dependent block of the transducer channel that never became complete even at very hyperpolarized potentials. This behaviour also resembles that previously described for other classes of ion channel blockers (French & Wells, 1977; Lansman et al. 1986; Lansman, 1990; Chow, 1991; Frings et al. 1995; Haynes, 1995; Koh et al. 1995; Bähring et al. 1997) and in each case this was interpreted as the ability of charged blockers to permeate the channel pore when a sufficiently large electrical driving force was applied across the membrane (permeant channel blockers). Evidence for aminoglycosides acting as permeant blockers has also been presented for ryanodine receptors (Mead & Williams, 2002). In addition to aminoglycosides, the hair cell mechano-electrical transducer channel has been shown to be permeable to the styryl dye FM1-43 (Gale et al. 2001; Meyers et al. 2003) and various other amine compounds, which has led to an estimate of the diameter of the transducer channel pore of around 1.25 nm (Farris et al. 2004).
The punch-through model explains the dose and voltage dependence of the block of the transducer channel by dihydrostreptomycin
Several models have been proposed to explain the variety of blocking mechanisms of voltage- or mechano-activated channels (Hille, 2001). Most of these mechanisms could be sufficiently well explained by one of the four following models previously described (Lane et al. 1991): plug, partial, punch-through and conformational. Our first approach was to exclude the models that could not explain all of the following features observed for the block of the mechano-electrical transducer channel by extracellular DHS: the voltage dependence of the block with depolarized potentials releasing the block, the partial release of the block at hyperpolarized potentials, the concentration-dependent relaxation time of the block, and the Ca2+ dependence of the block. Both the plug and the partial block models predict that the block of the channel should converge to an asymptotic value (zero for the plug model and nonzero for the partial model) when the membrane potential is stepped to increasingly hyperpolarized values (Lane et al. 1991). The lack of convergence seen in Fig. 5 shows that both models clearly fail to explain our results. Of the remaining two models, the conformational model assumes that at extreme hyperpolarized potentials the block of the channel by the drug becomes voltage independent and therefore that the channel conductance depends only on the blocker concentration. This conformational model has been applied to describe the blocking mechanism by amiloride of stretch-activated channels (Lane et al. 1991) and also of the OHC transducer channel (Rüsch et al. 1994). Again, this prediction does not describe the blocking behaviour of the transducer channel observed in the presence of DHS (Fig. 5). By contrast, the two barrier–one binding site or punch-through model (see Methods and Fig. 1) predicts that for small membrane hyperpolarizations the drug will bind to and block the channel preventing ion conduction and that when sufficiently large hyperpolarizing voltages are applied the blocker can be pushed through the channel into the intracellular compartment. This model accounts for several features of the block as can be judged from the adequate fits through the experimental data: the voltage dependence of the KD (Fig. 2E), the voltage and concentration dependence of the block (Figs 2D, 4D and 5), the exponential, concentration-dependent blocking kinetics (Fig. 6A), the modest voltage dependence of the time constant (Fig. 4C), the Ca2+ dependence of the block (Fig. 8) and the linear dependence of 1/τ upon DHS concentration (Fig. 9B). For the voltage and concentration dependence, four parameters are required which we expressed in physically interpretable quantities (Fig. 1): Eb, the energy level of the drug binding site at zero membrane potential; δb, the site's fractional electrical distance across the membrane; ΔE =E2−E1, the difference between the free energy levels of the two barriers at zero membrane potential; Δδ=δ2−δ1, the fractional electrical distance between the barriers. The same values for these four parameters could be used to fit accurately all our results at 1.3 mm Ca2+. Close examination of the transducer currents recorded in the presence of amiloride and benzamil shows that the block is also partially released at large hyperpolarized potentials (see Figs 3 and 4 in Rüsch et al. 1994), suggesting these drugs also enter OHCs through the transducer channels after all.
Our observations suggest that the binding site for aminoglycosides is situated more deeply in the channel pore, at 0.8 of the fractional electrical distance through the membrane from the extracellular side, than previously assumed (e.g. 0.2: Kroese et al. 1989; 0.4: Kimitsuki & Ohmori, 1993). This discrepancy arises because drug permeation through the channel was not observed or accounted for in these studies and consequently a different model description was used.
An interesting result of fitting the Ca2+ dependence of the block with the two barrier-one binding site model, lies in the changes that Ca2+ imposes on the free energies (Table 1). In the range of extracellular concentrations used for a quantitative analysis of the model parameters (0.1–5 mm), Ca2+ hardly affects the energy level E2 of the intracellularly facing barrier. In contrast, the free energy E1 of the extracellularly facing energy barrier increases by about 1.6 kT when the Ca2+ concentration is raised from 0.1 mm to 5 mm, thus decreasing DHS entry into the pore, while the binding site's free energy Eb is raised by a similar amount, thus reducing the affinity for the blocker. These two effects of increasing extracellular Ca2+ therefore effectively constitute a mechanism similar to competitive binding of Ca2+ and DHS at a single site, but without the need to assume that Ca2+ binds at the same site, although this could be the case. It is possible that the decreased resting open probability in high extracellular Ca2+ may itself contribute to the lower efficacy of DHS block (Kros et al. 2002; Ricci, 2002).
Dihydrostreptomycin enters hair cells through the transducer channel
Our findings are consistent with DHS entering OHCs through the transducer channels by acting as a permeant channel blocker. To estimate the number of DHS molecules entering the hair cells in vivo some assumptions have to be made. As DHS enters through the transducer channels the number would vary depending on sound intensity and indeed aminoglycoside toxicity is reduced in the absence of acoustic stimulation (Hayashida et al. 1989). The resting open probability of the transducer channels is usually estimated at about 0.1, but for OHCs in vivo (at least in the 1st turn of the guinea-pig cochlea) the AC receptor potentials to all but very loud sounds have been reported to be symmetrical, due to an interaction with the tectorial membrane (Russell et al. 1986). This suggests that the cells operate in vivo around the point of maximum sensitivity, corresponding to a resting open probability of the transducer channels of about 0.3 (Kros et al. 1992; Kros, 1996). Using a driving force of 150 mV across the transducer channel (the difference between endocochlear potential and resting potential) and 100 μm extracellular Ca2+, the drug entry, which is proportional to the rate constant k2, is about 1500 s−1 as derived from the measurements in combination with the model. Because there was no significant difference in the blocking potency of DHS between 30 μm (close to the concentration in mammalian endolymph: Bosher & Warren, 1978) and 100 μm extracellular Ca2+, we take our more extensive data obtained in 100 μm Ca2+ as representative of the physiological situation. At the onset of ototoxic symptoms induced by aminoglycoside treatment, drug concentrations of about 1 μm are reached in the endolymphatic compartment (Tran Ba Huy et al. 1981). Combining this extracellular drug concentration of 1 μm with eqns (1) and (2) at −150 mV (about 24% of channels blocked) and the value for the rate constant k2 (1500 s−1) yields about 9000 DHS molecules per second or 0.05 fmol per hour that pass the intracellularly facing energy barrier and thus enter the cell in the absence of sound stimulation. For this estimate we assumed apical-coil OHCs to possess 80 operational transducer channels (e.g. Géléoc et al. 1997; van Netten et al. 2003) and the resting open probability to be 0.3. The calculated rate of drug entry implies that the electrical current through the transducer channels, carried by DHS molecules (z = 2), amounts to about 3 fA at −150 mV, thus confirming that its contribution to the total measured transducer current is negligible. The DHS influx into an OHC through the transducer channels open at rest estimated in the present study (0.05 fmol h−1) can be better appreciated at the cellular level by noting that it would take about 80 s at this rate to reach a 1 μm intracellular concentration in a volume equal to that of an OHC (1150 μm3 for a cylinder of 7 μm diameter and 30 μm length, e.g. Pujol et al. 1998), assuming no outflow or interaction or binding to other hair cell components. From the model it could be calculated that even for 1 mm intracellular DHS the exit rate is still well below the entry rate in 1 μm extracellular DHS. The transducer channel therefore effectively acts as a one-way valve for the passage of DHS, which becomes trapped in the cells so that it accumulates. Drug entry into the hair cells through the transducer channels is likely to be a much faster route of drug uptake than the receptor-mediated endocytosis (Henkel & Almers, 1996) previously suggested (de Groot et al. 1990; Hashino & Shero, 1995).
We propose therefore that the transducer channel is the main entry route for aminoglycoside antibiotics to reach the cytoplasm and cause their ototoxic effects at therapeutic dosages. This notion is in line with various observations on the molecular steps that lead to aminoglycoside ototoxicity. Firstly, entry through the transducer channels would lead to a direct relation between resting transducer current size and drug entry. This may explain why, compared to apical OHCs, basal OHCs, which have larger transducer currents (He et al. 2004) are more susceptible and IHCs (which have smaller transducer currents: Kros et al. 1992) less susceptible to aminoglycoside ototoxicity (Forge & Schacht, 2000). Secondly, the Ca2+ dependence of DHS entry into the hair cell through the transducer channels (Figs 7, 8, 9) agrees with the Ca2+ competition reported for the drug uptake, forming the first step of the molecular mechanisms for aminoglycoside-induced hearing loss (Schacht, 1986). Thirdly, the selective vulnerability of hair cells, as opposed to other sensory cells containing TRP channels (Meyers et al. 2003; Corey et al. 2004), to systemic treatment with aminoglycosides may be related to the unusually high effective electric driving force (150 mV) combined with the low calcium concentration present at a hair cell's apical membrane under normal physiological conditions, enhancing the ‘punch-through’ effect. Fourthly, our conclusion that the mechanically activated transducer channels act as the main route for aminoglycoside uptake in hair cells explains the increased drug uptake and resultant hair cell loss in animals under noise-exposed conditions (Hayashida et al. 1989).
Aminoglycoside ototoxicity is a current clinical problem since these compounds are still widely used for their effectiveness in treating serious Gram-negative bacterial infections (Garetz & Schacht, 1996; Forge & Schacht, 2000). We have provided quantitative estimates of DHS entry through transducer channels into cochlear OHCs that under therapeutic conditions lead to hearing loss. The model describing the permeation of DHS is likely to be applicable to other aminoglycoside antibiotics as well. The understanding of the DHS uptake mechanism described in this study may therefore contribute to attempts to control ototoxic side-effects of treatment with aminoglycoside antibiotics, for example by varying dosage regimes or by exploiting the competition with FM1-43 (Gale et al. 2001).
Acknowledgments
This work was supported by the Medical Research Council. W.M. is a Royal Society University Research Fellow. We thank Professor G. P. Richardson for his comments on an earlier version of the manuscript.
References
- Armstrong CM. Time course of TEA+-induced anomalous rectification in squid giant axons. J General Physiol. 1966;50:491–503. doi: 10.1085/jgp.50.2.491. [DOI] [PMC free article] [PubMed] [Google Scholar]
- Assad JA, Hacohen N, Corey DP. Voltage dependence of adaptation and active bundle movement in bullfrog saccular hair cells. Proc Natl Acad Sci U S A. 1989;86:2918–2922. doi: 10.1073/pnas.86.8.2918. [DOI] [PMC free article] [PubMed] [Google Scholar]
- Bähring R, Bowie D, Benveniste M, Mayer ML. Permeation and block of rat GluR6 glutamate receptor channels by internal and external polyamines. J Physiol. 1997;502:575–589. doi: 10.1111/j.1469-7793.1997.575bj.x. [DOI] [PMC free article] [PubMed] [Google Scholar]
- Bernard C. Action of streptomycin and calcium on the apical membrane of hair cells of the frog isolated semicircular canal. Acta Otolaryngol. 1983;96:21–30. doi: 10.3109/00016488309132871. [DOI] [PubMed] [Google Scholar]
- Blanchet C, Erostegui C, Sugasawa M, Dulon D. Gentamicin blocks ACh-evoked K+ current in guinea-pig outer hair cells by impairing Ca2+ entry at the cholinergic receptor. J Physiol. 2000;525:641–654. doi: 10.1111/j.1469-7793.2000.t01-1-00641.x. [DOI] [PMC free article] [PubMed] [Google Scholar]
- Bosher SK, Warren RL. Very low calcium content of cochlear endolymph, an extracellular fluid. Nature. 1978;273:377–378. doi: 10.1038/273377a0. [DOI] [PubMed] [Google Scholar]
- Chow RH. Cadmium block of squid calcium currents. J General Physiol. 1991;98:751–770. doi: 10.1085/jgp.98.4.751. [DOI] [PMC free article] [PubMed] [Google Scholar]
- Corey DP, Garcia-Anoveros J, Holt JR, Kwan KY, Lin SY, Vollrath MA, Amalfitano A, Cheung EL, Derfler BH, Duggan A, Geleoc GSG, Gray PA, Hoffman MP, Rehm HL, Tamasauskas D, Zhang DS. TRPA1 is a candidate for the mechanosensitive transduction channel of vertebrate hair cells. Nature. 2004;432:723–730. doi: 10.1038/nature03066. [DOI] [PubMed] [Google Scholar]
- Corey DP, Hudspeth AJ. Tonic basis of the receptor potential in a vertebrate hair cell. Nature. 1979;281:675–677. doi: 10.1038/281675a0. [DOI] [PubMed] [Google Scholar]
- Cortopassi G, Hutchin T. A molecular and cellular hypothesis for aminoglycoside-induced deafness. Hear Res. 1994;78:27–30. doi: 10.1016/0378-5955(94)90040-x. [DOI] [PubMed] [Google Scholar]
- Crawford AC, Evans MG, Fettiplace R. Activation and adaptation of transducer currents in turtle hair cells. J Physiol. 1989;419:405–434. doi: 10.1113/jphysiol.1989.sp017878. [DOI] [PMC free article] [PubMed] [Google Scholar]
- Crawford AC, Evans MG, Fettiplace R. The actions of calcium on the mechano-electrical transducer current of turtle hair cells. J Physiol. 1991;434:369–398. doi: 10.1113/jphysiol.1991.sp018475. [DOI] [PMC free article] [PubMed] [Google Scholar]
- de Groot JC, Meeuwsen F, Ruizendaal WE, Veldman JE. Ultrastructural localization of gentamicin in the cochlea. Hear Res. 1990;50:35–42. doi: 10.1016/0378-5955(90)90031-j. [DOI] [PubMed] [Google Scholar]
- Denk W, Keolian RM, Webb WW. Mechanical response of frog saccular hair bundles to the aminoglycoside block of mechanoelectrical transduction. J Neurophysiol. 1992;68:927–932. doi: 10.1152/jn.1992.68.3.927. [DOI] [PubMed] [Google Scholar]
- Dulon D, Sugasawa M, Blanchet C, Erostegui C. Direct measurements of Ca2+-activated K+ currents in inner hair cells of the guinea-pig cochlea using photolabile Ca2+ chelators. Pflugers Arch. 1995;430:365–373. doi: 10.1007/BF00373911. [DOI] [PubMed] [Google Scholar]
- Eatock RA, Corey DP, Hudspeth AJ. Adaptation of mechanoelectrical transduction in hair cells of the bullfrog's sacculus. J Neurosci. 1987;7:2821–2836. doi: 10.1523/JNEUROSCI.07-09-02821.1987. [DOI] [PMC free article] [PubMed] [Google Scholar]
- Farris HE, LeBlanc CL, Goswami J, Ricci AJ. Probing the pore of the auditory hair cell mechanotransducer channel in turtle. J Physiol. 2004;558:769–792. doi: 10.1113/jphysiol.2004.061267. [DOI] [PMC free article] [PubMed] [Google Scholar]
- Forge A, Lin L, Corwin JT, Nevill G. Ultrastructural evidence for hair cell regeneration in the mammalian inner ear. Science. 1993;259:1616–1619. doi: 10.1126/science.8456284. [DOI] [PubMed] [Google Scholar]
- Forge A, Schacht J. Aminoglycoside antibiotics. Audiol Neuro-Otol. 2000;5:3–22. doi: 10.1159/000013861. [DOI] [PubMed] [Google Scholar]
- French RJ, Wells JB. Sodium ions as blocking agents and charge carriers in the potassium channel of the squid giant axon. J General Physiol. 1977;70:707–724. doi: 10.1085/jgp.70.6.707. [DOI] [PMC free article] [PubMed] [Google Scholar]
- Frings S, Seifert R, Godde M, Kaupp UB. Profoundly different calcium permeation and blockage determine the specific function of distinct cyclic nucleotide-gated channels. Neuron. 1995;15:169–179. doi: 10.1016/0896-6273(95)90074-8. [DOI] [PubMed] [Google Scholar]
- Gale JE, Marcotti W, Kennedy HJ, Kros CJ, Richardson GP. FM1-43 dye behaves as a permeant blocker of the hair-cell's mechanotransducer channel. J Neurosci. 2001;21:7013–7025. doi: 10.1523/JNEUROSCI.21-18-07013.2001. [DOI] [PMC free article] [PubMed] [Google Scholar]
- Garetz SL, Schacht J. Ototoxicity: of mice and men. In: Van de Water TR, Popper AN, Fay RR, editors. Clinical Aspects of Hearing. New York: Springer-Verlag; 1996. pp. 116–154. [Google Scholar]
- Géléoc GSG, Lennan GWT, Richardson GP, Kros CJ. A quantitative comparison of mechanoelectrical transduction in vestibular and auditory hair cells of neonatal mice. Proc R Soc Lond B. 1997;264:611–621. doi: 10.1098/rspb.1997.0087. [DOI] [PMC free article] [PubMed] [Google Scholar]
- Hashino E, Shero M. Endocytosis of aminoglycoside antibiotics in sensory hair cells. Brain Res. 1995;704:135–140. doi: 10.1016/0006-8993(95)01198-6. [DOI] [PubMed] [Google Scholar]
- Hawkins JE., Jr . Drug ototoxicity. In: Keidel SD, Neff WD, editors. Handbook of Sensory Physiology. Vol. 5. New York: Springer-Verlag; 1976. pp. 707–748. [Google Scholar]
- Hayashida T, Hiel H, Dulon D, Erre JP, Guilhaume A, Aran JM. Dynamic changes following combined treatment with gentamicin and ethacrynic acid with and without acoustic stimulation. Cellular uptake and functional correlates. Acta Otolaryngol. 1989;108:404–413. doi: 10.3109/00016488909125546. [DOI] [PubMed] [Google Scholar]
- Haynes LW. Permeation and block by internal and external divalent cations of the catfish cone photoreceptor cGMP-gated channel. J General Physiol. 1995;106:507–523. doi: 10.1085/jgp.106.3.507. [DOI] [PMC free article] [PubMed] [Google Scholar]
- He DZZ, Jia S, Dallos P. Mechanoelectrical transduction of adult outer hair cells studied in a gerbil hemicochlea. Nature. 2004;429:766–770. doi: 10.1038/nature02591. [DOI] [PubMed] [Google Scholar]
- Henkel AW, Almers W. Fast steps in exocytosis and endocytosis studied by capacitance measurements in endocrine cells. Curr Opin Neurobiol. 1996;6:350–357. doi: 10.1016/s0959-4388(96)80119-x. [DOI] [PubMed] [Google Scholar]
- Hiel H, Erre JP, Aurousseau C, Bouali R, Dulon D, Aran JM. Gentamicin uptake by cochlear hair cells precedes hearing impairment during chronic treatment. Audiology. 1993;32:78–87. doi: 10.3109/00206099309072930. [DOI] [PubMed] [Google Scholar]
- Hille B. Ion Channels of Excitable Membranes. 3rd edn. Sunderland, MA, USA: Sinauer Associates; 2001. [Google Scholar]
- Howard J, Hudspeth AJ. Compliance of the hair bundle associated with gating of mechanoelectrical transduction channels in the bullfrogs saccular hair cell. Neuron. 1988;1:189–199. doi: 10.1016/0896-6273(88)90139-0. [DOI] [PubMed] [Google Scholar]
- Howard J, Roberts WM, Hudspeth AJ. Mechanoelectrical transduction by hair cells. Ann Rev Biophys Biophys Chem. 1988;17:99–124. doi: 10.1146/annurev.bb.17.060188.000531. [DOI] [PubMed] [Google Scholar]
- Kennedy HJ, Evans MG, Crawford AC, Fettiplace R. Fast adaptation of mechanoelectrical transducer channels in mammalian cochlear hair cells. Nature Neurosci. 2003;6:832–836. doi: 10.1038/nn1089. [DOI] [PubMed] [Google Scholar]
- Kimitsuki T, Ohmori H. Dihydrostreptomycin modifies adaptation and blocks the mechano-electric transducer in chick cochlear hair cells. Brain Res. 1993;624:143–150. doi: 10.1016/0006-8993(93)90072-u. [DOI] [PubMed] [Google Scholar]
- Koh DS, Burnashev N, Jonas P. Block of native Ca2+-permeable AMPA receptors in rat brain by intracellular polyamines generates double rectification. J Physiol. 1995;486:305–312. doi: 10.1113/jphysiol.1995.sp020813. [DOI] [PMC free article] [PubMed] [Google Scholar]
- Kroese ABA, Das A, Hudspeth AJ. Blockage of the transduction channels of hair cells in the bullfrog's sacculus by aminoglycoside antibiotics. Hear Res. 1989;37:203–218. doi: 10.1016/0378-5955(89)90023-3. [DOI] [PubMed] [Google Scholar]
- Kroese ABA, van den Bercken J. Dual action of ototoxic antibiotics on sensory hair cells. Nature. 1980;283:395–397. doi: 10.1038/283395a0. [DOI] [PubMed] [Google Scholar]
- Kroese ABA, van den Bercken J. Effects of ototoxic antibiotics on sensory hair cell functioning. Hear Res. 1982;6:183–197. doi: 10.1016/0378-5955(82)90053-3. [DOI] [PubMed] [Google Scholar]
- Kros CJ. Physiology of mammalian cochlear hair cells. In: Dallos P, Popper AN, Fay RR, editors. The Cochlea. New York: Springer-Verlag; 1996. pp. 318–385. [Google Scholar]
- Kros CJ, Marcotti W, van Netten SM, Self TJ, Libby RT, Brown SDM, Richardson GP, Steel KP. Reduced climbing and increased slipping adaptation in cochlear hair cells of mice with Myo7a mutations. Nat Neurosci. 2002;5:41–47. doi: 10.1038/nn784. [DOI] [PubMed] [Google Scholar]
- Kros CJ, Rüsch A, Richardson GP. Mechano-electrical transducer currents in hair cells of the cultured neonatal mouse cochlea. Proc R Soc Lond B. 1992;249:185–193. doi: 10.1098/rspb.1992.0102. [DOI] [PubMed] [Google Scholar]
- Lane JW, McBride DW, Jr, Hamill OP. Amiloride block of the mechanosensitive cation channel in Xenopus oocytes. J Physiol. 1991;441:347–366. doi: 10.1113/jphysiol.1991.sp018755. [DOI] [PMC free article] [PubMed] [Google Scholar]
- Lansman JB. Blockade of current through single calcium channels by trivalent lanthanide cations. Effect of ionic radius on the rates of ion entry and exit. J General Physiol. 1990;95:679–696. doi: 10.1085/jgp.95.4.679. [DOI] [PMC free article] [PubMed] [Google Scholar]
- Lansman JB, Hess P, Tsien RW. Blockade of current through single calcium channels by Cd2+, Mg2+, and Ca2+. Voltage and concentration dependence of calcium entry into the pore. J General Physiol. 1986;88:321–347. doi: 10.1085/jgp.88.3.321. [DOI] [PMC free article] [PubMed] [Google Scholar]
- Lim DJ. Effects of noise and ototoxic drugs at the cellular level in the cochlea: a review. Am J Otolaryngol. 1986;7:73–99. doi: 10.1016/s0196-0709(86)80037-0. [DOI] [PubMed] [Google Scholar]
- Lin X, Hume RI, Nuttall AL. Voltage-dependent block by neomycin of the ATP-induced whole cell current of guinea-pig outer hair cells. J Neurophysiol. 1993;70:1593–1605. doi: 10.1152/jn.1993.70.4.1593. [DOI] [PubMed] [Google Scholar]
- Mead F, Williams AJ. Block of the ryanodine receptor channel by neomycin is relieved at high holding potentials. Biophys J. 2002;82:1953–1563. doi: 10.1016/S0006-3495(02)75544-6. [DOI] [PMC free article] [PubMed] [Google Scholar]
- Meyers JR, MacDonald RB, Duggan A, Lenzi D, Standaert DG, Corwin JT, Corey DP. Lighting up the senses: FM1-43 loading of sensory cells through nonselective ion channels. J Neurosci. 2003;23:4054–4065. doi: 10.1523/JNEUROSCI.23-10-04054.2003. [DOI] [PMC free article] [PubMed] [Google Scholar]
- Nakashima T, Teranishi M, Hibi T, Kobayashi M, Umemura M. Vestibular and cochlear toxicity of aminoglycosides – a review. Acta Otolaryngol. 2000;120:904–911. doi: 10.1080/00016480050218627. [DOI] [PubMed] [Google Scholar]
- Nomura K, Naruse K, Watanabe K, Sokabe M. Aminoglycoside blockade of Ca2+-activated K+ channel from rat brain synaptosomal membranes incorporated into planar bilayers. J Membr Biol. 1990;115:241–251. doi: 10.1007/BF01868639. [DOI] [PubMed] [Google Scholar]
- Ohmori H. Mechano-electrical transduction currents in isolated vestibular hair cells of the chick. J Physiol. 1985;359:189–217. doi: 10.1113/jphysiol.1985.sp015581. [DOI] [PMC free article] [PubMed] [Google Scholar]
- Pichler M, Wang Z, Grabner-Weiss C, Reimer D, Hering S, Grabner M, Glossmann H, Striessnig J. Block of P/Q-type calcium channels by therapeutic concentrations of aminoglycoside antibiotics. Biochem. 1996;35:14659–14664. doi: 10.1021/bi961657t. [DOI] [PubMed] [Google Scholar]
- Pujol R, Lavigne-Rebillard M, Lenoir M. Development of sensory and neural structures in the mammalian cochlea. In: Rubel EW, Popper AN, Fay RR, editors. Development of the Auditory System. New York: Springer; 1998. pp. 146–192. [Google Scholar]
- Ricci AJ. Differences in mechano-transducer channel kinetics underlie tonotopic distribution of fast adaptation in auditory hair cells. J Neurophysiol. 2002;87:1738–1748. doi: 10.1152/jn.00574.2001. [DOI] [PubMed] [Google Scholar]
- Ricci AJ, Fettiplace R. Calcium permeation of the turtle hair cell mechanotransducer channel and its relation to the composition of endolymph. J Physiol. 1998;506:159–173. doi: 10.1111/j.1469-7793.1998.159bx.x. [DOI] [PMC free article] [PubMed] [Google Scholar]
- Richardson GP, Forge A, Kros CJ, Fleming J, Brown SDM, Steel KP. Myosin VIIA is required for aminoglycoside accumulation in cochlear hair cells. J Neurosci. 1997;17:9506–9519. doi: 10.1523/JNEUROSCI.17-24-09506.1997. [DOI] [PMC free article] [PubMed] [Google Scholar]
- Rüsch A, Kros CJ, Richardson GP. Block by amiloride and its derivatives of mechano-electrical transduction in outer hair cells of mouse cochlear cultures. J Physiol. 1994;474:75–86. doi: 10.1113/jphysiol.1994.sp020004. [DOI] [PMC free article] [PubMed] [Google Scholar]
- Russell IJ, Cody AR, Richardson GP. The responses of inner and outer hair cells in the basal turn of the guinea-pig cochlea and in the mouse cochlea grown in vitro. Hear Res. 1986;22:199–216. doi: 10.1016/0378-5955(86)90096-1. [DOI] [PubMed] [Google Scholar]
- Schacht J. Molecular mechanisms of drug-induced hearing loss. Hear Res. 1986;22:297–304. doi: 10.1016/0378-5955(86)90105-x. [DOI] [PubMed] [Google Scholar]
- Takada A, Schacht J. Calcium antagonism and reversibility of gentamicin-induced loss of cochlear microphonics in the guinea pig. Hear Res. 1982;8:179–186. doi: 10.1016/0378-5955(82)90073-9. [DOI] [PubMed] [Google Scholar]
- Tran Ba Huy P, Manuel C, Meulemans A, Sterkers O, Amiel C. Pharmacokinetics of gentamicin in perilymph and endolymph of the rat as determined by radioimmunoassay. J Infect Dis. 1981;143:476–486. doi: 10.1093/infdis/143.3.476. [DOI] [PubMed] [Google Scholar]
- van Netten SM, Dinklo T, Marcotti W, Kros CJ. Channel gating forces govern accuracy of mechano-electrical transduction in hair cells. Proc Natl Acad Sci U S A. 2003;100:15510–15515. doi: 10.1073/pnas.2632626100. [DOI] [PMC free article] [PubMed] [Google Scholar]
- Warchol ME, Lambert PR, Goldstein BJ, Forge A, Corwin JT. Regenerative proliferation in inner ear sensory epithelia from adult guinea pigs and humans. Science. 1993;259:1619–1622. doi: 10.1126/science.8456285. [DOI] [PubMed] [Google Scholar]
- Wersäll J, Bjorkroth B, Flock A, Lundquist PG. Experiments on ototoxic effects of antibiotics. Adv Otorhinolaryngol. 1973;20:14–41. doi: 10.1159/000393087. [DOI] [PubMed] [Google Scholar]
- Wiersinga-Post JEC, van Netten SM. Amiloride causes changes in the mechanical properties of hair cell bundles in the fish lateral line similar to those induced by dihydrostreptomycin. Proc R Soc Lond B. 1998;265:615–623. [Google Scholar]
- Woodhull AM. Ionic blockage of sodium channels in nerve. J General Physiol. 1973;61:687–708. doi: 10.1085/jgp.61.6.687. [DOI] [PMC free article] [PubMed] [Google Scholar]