

Abstract
Intracellular calcium signals regulate multiple cellular functions. They depend on release of Ca2+ from cellular stores into the cytosol, a process that appears to be tightly controlled by changes in [Ca2+] within the store. A method to image free [Ca2+] within cellular organelles was devised, which provided the first quantitative confocal images of [Ca2+] inside the sarcoplasmic reticulum (SR) of skeletal muscle. The method exploits, for greater sensitivity, the dual spectral shifts that some fluorescent dyes undergo upon binding Ca2+. It was implemented with mag-indo-1 trapped in the intracellular organelles of frog skeletal muscle and validated showing that it largely monitors [Ca2+] in a caffeine-sensitive compartment with the structure of the SR cisternae. A tentative calibration in situ demonstrated an increase in the dye's dissociation constant, not unlike that observed for other dyes in cellular environments. This increase, together with other characteristics of the ratioing method, placed the half-signal [Ca2+] near 1 mm, a value suitable for cellular stores. Demonstrated advantages of the technique include accuracy (that of a calibrated ratiometric method), dynamic range and sensitivity (from the combination of two spectral shifts), spatial and temporal resolution, and compatibility with a vast array of visible dyes to monitor diverse aspects of cellular function. SEER (shifted excitation and emission ratioing) also provides a [Ca2+]-independent measure of dye concentration in the cell. Store and mitochondrial [Ca2+] ([Ca2+]SR and [Ca2+]mito) could be measured separately using the high spatial resolution of SEER. Evolution of [Ca2+]SR was followed upon changes in cytosolic [Ca2+] ([Ca2+]cyto). At [Ca2+]cyto= 100 nm [Ca2+]mito remained near the lower limit of detection and [Ca2+]SR stabilized at values that were submillimolar according to our tentative calibration. Steady [Ca2+]SR was only slightly higher in 800 nm[Ca2+]cyto, and essentially did not decrease unless [Ca2+]cyto was reduced below 10 nm. While the increase of [Ca2+]SR was limited by loss through Ca2+ release channels, its decrease in low [Ca2+]cyto was largely dependent on leaks through the SR Ca2+ pump.
Multicellular organisms coordinate the activity of individual cells through signals that determine metabolic changes. Inside cells, signals are often transient changes in [Ca2+]. A paradigm is the increase in [Ca2+] in the cytosol of muscle cells, necessary to shift them from rest to the active state of contraction. Similar Ca2+ signals control secretion of hormones and neurotransmitters, cellular division, fertilization, and programmed cell death (Carafoli, 2002). Different cells and tissues take advantage of a ‘toolkit’ of devices for Ca2+ signalling (Berridge et al. 2003). Central to the toolkit are cellular organelles, the endoplasmic reticulum, ER, or in muscle the sarcoplasmic reticulum, SR, where the ion is stored at concentrations near 1 mm. From these organelles Ca2+ may be released into the cytosol, to shift its concentration, [Ca2+]cyto, up from the value that prevails in resting states.
The fastest of these changes take place in skeletal muscle and in nerve terminals (Brini & Carafoli, 2000). The speed of the changes is achieved through very rapid on and off gating of Ca2+ release channels, combined with a strong machinery of removal of Ca2+ from the cytosol. The joint working of the systems of release and removal appears finely tuned to provide just the necessary gradient needed for signalling contraction. An important device of control is the sensitivity of the release channels to the Ca2+ ion, which is understood to both promote and inhibit channel opening, through binding to distinct sites on the cytosolic face of the channels. Additionally, there is evidence of separate effects of SR-lumenal Ca2+, presumably acting on lumenal sites. The release-promoting role of intra-SR Ca2+ has been demonstrated especially well in cardiac muscle (Györke et al. 2002), where increases in Ca2+ load result in an increase of spark frequency and eventually self-sustaining Ca2+ waves.
In skeletal muscle, instead, the effects of intra-SR Ca2+ remain ill-defined. There is evidence of a negative effect of load, which appears to involve the cytosolic-facing inhibitory sites, exposed to elevated [Ca2+] after channel opening (see review by Pizarro & Ríos, 2004). There is also evidence of positive effects (Donoso et al. 1995), which may explain varied forms of activity that start with delay after an imposed increase in cytosolic Ca2+ (Zhou et al. 2004). Positive effects are tentatively interpreted as the result of several mechanisms (review by Fill & Copello, 2002), including activation by Ca2+ feeding through open channels (Endo et al. 1970; Tripathy & Meissner, 1996), increase in susceptibility to activation by Ca2+ due to ions acting on the lumenal SR side and loss of susceptibility to inhibition by Mg2+ (Laver et al. 2004). Clearly the separation of multiple effects and elucidation of their mechanism will require measurement of [Ca2+]SR and its controlled modification with techniques that preserve function.
A number of advances have been made recently in the determination of SR [Ca2+] in muscle and other cells. NMR of fluorine in TF-BAPTA provides an average value in beating hearts (Chen et al. 1996). Fluo-5N in the AM form was found to load predominantly into the SR and thus provide an indication of its content in intact skeletal muscle cells (Kabbara & Allen, 2001), while in cardiac myocytes its signal was imaged confocally (Shannon et al. 2003). A more robust quantification was achieved by imaging of ratiometric dyes in Ca2+ stores of cultured astrocytes and smooth muscle myocytes (Golovina & Blaustein, 1997). Still, there is no satisfactory method to directly measure [Ca2+]SR in adult skeletal muscle and no ratiometric imaging of [Ca2+] inside stores of adult cells.
We characterize here a new technique, named SEER, aimed at quantitative ratiometric imaging. It makes better use of the fluorescence of some ratiometric dyes, including indo-1 and mag-indo-1, through simultaneous shifting of excitation and emission wavelengths. The substantial increase in sensitivity so achieved makes it possible to image [Ca2+] inside organelles of functioning cells. Because it is suitable for confocal microscopy, the technique provides high spatial and millisecond temporal resolution. Additionally, it is compatible with the simultaneous use of fluorescein or rhodamine-based indicators for parallel measurements of [Ca2+] in the cytosol or other staining purposes.
This paper describes fundamentals of the method, demonstrates its dynamic range and spatial resolution on frog skeletal muscle, calibrates it in situ and makes initial use of SEER to explore the evolution of [Ca2+]SR upon changes in [Ca2+]cyto.
Fundamentals of SEER
The SEER principle is illustrated in Fig. 1, which plots the excitation and emission spectra of free (blue trace) and Ca2+-saturated mag-indo-1 (red trace). Given the large shift in emission spectra of the saturated dye, the ratio R of two fluorescence intensities excited at a suitable wavelength and collected in the ranges marked 1 or 2 (at top) will be monotonically related to [Ca2+] by the equation:
| (1) |
where KD is the dissociation constant of the dye and is the ratio of fluorescence of free over saturated dye in emission range 2 (Grynkiewicz et al. 1985).
Figure 1. The basis of SEER.

Fluorescence excitation and emission spectra of Ca2+-free (blue trace) or Ca2+-bound dye (red) determined by spectrofluorometry. Vertical violet and blue lines mark the position on excitation spectra of the argon laser lines (1, at 351 nm and 2, at 364 nm) used in SEER. Boxes 1 and 2 on the rainbow bar at top indicate the fluorescence emission ranges collected for images to be ratioed. The conventional practice would be to divide F11 (obtained with excitation 1 in emission range 1) by F12 (obtained with excitation 1 in emission range 2). By contrast, the SEER ratio is defined as F11/F22. Box 3 marks the collection range for fluorescence F33 of rhod-2, excited at 543 nm, with emission spectrum in pink. Spectral curves reproduced with modifications from http://www.probes.com/servlets/spectra?fileid=1202ca
Because both spectra change upon Ca2+ binding, the ratio of the two fluorescence intensities will change with [Ca2+] over a far greater range if both excitation and emission wavelengths are simultaneously varied. Vertical bars in the figure mark the UV spectral lines of the argon laser at 351 and 364 nm. In the following, fluorescence excited at 351 nm will be represented as F1j while that excited at 364 nm will be F2j. The index j will change according to the emission range.
Under 351 nm excitation, emission F11 (in emission range 1) undergoes an increase between Ca2+-free and Ca2+-bound dye, while under 364 nm excitation, emission F22 (in range 2) becomes lower. Therefore, the ratio R=F11/F22increases greatly upon Ca2+ saturation. As demonstrated below, this ‘dynamic range’ is always a greater number than that obtained with either the excitation or the emission change used separately.
The results are the same when a long wavelength dye like rhod-2 (emission represented by pink line in Fig. 1) is present. Its fluorescence emission in range 3 has little interference from mag-indo, hence the development of SEER can be approached with the incentive that it should be compatible with a wide variety of other monitors.
A low concentration of dye and a non-scattering environment are assumed throughout. When the dye is free of Ca2+ F11 is proportional to I1, the intensity of the exciting light, to a spectral excitation factor XD1 (representing absorption and quantum efficiency of fluorescence), to a spectral emission factor MD1 and to wavelength-independent parameters. F22 of the Ca2+-free dye is correspondingly proportional to I2, XD2 and MD2.
Accordingly
| (2) |
where eD1 and eD2 are spectral factors quantifying jointly the excitation and emission properties of the free dye. Analogously
| (3) |
where eC1 and eC2 are corresponding spectral factors for the Ca2+-bound dye.
From eqns (2) and (3) the dynamic range (Rmax/Rmin) can be calculated:
| (4) |
The following, instead, are expressions for the dynamic range when only emission or excitation are shifted:
| (5) |
| (6) |
Multiplying eqns (5) and (6) and substituting eqns (2) and (3) it is found that
| (7) |
In other words, the dynamic range of SEER is equal to the product of the separate dynamic ranges of the excitation and emission spectral shifts. Whenever a shift exists, the wavelengths can be chosen so that the associated dynamic range is greater than 1. Therefore, the SEER dynamic range, which is their product, will be greater than either single-shift range (as confirmed in calibrations below). In Appendix I it is demonstrated that sensitivity, defined as the change in signal per unit change in [Ca2+], is proportional to the dynamic spread Rmax−Rmin (eqn (A3)), while logarithmic sensitivity is proportional to dynamic range (eqn (A5)).
Equations (4)–(6) can be used to verify that the dynamic range is the same for both possible definitions of the ratio between two fluorescence intensities (R and its inverse). Appendix I shows that the signal-to-noise ratio is also unaffected by this choice (eqn (A10)).
Calibration in aqueous solution
The curves in Fig. 1 are cuvette spectra provided by the supplier of the dye. (The emission spectra are corrected for detector efficiency and the excitation spectra are corrected to equivalent excitation energy and scaled to same peak.) They are included to illustrate the principle. The changes in ratio realized in the actual confocal microscopy setup, with multiple components that absorb UV and scatter visible light, are lower than those predicted from the ideal cuvette spectra. Figure 2A shows spectra determined in our microscope, with experimental aqueous solutions and chambers. Each point corresponds to emission in successive 10 nm-wide wavelength bands, recorded in solutions with 25 μm mag-indo-1, either free (open symbols), or saturated with Ca2+, excited at 351 (black) or 364 nm (red). Other measurements, not shown, indicated that the spectra at intermediate Ca2+ concentrations can be described as linear combinations of the spectra shown in Fig. 2A.
Figure 2. Spectra and calibration in solution.

A, emission spectra measured with the experimental laser scanning microscope, aqueous solutions and chambers. Each point corresponds to emission in successive 10 nm-wide wavelength bands, recorded in solutions with 25 μm mag-indo-1, either free (open symbols), or saturated with Ca2+, excited at 351 nm (black) or 364 nm (red). B, data for 351 nm excitation on an expanded wavelength scale, showing an isosbestic point at 425 nm. The ranges represented by boxes 1 and 2 in the diagram at top represent the ranges used for measurements in cells, which did not agree in detail with the optimal ranges in solution. C, titration of the dye by Ca2+. Blue symbols: conventional emission ratios, namely ratios of fluorescence F11 (excited at 351 nm in the 10 nm emission range centred at 408 nm) and fluorescence F12 (excited at 351 nm in the 10 nm emission range centred at 492 nm). Green symbols: SEER ratioing, namely fluorescence F11 divided by F22, which is excited at 364 nm in the emission range centred at 492 nm. Dashed curves: best fits by eqn (8), with free parameters Rmax/Rmin (the asymptotic value) and KD, the mid-signal concentration. Note that both parameters are more than 3 times greater with SEER.
These spectra were used as guides to define two ranges for collection of emitted light, in order to maximize changes in R (=F11/F22) when going from the Ca2+ free (open) to the Ca2+-saturated situation (ranges 1 and 2 in Figs 1 and 2).
Placing the emission range 1 as shown is justified with Fig. 2B, which expands the low wavelength range for the 351 nm excitation data and shows an isosbestic (crossing) point at 425 nm. The increase in fluorescence with Ca2+ binding that occurs at wavelengths shorter than 425 nm contributes significantly to the change in ratio. While the observation suggests limiting range 1 at 425 nm, on cells the dynamic range of the signal increased further if range 1 extended to 440 nm, which probably reflects a red shift in spectra upon interaction of the dye with cellular components.
Figure 2C plots a titration of the dye by Ca2+, done to compare the [Ca2+]-dependence of ratios obtained by conventional and SEER ratioing. The blue symbols represent values obtained by conventional emission ratioing, namely ratios of fluorescence F11 elicited by excitation 1 (351 nm) in emission range 1 (which for this titration only is defined as the 10 nm range centred at 408 nm), and fluorescence F12, elicited by excitation 1 in emission range 2 (the 10 nm range centred at 492 nm). Green symbols represent SEER ratioing, namely fluorescence F11 divided by F22, which is elicited by excitation 2 (364 nm) in emission range 2. The dashed curves represent best fits by the function R ([Ca2+]) derived from eqn (1), namely
| (8) |
with free parameters Rmax/Rmin and γKD.
The plots illustrate two significant differences between conventional and SEER ratioing. The dynamic range Rmax/Rmin is substantially greater with SEER (241 versus 68). Dynamic range is not so high in situ. To minimize noise (Appendix I) the emission ranges 1 and 2 must be made greater. This, plus background fluorescence that cannot be fully subtracted, degrades the dynamic range to a value of 12.4.
An additional, serendipitous difference between SEER and conventional ratioing is in the parameter γ, which in SEER is the ratio of F22 of free and Ca2+-bound dye, while in conventional ratioing it is the ratio of corresponding F12 values. For mag-indo-1, γ is 3-fold greater in SEER than conventional ratioing. Consequently the fitted parameter γKD is approximately 3-fold greater for SEER (the fitted values are 0.242 mmversus 0.067 mm). γKD is equal to the half-signal [Ca2+] (eqn (1)). The combined effect of the increase in γ and an increase in KD inside cells (shown below) is therefore to set the midpoint of the method at nearly 1 mm, a value that appears ideal for monitoring [Ca2+]SR.
Methods
We used SEER to measure [Ca2+] inside organelles of frog muscle. Grass frogs (Rana pipiens) were killed by double pithing under deep anaesthesia (by immersion in water with 15% ethanol, or MS222 at 3 g l−1), a procedure approved by the Institutional Animal Use and Care Committee of Rush University. Semitendinosus muscles from both legs were then loaded for 120 min at 18°C in a Ringer solution with 10 μm mag-indo-1 AM (or indo-1 AM in some calibration experiments). Singly dissected cells were then mounted in the microscope stage and membrane-permeabilized with saponin in a ‘relaxing’ solution with no ATP, 1 mm EGTA and no added Ca2+. After permeabilization the cell was immersed in a ‘loading’ solution with variable [Ca2+].
Solutions
Experiments were carried out at 20°C. The ‘loading’ internal solution contained (mm): caesium glutamate (70.6), Na2ATP (5), Na2PC (10.29), EGTA (1), glucose (5), Hepes (10), rhod-2 (100 μm), CaCl2 (0.186) and MgCl2 (5.34) for a nominal [Ca2+] of 100 nm, and [Mg2+] of 0.5 mm. CaCl2 and MgCl2 were modified as needed to obtain [Ca2+] of 400 or 800 nm and [Mg2+] of 0.4 mm (detailed in Zhou et al. 2004). Two types of solution were used to promote flux across the SR membrane: a ‘release cocktail’ consisted of the components of the loading solution plus the RyR channel opener caffeine (5 mm) and a free Mg2+ concentration reduced to 10 μm. Its goal was to produce reversible Ca2+ release through ryanodine receptors; the combination was used based on the observation that in rat muscle it is more effective than either stimulus used separately (Fryer & Stephenson, 1996). An ‘SR sieving’ solution, used in calibrations, was devised to produce irreversible permeabilization of the membrane and inhibition of the pump. It had the components of the release cocktail plus 3 μm thapsigargin, 5 μm A23187, 0.4 mm Mg2+ and varying [Ca2+]cyto, buffered by 1 mm EGTA at submicromolar [Ca2+] or 15 mm NTA at submillimolar [Ca2+]. BTS (Cheung et al. 2002) was present at 50 μm in all solutions to reduce contraction. After addition of Ca2+ pH was set to 7.0 with CsOH and osmolality to 260 mosmol kg−1 with caesium glutamate. [Ca2+] in the solutions was checked using SEER of indo-1 in the experimental setup (see description below). The composition of Ringer and relaxing solutions used in the preparation stages is published (Shirokova et al. 1996).
Microscopy and image processing
SEER required the simultaneous acquisition of two confocal images, produced by alternating line by line (‘line-interleaving’) two excitation lights (351 and 364 nm) and two fluorescence emission ranges (390–440 nm and 465–535 nm, labelled 1 and 2 in Fig. 1). This was done with the Leica TCS SP2 confocal system (Leica Microsystems, Exton, PA, USA), which defines detection bands spectrally and switches excitation via acousto-optical tunable filters and beam splitters. The water immersion objective had magnification of 40 × and numerical aperture 1.2. Its point spread function (PSF) determined with 0.1 μm fluorescent spheres (Molecular Probes, Eugene, OR, USA) could be approximately described as a product of gaussians of σxy= 0.45 μm and σz= 1.55 μm. In dual-staining experiments rhod-2 or Mitotracker-green was present in the cytosolic solution. In these cases a third image was interleaved, excited at another wavelength (488 nm for Mitotracker green or 543 nm for rhod-2) and acquired in a suitable emission range (3 in Fig. 1 was used for rhod-2). xy scans were of 512 × 512 pixels at distances varied from 0.23 to 0.11 μm. At the fastest rate, three images could be acquired every 1.6 s. Ratios R (≡ F11/F22) were calculated after low-pass digital filtering of fluorescence images at 0.33 of the Nyquist frequency (typically 1.25 μm−1) by convolution with a 25 × 25 point Kaiser kernel (Hamming, 1998).
Deblurring and volume rendering
Twenty three xy scans were acquired at 0.13 μm pixel distance and 0.16 μm vertical intervals and deblurred by constrained iterative deconvolution (Agard et al. 1989; van der Voort & Strasters, 1995) with a PSF determined in our microscope. The deblurred set was rendered using the ‘Simulated Fluorescence Process’ algorithm (Messerli et al. 1993.)
Simulations
The evolution of [Ca2+] was calculated for a compartment, ‘SR’, with a volume of 0.1 (relative to that of the cell) and a Ca2+ buffering power ([bound Ca2+]/[free Ca2+]) of 40, where a pump sequestered Ca2+. The SR faced a ‘cytosol’ where [Ca2+] was set at a constant value and changed in steps. The reaction scheme and rate constants for the pump were as in Fernández-Belda et al. (1984). They were corrected for the difference in temperature assuming a Q10 of 3. The SR had a leak, proportional to free [Ca2+]SR, with rate constant = 0.02 s−1 at 25°C (4-fold greater than that determined by Macdonald & Stephenson, 2001 for rat skeletal muscle). [ATP] was set at 5 or 0.001 mm in different cases. [ADP] and [Pi] were set at values adequate for frog muscle at rest, 10 μm and 1 mm (Dawson et al. 1978). Changes in [Ca2+]SR upon a step in [Ca2+]cyto were calculated numerically, starting from values for [Ca2+]SR and concentrations of pump species reached after calculations at the prior [Ca2+]cyto had reached steady state.
Results
This section includes a validation, demonstrating that the method images preferentially the SR, an exploration of its spatial resolution, an in situ calibration and a study of the evolution of [Ca2+]SR in the presence of varying [Ca2+]cyto.
SEER monitors Ca2+ in a caffeine-sensitive store
In Fig. 3 are confocal xy scans from a membrane-permeabilized frog muscle fibre with mag-indo-1 trapped inside organelles. Figure 3A and B are images F11 and F22 after 30 min in loading solution (with 100 nm Ca2+). These images are essentially simultaneous, obtained by alternating excitation wavelengths and emission recording ranges line by line during the xy scan. In this well-loaded fibre F11, which should have high intensity in regions of high [Ca2+], features fluorescence in structures orientated transversally to the fibre axis. F22 has instead high intensity in longitudinally orientated structures. The ratio image, in Fig. 3C, has high pixel values – indicating high [Ca2+] – in the transversal structures and low value in the longitudinal organelles. Figure 3D and E are the corresponding images after exposure to a ‘release cocktail’, similar to the loading solution but with 5 mm caffeine and 0.01 mm Mg2+. The F11 image became dim, while the transversally orientated organelle became bright in F22. The ratio, shown in Fig. 3F, was consequently very low everywhere. The combination of caffeine and low Mg2+ was shown to essentially empty the SR in mammalian muscle (Fryer & Stephenson, 1996). The present response to caffeine and low [Mg2+] therefore indicates that the dye is largely inside the SR.
Figure 3. Validation of SEER.

A and B, individual images F11(x,y) and F22(x,y) from a mag-indo-1-stained cell after 30 min in the ‘loading’ solution. C, ratio of A and B. D and E, corresponding images, and F, their ratio, after 2 min in release cocktail. The spatial aspects reverse upon depletion, with transversal structures of high fluorescence in F11 (A) losing their fluorescence after depletion, but gaining high fluorescence in F22 (E). Boxed areas in A–C are reproduced in Fig. 5 for further analysis. Identifiers: 120903b 445 and 451.
Tests of the location of the dye, which also illustrate the spatial resolution of the technique, are illustrated in Fig. 4. Panels A and B are averages of four F11 and F22 images, respectively, acquired at high magnification in the cell after depletion by caffeine. Both averages show high intensity in the transversal structures, which at this resolution appear as doublets of elongated sacs. Presumably these are SR terminal cisternae. To further test this hypothesis a ‘z-series’ of F22 images was obtained in the depleted cell and subjected to deblurring with a point spread function determined with 0.1 μm fluorescent spheres in the same setup. Figure 4C is a volume rendering of the deblurred series. Figure 4D is an electron micrograph of a thin section of guppy muscle (reproduced from Franzini-Armstrong, 1999). The micrograph is superimposed in Figure 4C at the appropriate scale to show correspondence between the stained structure and SR terminal cisternae. In conclusion, the source of the measured fluorescence is dye trapped largely in terminal cisternae of the SR. The same conclusion was reached examining simultaneous images of trapped rhod-5N in sealed t tubules (e.g. Launikonis & Stephenson, 2004) and SEER, obtained in the course of work in progress using mechanically skinned fibres.
Figure 4. Spatial resolution of SEER imaging with mag-indo-1.

A and B, averages of four images F11 and F22 at high spatial resolution in a cell with empty store. The sacs are transversal to the fibre axis. C, 3-D rendering of a stack of 15 F22xy scans in same cell, deblurred to improve resolution (see Methods). The transversal structure of high staining is rendered as sacs in doublets. D, electron micrograph of thin section of guppy muscle, superimposed in C at the appropriate scale to show correspondence between the stained structure and SR terminal cisternae. Identifier: 072004a 98. Image D (from Franzini-Armstrong, 1999) was kindly provided by C. Franzini-Armstrong.
The ratiometric determination of [Ca2+]
The use of ratio images to derive [Ca2+] is illustrated in Fig. 5. Panels A–C are the boxed portions of the corresponding panels in Fig. 3, shown magnified. The ratio image, in Fig. 3C, is found to be heterogeneous. In principle, R should be linked to the monitored [Ca2+] by eqn (1) but the dye stains organelles that occupy a small fraction of the scanned volume, of dimensions below the vertical resolution of confocal microscopy. Therefore background light and superposition of other organelles may contribute to the measured fluorescence and the observed inhomogeneity in R.
Figure 5. The distribution of dye in a stained cell.

A–C, images F11(x,y), F22(x,y) and their ratio R, from a cell with loaded store (same as boxed portions of panels A–C in Fig. 3). D, dye concentration DT (x,y), derived by linear combination of F11 and F22 (eqn (A12)). E, all-pixel histogram of DT (x,y), which is distributed uni-modally around ∼20 μm. F, the histograms of R in regions with different DT. Each curve corresponds to areas (x,y) where DT is in each of the four quartiles of the distribution depicted in E. As DT increases, R adopts slightly greater values. G, ratio, in same colour scale as in C, but restricted to the well-stained regions (upper quartile). H, [Ca2+] derived from G by eqn (1), showing the characteristic doublet structure of SR terminal cisternae. Horizontal bar in magnified area is 2 μm. Colour tables span the range 0–255 for A and B, 0–3.5 for C and E; 0–40 μm for D; 0–700 μm for F. Identifier: 120903b 445.
An approach that reduces artifactual heterogeneity is illustrated in Fig. 5D–F. As demonstrated in Appendix II, a linear combination of F11 and F22 exists that measures total dye concentration DT independently of [Ca2+] (eqn (A12)). Figure 5D is the image DT (x, y), calculated pixel by pixel with eqn (A12). The all-pixels histogram of image Fig. 5D is displayed in Fig. 5E, showing an irregular distribution of dye. Based on this histogram, the image was divided into four regions of different staining, identified as pixels (xi, yj) with DT values in each quartile of the distribution. The histograms of values R (xi, yj) in such four regions are plotted in different colours in Fig. 5F. They are not identical, shifting instead monotonically by about 0.1 units to greater R in the successive quartiles of DT.
The observation indicates that even ratiometric measurements will suffer from some dye concentration dependence when implemented in small organelles. This error, which in our experience may reach up to 12% of the maximum signal, was reduced by two manoeuvers. One was to perform calibrations in situ. These measure the response to known [Ca2+] of dye trapped inside cells, and should therefore be affected by the same bias of actual experiments. The other – which may be called dye-restricted masking – was to use the measure DT (x, y) to define regions of high staining and gather more robust estimates of [Ca2+] from those regions.
The image R (xi, yj) restricted to the top quartile of DT (x, y) is in Fig. 5G. From these values, the local [Ca2+] in each pixel was calculated using eqn (1). The result, magnified in Fig. 5H, reveals again a pattern of thin sacs, SR cisternae. Thus, the high spatial resolution demonstrated in Fig. 4 with individual images persists in the ratio images upon dye-restricted masking. Given that the SR is the dominant stained structure, the Ca2+ concentration monitored in the well-stained pixels is largely [Ca2+]SR.
Calibrations in situ
The derivation of [Ca2+] from R requires knowledge of four parameters (eqn (1)). To determine their value in situ, in the environment of the SR, experiments were carried out, measuring R at various known [Ca2+]SR. Cells loaded with mag-indo and permeabilized by saponin were exposed to an SR-sieving solution with varying [Ca2+]cyto (devised to produce irreversible permeabilization of the membrane and inhibition of the pump, so as to force the intra-SR [Ca2+] to equilibrate with that of the solution in the cytosol; its composition is given in Methods). The top panels of Fig. 6 show results in 1 of 10 experiments. Panels A and B are F11 and F22 images of the cell after SR permeabilization and exposure to a nominally Ca2+-free solution. Figure 6C shows the image of dye concentration derived from images in Fig. 6A and B (eqn (A12)). Figure 6D displays the ratio image, restricted to areas in the upper two quartiles of DT (the other regions are set to grey). Figure 6I shows in blue circles the histogram of ratio values in this restricted region. The mean of the best-fit gaussian (named RSR) was 0.406 in this case, probably very close to the value of Rmin.
Figure 6. Calibrations in situ.

A and B, F11(x,y) and F22(x,y) images, respectively, from a cell with permeabilized SR exposed to a nominally Ca2+-free solution. C, DT(x,y), derived from A and B by eqn (A12). D, R=F11/F22, masked to areas in the two upper quartiles of the distribution of DT (‘dye-restricted masking’). Identifier: 031605c_008. E and F, images F11 and F22, respectively, from a cell with intact SR, exposed to an internal solution with 30 μm[Ca2+] and 0.5 mm tetracaine. G, DT(x,y), derived from E and F. H, ratio image, from E and F, masked to the two top quartiles of the distribution of DT. Identifier: 031505c_014. Colour tables span the range 0–255 for A, B, E and F; 0–50 μm for C and G; 0–4.25 for D and H. I, histograms of the ratio images D (blue) and H (red), with gaussian fits (lines) of means 0.406 and 5.080. J, histogram of the ratio image from a fibre stained with indo-1 and treated as described for E–H. Gaussian fit (line) has mean of 4.98. Identifier: 31805a_024.
SR-permeabilized fibres were exposed to [Ca2+]cyto ranging from 0 to 2000 μm. Figure 7A illustrates the evolution of RSR in one experiment, demonstrating reproducibility in the reading at 100 μm[Ca2+]cyto after a passage through a greater concentration. Such reproducibility, considered essential to rely on the measured RSR, was consistently found up to and including 300 μm[Ca2+]cyto. Application of higher [Ca2+]cyto resulted in rapid loss of signal and underestimates of R. Hence, a different approach was taken to evaluate Rmax. Fibres with intact SR were exposed to a [Ca2+]cyto of 30 μm (to force Ca2+ uptake by SERCA) and 0.5 mm tetracaine (to prevent loss through Ca2+ release channels). Panels E and F in Fig. 6 are F11 and F22 images in a fibre loaded this way. Figure 6G is the image of dye concentration and Fig. 6H the corresponding ratio, again restricted to the upper two quartiles of DT. The histogram of ratio values is in red in panel I. The mean was 5.08 in this case.
Figure 7. Calibrations in situ.

A, evolution of mean ratio (RSR) in a fibre with permeabilized SR exposed to different [Ca2+]cyto as depicted in top diagram. Identifier: 031605b. B, summary results. Each symbol represents the average of RSR in all images at the same [Ca2+]cyto in the same experiment. Different types of symbols represent different fibres (n = 10). Continuous curve: best fit with eqn (1). The point at 0.7 mm[Ca2+] (diamond) is an average of values that decayed during the experiment and was not included in the fit. Best fit parameters: Rmin= 0.410, γKD= 802 μm. Rmax was set to 5.08. Curves in dashed trace follow eqn (1) with the same Rmin and Rmax, and γKD= 536 or 1068 μm.
While no greater values were obtained for the mean ratio in three fibres loaded this way, RSR seldom reached a value of 5, suggesting that a normally functioning SR, even with release blocked and Ca2+ uptake stimulated maximally, can hardly reach lumenal concentrations that saturate mag-indo-1. To evaluate Rmax more reproducibly we took advantage of the near-identical spectral properties of mag-indo-1 and indo-1. The expectation was that indo-1, with a nominally 100-fold greater affinity for Ca2+, would be easily saturable inside the SR. Indeed, in three cells pre-exposed to indo-1 the same loading by high [Ca2+]cyto and tetracaine consistently resulted in Rmax close to 5. A representative ratio histogram, with gaussian mean of 4.98 is in Fig. 6J.
RSR data obtained with [Ca2+]cyto up to 300 μm in 10 cells are plotted in Fig. 7B. The curve is the best fit with eqn (1), constrained to have Rmax= 5.08. The best fit parameters were Rmin= 0.41 and γKD= 802 μm. γ, determined as the average ratio of F22 in nominally zero [Ca2+]cyto over that in cells maximally loaded, was 4.69. Therefore KD was 171 μm.
The lack of data at intermediate values of R reduces the reliability of this calibration. The uncertainty is represented with two additional curves (dashed) traced with eqn (1) and γKD= 802 μm+ 2 × SEF, where SEF is the standard error of the fitted value, 133 μm. These curves can be used as a confidence interval. For example, when R= 2.74 (the ‘half ratio’) [Ca2+]SR is likely to be between 536 and 1068 μm.
The data points included in the fit may have been affected to some extent by the same error that led us to discard data at higher [Ca2+]cyto. Such systematic errors would not be correctly reflected in the confidence interval described above, which therefore may underestimate the uncertainty in this measurement.
SEER also measures [Ca2+] in mitochondria
On further examination of images in Fig. 5G and H some inhomogeneity can be seen in organellar [Ca2+] even in the well-stained regions. The inhomogeneity consists of elongated areas of lower [Ca2+] parallel to the fibre axis, which are similar to mitochondria identified in earlier studies (Lännergren et al. 1999). The identity of the elongated structures was confirmed in double staining experiments, illustrated in Fig. 8. Panel A is the SEER ratio image and B the image of fluorescence excited at 543 nm and collected in range 3 of Fig. 1 in a cell stained with mag-indo-1 and rhod-2, a cationic dye which preferentially enters mitochondria driven by their potential difference ΔΨm (reviewed by Duchen, 2000). Figure 8C and D are SEER and green fluorescence images from a cell exposed for 10 min to Mitotracker green, a dye that partitions preferentially into the mitochodrial matrix (Keij et al. 2000). In both cases there is detailed correspondence between the elongated structures of low [Ca2+] according to SEER and mitochondria identified by the specific stains.
Figure 8. SEER resolves mitochondria.

A, ratio image of a cell loaded with mag-indo-1 and rhod-2, then membrane-permeabilized and immersed in a 100 nm [Ca2+] solution. (Image is masked to the three upper quartiles of DT.) B, simultaneously acquired image of rhod-2 fluorescence. Note detailed correspondence between low [Ca2+] regions in A and rhod-2 stained mitochondria in B, but greater heterogeneity in mitochodrial staining by rhod-2. Identifier: 022504a_11. C, ratio image of a cell loaded with mag-indo-1, membrane-permeabilized and exposed to a cytosolic solution with 100 nm[Ca2+] and Mitrotracker green. D, simultaneously acquired image of Mitotracker fluorescence. Again, there is detailed correspondence between mitochondrial staining by Mitotracker and regions of low [Ca2+] in C. Identifier:092403b_9. Colour table spans the range 0–3.5 for A and C; 0–255 for B and D.
These pairs of simultaneous images illustrate three other observations. First, the intensity of rhod-2 fluorescence in individual mitochondria is not well correlated with the intramitochondrial [Ca2+] reported by SEER. Even though rhod-2 is deemed to be a monitor of mitochondrial [Ca2+], the present observations highlight its problems. Because rhod-2 is not ratiometric, its fluorescence is also dependent on local concentration (which depends on ΔΨm and other variables) and volume of the organelle. Second, the value of [Ca2+]mito is variable but consistently lower than [Ca2+]SR. Finally, whenever images were obtained in grazing cuts, within a few microns from the fibre surface, mitochondria were found at higher density. As reported before (Smith & Ovalle, 1973) and illustrated further in the next figure, superficial regions are richer in mitochondria.
[Ca2+]SR and [Ca2+]mito evolve differently
The determination of [Ca2+]SR, based on the analysis of histograms of the ratio images, was trivial in most cases, when mitochondria were not abundant but [Ca2+]SR could still be evaluated in images where mitochondria occupied a major area. Figure 9 illustrates early stages in a typical experiment, in images with abundant mitochondria. Experiments were always started by permeabilizing the cell in relaxing solution, devoid of ATP and nominally [Ca2+]-free. Then cells were exposed to a cytosolic solution with 5 mm ATP and variable [Ca2+]. The ratio image in Fig. 9A(masked to regions in the upper half of the distribution of DT) was obtained after 30 s in 100 nm[Ca2+]. Figure 9B was obtained later, from a different region of the cell, after 60 s in 400 nm[Ca2+]. (Figure 9C, at a lower magnification, suggests that the mitochondria-rich region visible in B constitutes a cuff that fully surrounds the fibre.)
Figure 9. SR loading at elevated [Ca2+]cyto.

A, ratio image after 30 s loading in 100 nm[Ca2+]cyto. Image masked to two upper quartiles of DT. Note mitochondria in superficial region. B, image in different region of same cell, after 60 s in 400 nm[Ca2+]cyto. C, image obtained immediately after B, at lower magnification, to show ‘cuff’ of mitochondria. D and E, histograms of ratio in images A and B. Lines, best fits by sum of two gaussian terms of means Rm and RSR. Mean values were: for A, Rm= 1.20, RSR= 2.02; for B, Rm= 1.12, RSR= 2.64. Identifiers: 051904a_14, 26 and 27.
The histograms of Fig. 9A and B are plotted in D and E. When mitochondria were scarce (as in Figs 5 and 6) a single gaussian described the histogram well. Otherwise the histograms were close to the sum of two gaussians, with weights reflecting the relative size of the areas in the image occupied by either organelle. The curves in red represent best fits by the sum of a low ratio gaussian of mean Rm, and another of mean RSR. In general the component of greatest weight was that of highest mean (RSR), so named because it always corresponded to the SR areas of the image.
The example illustrates a consistent observation: when [Ca2+]cyto was increased within the range 100–800 nm, the SR increased its [Ca2+] much more effectively than mitochondria, and the separation of Rm and RSR values became more obvious (the concentration values corresponding to Rm and RSR in Fig. 9E are, respectively, 144 and 733 μm). The separation of ratios by this fitting technique (restricted, as explained, to areas of good staining) appeared to yield always a satisfactory measure (RSR) of ratio in the SR. When the mitochondrial term was large, Rm was an equally good measure of ratio within mitochondria. The description that follows is limited to the evolution of [Ca2+]SR, as estimated by RSR. An equally detailed description of [Ca2+]mito is possible, through selective imaging of superficial regions rich in mitochondria.
The relationship between [Ca2+]SR and [Ca2+]cyto
Figure 10 plots the evolution of RSR in a fibre first taken to 400 nm[Ca2+]cyto and then to lower concentrations, as indicated. The evolution is representative of two consistent observations. Upon an increase in [Ca2+]cyto, [Ca2+]SR increased and stabilized after several minutes. Afterwards, a return to lower [Ca2+]cyto did not result in substantial decay of [Ca2+]SR. In this and most experiments, reduction in [Ca2+]cyto resulted in a fast decay in [Ca2+]SR only upon returning to EGTA-containing solutions of very low [Ca2+], with or without ATP.
Figure 10. Evolution of [Ca2+]SR upon changes in [Ca2+]cyto.

Time course of mean ratio RSR in successive images, while [Ca2+]cyto was changed as depicted at top. Intervals labelled ‘0’ were spent in relaxing solution. [Ca2+]SR on right axis calculated from ratio values according to eqn (1) with parameters listed in legend of Fig. 7. Note very slow decay of [Ca2+]SR upon change to 100 nm[Ca2+]cyto, and rapid decay in relaxing solution. Identifier: 071504a.
Figure 11 summarizes the results of multiple experiments. Panel A depicts the average evolution of RSR and [Ca2+]SR upon a step increase in [Ca2+]cyto. Average RSR and standard deviation are plotted in black for a step to 100 nm[Ca2+]cyto and in red for a step to 800 nm (number of experiments is given in parentheses). In 100 nm[Ca2+]cyto, [Ca2+]SR rose exponentially to 508 μm with a time constant of 6.7 min. In 800 nm [Ca2+]cyto, it tended to 668 μm with a time constant of 5.9 min. The difference in asymptotes was significant but that in rates of rise was not. For a step to 400 nm [Ca2+]cyto, the results were intermediate (n = 5).
Figure 11. Summary of the evolution of [Ca2+]SR.

A, mean ratio RSR measured at set times after the change from relaxing solution (less than 10 nm[Ca2]cyto) to 100 nm (black) or 800 nm (red), averaged over all comparable experiments (numbers in parentheses). Bars are s.e.m.[Ca2+]SR scaled calculated as described for Fig. 10. Dashed lines: exponential fits, with parameters given in the text. B, evolution of RSR after reducing [Ca2+]cyto as shown at top. Values from different experiments were averaged as described for A. Note that the changes from high [Ca2+]cyto (green and red) were to a 100 nm [Ca2+] solution, and led to a very slow reduction in [Ca2+]SR. The descent from 100 nm [Ca2+] (black) was to nominally Ca2+-free solution and resulted in faster decay of [Ca2+]SR. C, green symbols, evolution of [Ca2+]SR upon increase to 800 nm[Ca2+]cyto in the presence of 0.5 mm tetracaine. Ratio images obtained at intervals of 5 s. The asymptotic value of the exponential fit (dashed line), 3.76, corresponds to a 3-fold greater [Ca2+]SR than in the absence of tetracaine in 100 nm Ca2+ (black) or 800 nm Ca2+ (Panel B). Identifier: 031505a_s12.
Figure 11B shows average readings upon a drop of [Ca2+]cyto after the cells had essentially equilibrated at the higher concentration. Upon reduction from 800 nm (red) or 400 nm (green), [Ca2+]SR remained nearly constant over the time explored. By contrast, [Ca2+]SR decayed rapidly when returning from 100 nm to the nominally Ca2+-free relaxing solution (black).
The final experiments provide some information on the pathways that underlie the changes in [Ca2+]SR upon manipulation of [Ca2+]cyto. They also illustrate uses of SEER at a greater temporal resolution.
As argued in the Discussion, the level of [Ca2+]SR reached in the steady state, 0.5–0.7 mm, is much lower than that corresponding to thermodynamic equilibrium of the SERCA pump. ‘Leak’ through Ca2+ release channels and ‘pump slippage’ (Inesi & de Meis, 1989; Macdonald & Stephenson, 2001) are usually invoked as main causes of this deficit. To ascertain the role of Ca2+ release channels, the evolution of [Ca2+]SR was followed in high tetracaine (0.5 mm, a concentration 5-fold greater than that causing half-inhibition of Ca2+ release in SR vesicles; Xu et al. 1993). Figure 11C illustrates the evolution in one experiment upon changing from relaxing solution to 800 nm[Ca2+]cyto. R rose approximately exponentially to an asymptote corresponding to 1.97 mm Ca2+, with a time constant of 6.1 min. This level was much greater than any found in the absence of tetracaine (and nearly three times greater than the average), which indicates that leak through release channels was an important determinant of the steady [Ca2+]SR. We do not know if the level of RyR channel activity revealed by these experiments is normal, or if it reflects an increased leak due to altered control upon permeabilization of the plasmalemma.
The pathway through which SR Ca2+ is lost upon exposure to relaxing solution was explored in the experiment illustrated in Fig. 12. As represented in the top panel, a cell first equilibrated in 100 nm[Ca2+]cyto was exposed to relaxing solution. The average [Ca2+]SR dropped rapidly. After the SR was reloaded by exposure to 100 nm[Ca2+]cyto, TBQ (an inhibitor that prevents SERCA cycling; Nakamura et al. 1992) was introduced in the solution. The cell was then refocused and again exposed to relaxing solution (containing TBQ). As shown, this solution was ineffective in reducing [Ca2+]SR. The same result was obtained in two fibres treated this way. The experiment shows that the efflux of Ca2+ in relaxing solution occurs via the pump, either by its reversal (de Meis, 1988) or its slippage (Inesi & de Meis, 1989).
Figure 12. SR leak pathways include the pump.

A, evolution of RSR (blue), [Ca2+]SR (scale at right) and DT (grey) upon changing the cytosolic solution from 100 nm to one nominally Ca2+-free. Upon the first change, [Ca2+]SR fell rapidly. A second change, after exposing the cell to TBQ, failed to induce decay of [Ca2+]SR. Sets of images obtained every 1.6 s. B–E, images DT(x,y) at times b–e (calculated by eqn (A12)) showing the bleaching effects of repeated imaging at high frequency. Identifier: 031105b, series 14 and 19.
The experiment also illustrates the ability of the technique to follow rapid changes in organellar [Ca2+]. In this case, pairs of F11 and F22 images were obtained repeatedly every 1.6 s. Figure 12B–E shows images of dye concentration at times b–e during the sequence. The average DT in every image is plotted by grey symbols in A. It is clear that the method gave consistent results even though the effective DT was reduced substantially through bleaching. (The apparent recovery of DT is due to the fact that a different region of the cell was imaged in the second phase of the experiment.)
Discussion
The present results constitute the first direct measurements of free [Ca2+] inside the SR of skeletal muscle fibres using confocal microscopy. They demonstrate the ability of SEER to measure [Ca2+] inside organelles of membrane-permeabilized cells, and give direct insights into the evolution of [Ca2+]SR upon extrinsically imposed changes in cytosolic [Ca2+].
A comparison with other methods
Low affinity Ca2+ indicators have been used to monitor [Ca2+] inside the SR or ER in many cell types (Meldolesi & Pozzan, 1998; Demaurex & Frieden, 2003). For muscle, whole-cell signals of fluorescein-based dyes in the SR were obtained by Kabbara & Allen (2001) and Shmigol et al. (2001), respectively, in intact cells of skeletal and smooth muscle (combined in the latter case with ratiometric monitoring of cytosolic [Ca2+]). Later Shannon et al. (2003) imaged confocally the fluorescence of fluo-5N in cardiac myocytes. These studies found problems inherent to single wavelength (non-ratiometric) dyes, including difficulty in quantitatively evaluating the SR component of the signal, and the need to perform calibrations in every cell. The first application of ratiometric dyes for spatially resolved measurements inside Ca2+ stores was by Golovina & Blaustein (1997), who used fura-2 and mag-fura-2 on cortical astrocytes and arterial myocytes. Because the technique is unsuitable for confocal microscopy, it has been limited in its application to small cells and cellular processes. Genetically encodable monitors including aequorin (Montero et al. 1995), cameleon (Miyawaki et al. 1997), camgaroo (Baird et al. 1999) and ratiometric pericam (Nagai et al. 2001) have added great specificity to measurements of store [Ca2+], but difficulties of gene transfer have hampered their application to adult cells (see Rudolf et al. 2004 for a recent advance).
SEER was designed to combine the advantages and overcome some limitations of these predecessors. Thus it uses a ratiometric dye, which allows for a calibrated measurement that is largely independent of dye concentration and geometry of its distribution. The approach is especially suited to confocal imaging, which endows it with high spatial and temporal resolution. By employing a dye that operates at low wavelengths, it is compatible with simultaneous monitoring of cytosolic [Ca2+] or other cell properties using visible light fluorescent monitors.
The crucial advance of the new technique is the exploitation of both spectral shifts of the dye upon binding Ca2+. The dynamic range, DR, of the signal thus obtained is the product of the DRs of the individual shifts in excitation and emission (eqn (7)). This results in enhanced sensitivity (eqns (A3) and (A5)) and a large signal, even from organelles that comprise a small fraction of the cell volume. The DR of the SEER signal, defined as the quotient Rmax/Rmin, is 12.4 for mag-indo-1 in situ. By comparison, the same ratiometric dye used under pure emission shifting would yield a DR of 3. Hence SEER of mag-indo-1 improves DR by a factor of 4 over conventional ratioing.
An excitation shifting dye like fura-2, used with the sources available for confocal microscopy (laser lines at 351 and 364 nm), yields a DR of ∼2.5. Not surprisingly, we only know of one confocal microscopy study using fura-2 (Novak et al. 2002). Single wavelength dyes like fluo-5N provide much greater values of DR (defined as Fmax/Fmin) in cuvette calibrations. However, when trapped in skeletal muscle cells the DR of fluo dyes is much lower. For example in single-wavelength measurements in skeletal muscle (Kabbara & Allen, 2001) DR was between 3 and 4. Similar bounds were found in cardiac myocytes (Shannon et al. 2003) and were attributed to interference by dye trapped in non-SR compartments. The DR of SEER is also much greater than that of genetically encodable monitors. Thus, cameleons targeted to the ER have a DR of between 1.2 and 1.7 in situ. Their signals under physiological stimuli cover only 10% of the available range (Demaurex & Frieden, 2003), further restricting their value.
In all, SEER of mag-indo-1 appears to have a number of advantages, well illustrated by the images shown here. One major shortcoming is that the method is not applicable to intact cells, as the cytosolic dye must be removed. Additionally, the determination of KD should be regarded as tentative, due to the lack of calibration data near the [Ca2+] of half ratio. Systematic errors in the present calibration could make the uncertainty in the measurement of [Ca2+]SR greater than the 2-fold range defined by the confidence region represented in Fig. 9.
Mitochondrial and SR Ca2+ can be monitored in parallel
The first SEER images obtained in muscle cells indicate a dichotomy of concentrations. There is high [Ca2+] releasable by caffeine in a transversally orientated structure easily identifiable as terminal cisternae, and lower [Ca2+] in longitudinally orientated, less regular organelles, identified as mitochondria by Lännergren et al. (1999). Their identity was confirmed by application of SEER in combination with Mitotracker green or rhod-2.
As observed by Lännergren et al. (2001), [Ca2+] in mitochondria was low (near the limit of detection by mag-indo-1). The experiments show clearly the possibility of following changes in [Ca2+]mito and [Ca2+]SR in parallel. In fact, measurement of [Ca2+] in SR regions required characterizing to some extent the concentration in mitochondria (through analysis of ratio histograms, illustrated in Fig. 9). Even though the description of change in [Ca2+]mito was not a primary goal, the analysis yielded clear evidence that Ca2+ uptake from cytosol with up to 800 nm[Ca2+] was much weaker in mitochondria than SR. In this regard it should be noted that any increase in free [Ca2+]SR reflects an uptake that must satisfy the substantial buffering inside this organelle, while Ca2+ buffering in mitochondria should be lower, except in exceptional circumstances (like the presence of the Ca2+-precipitating anion inorganic phosphate). This confirms that substantial uptake by mitochondria requires much higher levels of [Ca2+]cyto, like those reached near SR channels during Ca2+ release (Miyata et al. 1991).
The properties of mag-indo-1 inside the SR
The calibration in situ yielded a half-signal [Ca2+] of 802 μm, which corresponds to a KD of 171 μm, or about 6 times the KD of mag-indo-1 in solution. The decrease in affinity is common to every dye that has been characterized in situ. The change is largely attributable to interactions with cellular ligands that reduce the ability of the bound dye to react with Ca2+ (e.g. Harkins et al. 1993). In the ternary reaction model introduced by Hollingworth et al. (1999), binding of dye D to protein P, to make complex PD, changes its affinity for Ca2+. Simulations with this model, detailed in the Supplemental material, resulted in two findings.
The analytically found dye occupancy by Ca2+ (fo= ([CaD]+[CaPD])/DT) could be perfectly fitted by the one-site binding hyperbola:
| (9) |
The perfect fit demonstrates full isomorphism with a binary reaction, which allows for the definition of an effective dissociation constant Keff. Consequently eqn (1), with Keff substituted for KD, describes the relationship between ratio and free [Ca2+] even when the dye undergoes a ternary interaction as described in this model.
A second outcome of the simulations was to quantify the progressive dissociation of D from P sites as [Ca2+] increases. This shift, a simple consequence of the thermodynamic interdependence of equilibrium constants, was used by Hollingworth et al. (2000) to predict changes in diffusibility of fluo-3 during myoplasmic Ca2+ transients. Simulations assuming that the affinity for free D was 100 times greater than for PD resulted in dissociation of about 90% of the dye from P sites as [Ca2+]SR was raised to 2 mm. Together with SR permeabilization, the increase in intra-SR free dye may have caused the rapid loss of dye observed in our in situ calibrations when [Ca2+]cyto was taken beyond 300 μm.
Evolution of [Ca2+]SR upon changes in [Ca2+]cyto
When changes in [Ca2+]cyto were imposed, [Ca2+]SR evolved qualitatively as expected. According to the in situ calibration, [Ca2+]SR reached 0.51 mm in 100 nm[Ca2+]cyto and 0.67 mm in 800 nm [Ca2+]cyto. (The interval between the dashed curves in Fig. 7B, 0.33 to 0.67 mm in 100 nm [Ca2+]cyto, better reflects the uncertainty in calibration.) These levels are similar to those measured with fluo-5N in isolated cardiomyocytes (Shannon et al. 2003), but lower than the 1–1.5 mm calculated from fluorine NMR of TF-BAPTA in beating hearts (Chen et al. 1996). They are also comparable with those obtained with fura-2 or targeted probes in the ER of different cells, which range from 100 to 600 μm (Golovina & Blaustein, 1997; Demaurex & Frieden, 2003).
To interpret these results we used a model of the SERCA pump (Fernández-Belda et al. 1984) acting as shown in Fig. 13A on a compartment with volume and buffer properties adequate to the frog SR and a Ca2+‘leak’ proportional to the transmembrane [Ca2+] gradient (see details in Methods). The rate constants given by Fernández-Belda et al. (1984) were used after correction for the difference in temperature. The leak rate constant was increased 4-fold from a value derived by Macdonald & Stephenson (2001), to approximate the observed rates of change of [Ca2+]SR. Use of lower leak rate constants resulted in slower evolutions of [Ca2+]SR.
Figure 13. Pump–leak model of evolution of [Ca2+]SR.

A depicts an SR model compartment with a pump and a leak pathway. B, evolution of [Ca2+]SR upon changes in [Ca2+]cyto represented at top of panel. Properties of pump and leak are given in Methods. Both calculations started in the nominally [Ca2+]-free and ATP-free relaxing solution, modelled as having [Ca2+]= 10 nm and [ATP]= 1 μm. To simulate experimental changes, after 100 nm[Ca2+] the system was returned to values representing the relaxing solution. After 800 nm[Ca2+] the system was changed to 100 nm[Ca2+].
The evolution of [Ca2+]SR calculated numerically upon changes in [Ca2+]cyto equal to those applied experimentally is plotted in Fig. 13B. Notable differences between simulation and experimental traces suggest mechanisms absent in the model. First, the asymptotic levels of [Ca2+]SR are much higher in the simulations. In the model, steady [Ca2+]SR is lower than the thermodynamic equilibrium value because there is leak. In cells, leaks occur mainly through the RyR channel and pathways that involve the SR pump (Inesi & de Meis, 1989). That RyRs play a role is clearly demonstrated by the near tripling of steady [Ca2+]SR observed in 800 nm[Ca2+]cyto when channels were blocked by tetracaine (Fig. 11C). Activity of RyRs is known to depend strongly on SR load; the dependence is ascribed to increased Ca2+ activation of channels (Endo et al. 1970; Endo, 1985) and a de-inhibition resulting from reduction in Mg2+ affinity of ‘A’ sites (Laver et al. 2004). These effects must be part of the reason why the steady [Ca2+]SR observed (Fig. 11A) was not much higher in 800 nm than in 100 nm[Ca2+]cyto. Indeed, simulations with greater leak brought the asymptotic [Ca2+] levels closer to the observations. This change, however, also made the transients much faster, which suggests that the model and cells had other differences.
Simulations and observations also evolved differently upon reduction of [Ca2+]cyto. In cells, [Ca2+]SR decreased almost negligibly when [Ca2+]cyto changed from 800 to 100 nm (Fig. 11B). The observation of a slow loss from a loaded SR is consistent with the evidence (reviewed by Inesi, 1994) that elevated Ca2+ in the lumen exerts a kinetic inhibition (the grey arrow in Fig. 13), which is allosteric, unrelated to the role of substrate. Together with leaks, it is this kinetic restriction (a ‘machine constraint’ in the colourful argument by Inesi) that causes the level of [Ca2+]SR to be set at or near 1 mm. The rapid decay in [Ca2+]SR observed upon exposure to solutions with very low Ca2+, with or without ATP, is consistent with a reported cytosolic effect of Ca2+, which prevents leakage through the enzyme itself (‘pump slippage’, documented by Inesi & de Meis, 1989; and in muscle by Macdonald & Stephenson, 2001). Such slippage, rather than reversal, appears to be the mechanism of Ca2+ loss upon reduction of [Ca2+]cyto under the present conditions.
That Ca2+ loss from the SR is generally slow has practical implications. In a study of effects of [Ca2+]cyto on Ca2+ sparks (Zhou et al. 2004) it was difficult to separate those exerted directly on cytosolic effectors, from others secondary to changes in SR load. Because the evolution of [Ca2+]SR is slow, changes in spark frequency observed in that study immediately upon changes in [Ca2+]cyto were probably mediated by cytosolic control sites.
The steady level of RyR channel activity revealed by these experiments is substantial, as revealed by the large change in steady [Ca2+]SR in cells treated with tetracaine. This activity could be normal, or reflect changes upon permeabilization of the plasmalemma. While answering this question will require comparable measurements in intact cells, it should be noted that the responses of these permeabilized fibres are kinetically similar to those in earlier monitoring of total SR calcium load in skinned cells of mammals and amphibians (Endo et al. 1970; Launikonis & Stephenson, 1997; Macdonald & Stephenson, 2001) as well as in experiments on skinned fibres currently in progress in our laboratory. This similarity suggests that leaks and other forms of Ca2+ transport operate at comparable levels in chemically permeabilized and mechanically skinned fibres.
Other applications of SEER
As stated, a valuable feature of SEER of mag-indo-1 is that it does not interfere in practice with cytosolic monitors. We are currently using it together with rhod-2 in the myoplasm to monitor the effects of changes in [Ca2+]SR on properties of sparks. A subset of this work is a study of the effects of sulphate, which shows that the anion precipitates with Ca2+ inside the SR (Launikonis et al. 2005). Line scan imaging with the same combination of dyes, which is in progress to monitor the evolution of [Ca2+]SR near sources of sparks, confirms and extends the observation by Brochet et al. (2005) of localized depletion events in cardiac muscle. A similar approach, which takes advantage of the ability of SEER to resolve [Ca2+] inside mitochondria, is being used to follow the evolution of [Ca2+]mito upon Ca2+ release from the SR. As shown in Fig. 6J, indo-1 is suitable for SEER. It can be used this way wherever fura-2 is applied, with the advantage that it makes confocal imaging possible. In our laboratory, SEER of indo-1 is being applied to monitor [Ca2+]cyto in cultured myotubes, and in demonstration studies with non-muscle cells.
In addition to mag-indo and indo-1, the SEER approach could be used with any indicator that experiences dual shifts, and should not be limited to monitoring ion concentration. One important class of dual-shifting indicators, which comprises rhodamine 123, rhodamine 800, TMRM and TMRE, accumulate in the mitochondrial matrix and undergo a shift upon changes in the electrical potential ΔΨm (Scaduto & Grotyohann, 1999). SEER should afford a sensitive monitor of such changes. Of similar interest are reports of blue shifts in the emission spectrum of fura-2 (nominally an excitation-shifting dye) and in the absorption spectrum of fluo-3 upon binding to proteins in solution (Konishi et al. 1988; Harkins et al. 1993).
Acknowledgments
We are grateful to Drs S.-S. Sheu, University of Rochester, and N. Shirokova, UMDNJ, for helpful suggestions. This work was supported by the NIH (NIAMS, to E.R.; NHLBI, to T.S.) and PEDECIBA (Uruguay, to G.B.). B.L. was a C.J. Martin Fellow of the NHMRC (Australia).
Appendix I:Sensitivity and noise
The purpose is to derive general expressions for sensitivity and signal-to-noise ratios. This allows for a quantitative comparison of conventional and SEER ratioing, and provides general criteria for choosing excitation and emission wavelengths and photomultiplier gains.
Sensitivity
Sensitivity, S, is defined as change in signal per unit change in [Ca2+]. It can be derived from an expression of ratio in terms of [Ca2+], which follows from eqn (1):
| (A1) |
| (A2) |
S can also be written as:
| (A3) |
the product of a concentration-independent maximum:
| (A4) |
and a sharply declining concentration-dependent factor, which determines a 4-fold reduction at midpoint, when [Ca2+]=γKD and the ratio reaches the value (Rmax+Rmin)/2.
Also useful is the logarithmic sensitivity, which quantifies the visibility of changes in ratio images:
| (A5) |
Equation (A5) expresses formally the value of the dynamic range as key determinant of sensitivity. The dynamic range of SEER in situ is 12.4 (Fig. 10) and γ is 4.7; the corresponding values for conventional emission ratioing are 3 and 1.7, respectively. Hence SEER increases logarithmic sensitivity by a factor of 2.1 ((11.4/4.7)/(2/1.7)) over conventional ratioing.
Noise in ratio measurements
By stressing the importance of dynamic ratio, the previous section suggests that excitation and emission wavelengths should be defined so that ratio values are maximized. On the other hand, the increase in dynamic range, which increases sensitivity, also amplifies noise and may reduce signal-to-noise ratio. To formalize the analysis, R is written as:
| (A6) |
with noise in the numerator represented as a normally distributed random variable ɛ1, of mean value 0 and standard deviation s1, and a corresponding variable ɛ2 added to the denominator.
An approximate expression for the variance of fluorescence detected by a photomultiplier is given by Art (1995). Here one must note that F11, treated until now as a ‘fluorescence’, is a PMT output. It is equal to:
| (A7) |
the product of the number of photons np, the quantum efficiency of conversion to photoelectrons at the photocathode QE and the gain of amplification up to the anode m1. The standard deviation s1 is approximately equal to (npQE)1/2m1 (= (F11m1)1/2) and the signal-to-noise ratio, F11/s1, is (npQE)1/2 (= (F11/m1)1/2). The last expression implies that the signal-to-noise ratio is independent of PMT gain, a fact confirmed experimentally in our laboratory.
The variance of R can be calculated from the general expression for a ratio of independent random variables (eqn 3.26 in Bevington & Robinson, 2003) as:
| (A8) |
and the signal to noise ratio (s/n):
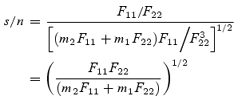 |
(A9) |
This expression is symmetric in the two fluorescence terms, hence the choice of numerator and denominator in the ratio is immaterial. Its dependence of PMT gains can be derived by substituting the expression in eqn (A7):
 |
(A10) |
As expected, the signal-to-noise ratio is independent of PMT gain. Very low values of the photocurrents npjQEj (which are linear functions of the actual fluorescence) should be avoided, and if one is very small, making the other greater will not help. In this regard np1QE1 is the main problem, as fluorescence in range 1 (defined in Fig. 1) is always small. It is alleviated by using the highest possible intensity I1 and by collecting light in the widest emission range possible. According to eqn (A10), noise will also increase at high [Ca2+], when np2QE2 becomes small.
Appendix II:A monitor of dye concentration
In non-ratiometric, or single-wavelength dyes, [Ca2+] and total dye concentration, DT, are multiplicative factors of overall fluorescence and cannot therefore be separated simply from fluorescence measurements. The well-known advantage of ratiometric dyes is that they yield a number, the ratio, which is related to [Ca2+] independently of DT. Because [Ca2+] can be known, DT can also be derived independently of [Ca2+]. The derivation is trivial when there is an isosbestic or crossover wavelength, where the signal is [Ca2+] independent. Even in the absence of an isosbestic signal, a particular linear combination of intensities at two wavelengths exists, which is independent of [Ca2+] and proportional to DT.
Let eD1 be the fluorescence collected in range 1 (Fig. 1) for unit excitation intensity at 351 nm and unit dye concentration at [Ca2+]= 0, eC1 the corresponding value in saturating [Ca2+], and eD2 and eC2 the corresponding F22 values. Then, at the [Ca2+] that produces a concentration [CaD] of Ca2+-bound dye the fluorescence intensities excited by lights of intensity I1 at 351 nm and I2 at 364 nm will be, respectively,
and
| (A11) |
It is possible to find α1 and α2 so that:
| (A12) |
at any [Ca2+].
Equation (A12) can be solved for α1 and α2 by substituting F11 and F22 from eqn (A11):
| (A13) |
Equation (A13) can only be satisfied in general if it is separately true for [D] and [CaD]. These equations yield:
| (A14) |
and
| (A15) |
α1 and α2 are calculated by measuring F11 and F22 in aqueous solutions of the same known DT and different [Ca2+] and solving the system of eqn (A12). They are steeply dependent on laser intensity, pinhole size and PMT gains, but not on magnification.
Equation (A12) was used to compute pixel-by-pixel DT (x,y) images like those shown in Fig. 5D. Such images were then used to establish well-stained regions and calculate averages of R[Ca2+]SR plotted in Figs 7 and 10–12.
Supplemental material
The online version of this paper can be accessed at: 10.1113/jphysiol.2005.087973 jp.physoc.org/cgi/data/jphysiol.2005.087973/DC1/1 and contains one supplemental figure titled: Possible dye interactions in cells, and supplemental material titled: Analytical expressions for equilibrium concentrations in the reaction scheme of supplemental figure. The supplement gives analytical expressions for the equilibrium concentrations in a ternary reaction of dye, calcium and cellular binding sites.
This material can also be found as part of the full-text HTML version available from www.blackwell-synergy.com
References
- Agard DA, Hiraoka Y, Shaw P, Sedat JW. Fluorescence microscopy in three dimensions. Meth Cell Biol. 1989;30:353–377. doi: 10.1016/s0091-679x(08)60986-3. [DOI] [PubMed] [Google Scholar]
- Art J. Photon detectors for confocal microscopy. In: Pawley JB, editor. Handbook of Biological Confocal Microscopy. 2nd. New York: Plenum Press; 1995. pp. 189–190. [Google Scholar]
- Baird GS, Zacharias DA, Tsien RY. Circular permutation and receptor insertion within green fluorescent proteins. Proc Natl Acad Sci U S A. 1999;96:11241–11246. doi: 10.1073/pnas.96.20.11241. [DOI] [PMC free article] [PubMed] [Google Scholar]
- Berridge MJ, Bootman MD, Roderick HL. Calcium signalling: dynamics, homeostasis and remodelling. Nat Rev Mol Cell Biol. 2003;4:517–529. doi: 10.1038/nrm1155. [DOI] [PubMed] [Google Scholar]
- Bevington PR, Robinson DK. Data Reduction and Error Analysis. Boston: Mc Graw Hill; 2003. pp. 43–44. [Google Scholar]
- Brini M, Carafoli E. Calcium signalling: a historical account, recent developments and future perspectives. Cell Mol Life Sci. 2000;57:354–370. doi: 10.1007/PL00000698. [DOI] [PMC free article] [PubMed] [Google Scholar]
- Brochet DX, Yang D, Di Maio A, Lederer WJ, Franzini-Armstrong C, Cheng H. Ca2+ blinks: rapid nanoscopic store calcium signaling. Proc Natl Acad Sci U S A. 2005;102:3099–3104. doi: 10.1073/pnas.0500059102. [DOI] [PMC free article] [PubMed] [Google Scholar]
- Carafoli E. Calcium signaling: a tale for all seasons. Proc Natl Acad Sci U S A. 2002;99:1115–1122. doi: 10.1073/pnas.032427999. [DOI] [PMC free article] [PubMed] [Google Scholar]
- Chen W, Steenbergen C, Levy LA, Vance J, London RE, Murphy E. Measurement of free Ca2+ in sarcoplasmic reticulum in perfused rabbit heart loaded with 1,2-bis (2-amino-5,6-difluorophenoxy) ethane-N,N,N',N'-tetraacetic acid by 19F NMR. J Biol Chem. 1996;271:7398–7403. [PubMed] [Google Scholar]
- Cheung A, Dantzig JA, Hollingworth S, Baylor SM, Goldman YE, Mitchison TJ, Straight AF. A small-molecule inhibitor of skeletal muscle myosin II. Nat Cell Biol. 2002;4:83–88. doi: 10.1038/ncb734. [DOI] [PubMed] [Google Scholar]
- Dawson MJ, Gadian DG, Wilkie DR. Muscular fatigue investigated by phosphorus nuclear magnetic resonance. Nature. 1978;274:861–866. doi: 10.1038/274861a0. [DOI] [PubMed] [Google Scholar]
- Demaurex N, Frieden M. Measurements of the free luminal ER Ca2+ concentration with targeted ‘cameleon’ fluorescent proteins. Cell Calcium. 2003;34:109–119. doi: 10.1016/s0143-4160(03)00081-2. [DOI] [PubMed] [Google Scholar]
- de Meis L. Approaches to studying the mechanisms of ATP synthesis in sarcoplasmic reticulum. Meth Enzymol. 1988;157:190–206. doi: 10.1016/0076-6879(88)57075-1. [DOI] [PubMed] [Google Scholar]
- Donoso P, Prieto H, Hidalgo C. Luminal calcium regulates calcium release in triads isolated from frog and rabbit skeletal muscle. Biophys J. 1995;68:507–515. doi: 10.1016/S0006-3495(95)80212-2. [DOI] [PMC free article] [PubMed] [Google Scholar]
- Duchen MR. Mitochondria and Ca2+ in cell physiology and pathophysiology. Cell Calcium. 2000;28:339–348. doi: 10.1054/ceca.2000.0170. [DOI] [PubMed] [Google Scholar]
- Endo M. Calcium release from sarcoplasmic reticulum. Current Topics Membranes Transport. 1985;25:181–230. [Google Scholar]
- Endo M, Tanaka M, Ogawa Y. Calcium induced release of calcium from the sarcoplasmic reticulum of skinned skeletal muscle fibres. Nature. 1970;228:34–36. doi: 10.1038/228034a0. [DOI] [PubMed] [Google Scholar]
- Fernández-Belda F, Kurzmack M, Inesi G. A comparative study of calcium transients by isotopic tracer, metallochromic indicator, and intrinsic fluorescence in sarcoplasmic reticulum ATPase. J Biol Chem. 1984;259:9687–9698. [PubMed] [Google Scholar]
- Fill M, Copello JA. Ryanodine receptor calcium release channels. Physiol Rev. 2002;82:893–922. doi: 10.1152/physrev.00013.2002. [DOI] [PubMed] [Google Scholar]
- Franzini-Armstrong C. The sarcoplasmic reticulum and the control of muscle contraction. FASEB J. 1999;13(Suppl. 2):S266–270. doi: 10.1096/fasebj.13.9002.s266. [DOI] [PubMed] [Google Scholar]
- Fryer MF, Stephenson DG. Total and sarcoplasmic reticulum calcium contents of skinned fibres from rat skeletal muscle. J Physiol. 1996;493:357–370. doi: 10.1113/jphysiol.1996.sp021388. [DOI] [PMC free article] [PubMed] [Google Scholar]
- Golovina VA, Blaustein MP. Spatially and functionally distinct Ca2+ stores in sarcoplasmic and endoplasmic reticulum. Science. 1997;275:1643–1648. doi: 10.1126/science.275.5306.1643. [DOI] [PubMed] [Google Scholar]
- Grynkiewicz G, Poenie M, Tsien RY. A new generation of Ca2+ indicators with greatly improved fluorescence properties. J Biol Chem. 1985;260:3440–3450. [PubMed] [Google Scholar]
- Györke S, Györke I, Lukyanenko V, Terentyev D, Viatchenko-Karpinski S, Wiesner TF. Regulation of sarcoplasmic reticulum calcium release by luminal calcium in cardiac muscle. Front Biosci. 2002;7:d1454–1463. doi: 10.2741/A852. [DOI] [PubMed] [Google Scholar]
- Hamming RW. Digital Filters. 3rd. Mineola, NY: Dover Publications Inc; 1998. pp. 196–200. [Google Scholar]
- Harkins AB, Kurebayashi N, Baylor SM. Resting myoplasmic free calcium in frog skeletal muscle fibers estimated with fluo-3. Biophys J. 1993;65:865–881. doi: 10.1016/S0006-3495(93)81112-3. [DOI] [PMC free article] [PubMed] [Google Scholar]
- Hollingworth S, Soeller C, Baylor SM, Cannell MB. In skeletal muscle fibres, a rise in myoplasmic calcium appears to speed the diffusion of fluo-3 by perturbing the equilibrium between protein-free and protein-bound indicator. J General Physiol. 1999;114:11a. [Google Scholar]
- Hollingworth S, Soeller C, Baylor SM, Cannell MB. Sarcomeric Ca2+ gradients during activation of frog skeletal muscle fibres imaged with confocal and two-photon microscopy. J Physiol. 2000;526:551–560. doi: 10.1111/j.1469-7793.2000.t01-1-00551.x. [DOI] [PMC free article] [PubMed] [Google Scholar]
- Inesi G. Teaching active transport at the turn of the twenty-first century: recent discoveries and conceptual changes. Biophys J. 1994;66:554–560. doi: 10.1016/s0006-3495(94)80872-0. [DOI] [PMC free article] [PubMed] [Google Scholar]
- Inesi G, de Meis L. Regulation of steady state filling in sarcoplasmic reticulum. Roles of back-inhibition, leakage and slippage of the calcium pump. J Biol Chem. 1989;264:5929–5936. [PubMed] [Google Scholar]
- Kabbara AA, Allen DG. The use of the indicator fluo-5N to measure sarcoplasmic reticulum calcium in single muscle fibres of the cane toad. J Physiol. 2001;534:87–97. doi: 10.1111/j.1469-7793.2001.00087.x. [DOI] [PMC free article] [PubMed] [Google Scholar]
- Keij JF, Bell-Prince C, Steinkamp JA. Staining of mitochondrial membranes with 10-nonyl acridine orange, MitoFluor Green, and MitoTracker Green is affected by mitochondrial membrane potential altering drugs. Cytometry. 2000;39:203–210. doi: 10.1002/(sici)1097-0320(20000301)39:3<203::aid-cyto5>3.0.co;2-z. [DOI] [PubMed] [Google Scholar]
- Konishi M, Olson A, Hollingworth S, Baylor SM. Myoplasmic binding of fura-2 investigated by steady-state fluorescence and absorbance measurements. Biophys J. 1988;54:1089–1104. doi: 10.1016/S0006-3495(88)83045-5. [DOI] [PMC free article] [PubMed] [Google Scholar]
- Lännergren J, Bruton JD, Westerblad H. Vacuole formation in fatigued single muscle fibres from frog and mouse. J Muscle Res Cell Motil. 1999;20:19–32. doi: 10.1023/a:1005412216794. [DOI] [PubMed] [Google Scholar]
- Lännergren J, Westerblad H, Bruton JD. Changes in mitochondrial Ca2+ detected with Rhod-2 in single frog and mouse skeletal muscle fibres during and after repeated tetanic contractions. J Muscle Res Cell Motil. 2001;22:265–275. doi: 10.1023/a:1012227009544. [DOI] [PubMed] [Google Scholar]
- Launikonis BS, Brum G, Ríos E, Zhou J. How the calcium precipitating anions inorganic phosphate and SO42− alter intra-SR calcium in skeletal muscle cells. Biophys J. 2005;88:89a. [Google Scholar]
- Launikonis BS, Stephenson DG. Effect of saponin treatment on the sarcoplasmic reticulum of rat, cane toad and crustacean (yabby) skeletal muscle. J Physiol. 1997;504:425–437. doi: 10.1111/j.1469-7793.1997.425be.x. [DOI] [PMC free article] [PubMed] [Google Scholar]
- Launikonis BS, Stephenson DG. Osmotic properties of the sealed tubular system of toad and rat skeletal muscle. J General Physiol. 2004;123:231–247. doi: 10.1085/jgp.200308946. [DOI] [PMC free article] [PubMed] [Google Scholar]
- Laver DR, O'Neill ER, Lamb GD. Luminal Ca2+-regulated Mg2+ inhibition of skeletal RyRs reconstituted as isolated channels or coupled clusters. J General Physiol. 2004;124:741–758. doi: 10.1085/jgp.200409092. [DOI] [PMC free article] [PubMed] [Google Scholar]
- Macdonald WA, Stephenson DG. Effects of ADP on sarcoplasmic reticulum function in mechanically skinned skeletal muscle fibres of the rat. J Physiol. 2001;532:499–508. doi: 10.1111/j.1469-7793.2001.0499f.x. [DOI] [PMC free article] [PubMed] [Google Scholar]
- Meldolesi J, Pozzan T. The endoplasmic reticulum Ca2+ store: a view from the lumen. Trends Biochem Sci. 1998;23:10–14. doi: 10.1016/s0968-0004(97)01143-2. [DOI] [PubMed] [Google Scholar]
- Messerli JM, van der Voort HT, Rungger Brandle E, Perriard JC. Three dimensional visualization of multi channel volume data: the amSFP algorithm. Cytometry. 1993;14:725–735. doi: 10.1002/cyto.990140705. [DOI] [PubMed] [Google Scholar]
- Miyata H, Silverman HS, Sollott SJ, Lakatta EG, Stern MD, Hansford RG. Measurement of mitochondrial free Ca2+ concentration in living single rat cardiac myocytes. Am J Physiol. 1991;261:H1123–H1134. doi: 10.1152/ajpheart.1991.261.4.H1123. [DOI] [PubMed] [Google Scholar]
- Miyawaki A, Llopis J, Heim R, McCaffery JM, Adams JA, Ikura M, Tsien RY. Fluorescent indicators for Ca2+ based on green fluorescent proteins and calmodulin. Nature. 1997;388:882–887. doi: 10.1038/42264. [DOI] [PubMed] [Google Scholar]
- Montero M, Brini M, Marsault R, Alvarez J, Sitia R, Pozzan T, Rizzuto R. Monitoring dynamic changes in free Ca2+ concentration in the endoplasmic reticulum of intact cells. EMBO J. 1995;14:5467–5475. doi: 10.1002/j.1460-2075.1995.tb00233.x. [DOI] [PMC free article] [PubMed] [Google Scholar]
- Nagai T, Sawano A, Park ES, Miyawaki A. Circularly permuted green fluorescent proteins engineered to sense Ca2+ Proc Natl Acad Sci U S A. 2001;98:3197–3202. doi: 10.1073/pnas.051636098. [DOI] [PMC free article] [PubMed] [Google Scholar]
- Nakamura H, Nakasaki Y, Matsuda N, Shigekawa M. Inhibition of sarcoplasmic reticulum Ca2+-ATPase by 2,5-di(tert-butyl)-1,4-benzohydroquinone. J Biochem (Tokyo) 1992;112:750–755. doi: 10.1093/oxfordjournals.jbchem.a123970. [DOI] [PubMed] [Google Scholar]
- Novak I, Nitschke R, Amstrup J. Purinergic receptors have different effects in rat exocrine pancreas. Calcium signals monitored by fura-2 using confocal microscopy. Cell Physiol Biochem. 2002;12:83–92. doi: 10.1159/000063784. [DOI] [PubMed] [Google Scholar]
- Pizarro G, Ríos E. How source content determines intracellular Ca2+ release kinetics. Simultaneous measurement of [Ca2+] transients and [H+] displacement in skeletal muscle. J General Physiol. 2004;124:239–258. doi: 10.1085/jgp.200409071. [DOI] [PMC free article] [PubMed] [Google Scholar]
- Rudolf R, Mongillo M, Magalhaes PJ, Pozzan T. In vivo monitoring of Ca2+ uptake into mitochondria of mouse skeletal muscle during contraction. J Cell Biol. 2004;166:527–536. doi: 10.1083/jcb.200403102. [DOI] [PMC free article] [PubMed] [Google Scholar]
- Scaduto RC, Jr, Grotyohann LW. Measurement of mitochondrial membrane potential using fluorescent rhodamine derivatives. Biophys J. 1999;76:469–477. doi: 10.1016/S0006-3495(99)77214-0. [DOI] [PMC free article] [PubMed] [Google Scholar]
- Shannon TR, Guo T, Bers DM. Ca2+ scraps: local depletions of free [Ca2+] in cardiac sarcoplasmic reticulum during contractions leave substantial Ca2+ reserve. Circ Res. 2003;93:40–45. doi: 10.1161/01.RES.0000079967.11815.19. [DOI] [PubMed] [Google Scholar]
- Shirokova N, García J, Pizarro G, Ríos E. Ca2+ release from the sarcoplasmic reticulum compared in amphibian and mammalian skeletal muscle. J General Physiol. 1996;107:1–18. doi: 10.1085/jgp.107.1.1. [DOI] [PMC free article] [PubMed] [Google Scholar]
- Shmigol AV, Eisner DA, Wray S. Simultaneous measurements of changes in sarcoplasmic reticulum and cytosolic calcium. J Physiol. 2001;531:707–713. doi: 10.1111/j.1469-7793.2001.0707h.x. [DOI] [PMC free article] [PubMed] [Google Scholar]
- Smith RS, Ovalle WK. Varieties of fast and slow extrafusal muscle fibres in amphibian hind limb muscles. J Anat. 1973;116:1–24. [PMC free article] [PubMed] [Google Scholar]
- Tripathy A, Meissner G. Sarcoplasmic reticulum lumenal Ca2+ has access to cytosolic activation and inactivation sites of skeletal muscle Ca2+ release channel. Biophys J. 1996;70:2600–2615. doi: 10.1016/S0006-3495(96)79831-4. [DOI] [PMC free article] [PubMed] [Google Scholar]
- van der Voort HTM, Strasters KC. Restoration of confocal images for quantitative image analysis. J Microscopy. 1995;178:165–181. [Google Scholar]
- Xu L, Jones R, Meissner G. Effects of local anesthetics on single channel behavior of skeletal muscle calcium release channel. J General Physiol. 1993;101:207–233. doi: 10.1085/jgp.101.2.207. [DOI] [PMC free article] [PubMed] [Google Scholar]
- Zhou J, Launikonis BS, Ríos E, Brum G. Regulation of Ca2+ sparks by Ca2+ and Mg2+ in mammalian and amphibian muscle. An RyR isoform-specific role in excitation-contraction coupling? J General Physiol. 2004;124:409–428. doi: 10.1085/jgp.200409105. [DOI] [PMC free article] [PubMed] [Google Scholar]
Associated Data
This section collects any data citations, data availability statements, or supplementary materials included in this article.