Abstract
We have characterized developmental changes in the kinetics and quantal parameters of action potential (AP)-evoked neurotransmitter release during maturation of the calyx of Held synapse. Quantal size (q) and peak amplitudes of evoked EPSCs increased moderately, whereas the fraction of vesicles released by single APs decreased. During synaptic depression induced in postnatal day (P) 5–7 synapses by 10–100 Hz stimulation, q declined rapidly to 40–12% of its initial value. The decrease in q was generally smaller in more mature synapses (P12–14), but quite severe for frequencies ≥ 300 Hz. The stronger decline of q in immature synapses resulted from a slower recovery from desensitization, presumably due to delayed glutamate clearance. Recovery from this desensitization followed an exponential time course with a time constant of ∼480 ms in P5–7 synapses, and sped up > 20-fold during maturation. Deconvolution analysis of EPSCs revealed a significant acceleration of the release time course during development, which was accompanied by a 2-fold increase of the peak release rate. During long 100 Hz trains, more mature synapses were able to sustain average rates of 8–10 quanta s−1 per active zone for phasic release. The rates of asynchronous vesicle release increased transiently > 35-fold immediately after such stimuli and decayed rapidly with an exponential time constant of ∼50 ms to low resting levels of spontaneous release. However, even following extended periods of 100 Hz stimulation, the amount of asynchronous release was relatively minor with peak rates of less than 5% of the average rate of synchronous release measured at steady state during the tetani. Therefore, a multitude of mechanisms seems to converge on the generation of fast, temporally precise and reliable high-frequency transmission at the mature calyx of Held synapse.
A significant part of our current understanding about the mechanisms of information processing at individual synaptic contacts has come from a limited number of well studied ‘model’ synapses (Walmsley et al. 1998; Zucker & Regehr, 2002; Blitz et al. 2004; Rizzoli & Betz, 2005). Among the glutamatergic synapses of the mammalian brain, the calyx of Held in the auditory brainstem has become one of the best characterized (Meinrenken et al. 2003). This derives primarily from the unusual large size of the terminal of this axo-somatic synapse which therefore renders it accessible to techniques allowing a direct investigation of pre- and postsynaptic mechanisms of synaptic transmission (Forsythe, 1994; Borst et al. 1995; Takahashi et al. 1996; Sun & Wu, 2001).
While the large size of calyceal terminals represents a major experimental advantage, this intriguing morphology also poses some new challenges: (i) The number of quanta released by single APs is far higher compared with most other synapses in the brain, which renders this junction not easily amenable to some classical approaches of quantal analysis, such as analysis of transmission failures or amplitude distributions of postsynaptic currents (PSCs). Instead, fluctuation analysis of PSC amplitudes (reviewed in Clements & Silver, 2000) has proven a suitable alternative for the analysis of quantal parameters and their modulation during short-term plasticity. (ii) Since the calyx terminal possesses hundreds of release sites, which face a common synaptic cleft, individual sites may not operate independently. Released glutamate may easily interact with neighbouring sites and, owing to the large amounts of discharged transmitter, residual glutamate may slowly accumulate in the synaptic cleft (Trussell et al. 1993). (iii) There is growing evidence that some functional properties of relatively young synapses (P8–10) differ significantly from those of more mature calyxes, which reach adult-like morphology only after the second postnatal week (Kandler & Friauf, 1993). In fact, this preparation has been a valuable system for studying the postnatal maturation of glutamatergic synapses at the single synapse level. Functional developmental refinements described so far include changes in presynaptic AP waveform, pharmacological profile of presynaptic Ca2+ channels, kinetics of AMPA and NMDA EPSCs and dynamic properties of this synapse (Chuhma & Ohmori, 1998; Taschenberger & von Gersdorff, 2000; Iwasaki & Takahashi, 2001; Joshi & Wang, 2002; Fedchyshyn & Wang, 2005). However, detailed and quantitative information about these functional modifications, as well as their underlying mechanisms, is still sparse and we are far from understanding how the mature calyx of Held synapse is able to operate as a precisely timed and reliable relay in the near-kiloHertz range (up to 800 Hz, Taschenberger & von Gersdorff, 2000). Developmental changes in the time course of phasic AP-evoked release have not been investigated in detail. The mechanisms contributing to synaptic depression typically observed during repetitive stimulation are still debated. Some studies suggested a minor role of postsynaptic desensitization in more mature calyxes (Joshi & Wang, 2002; Taschenberger et al. 2002) but others have questioned this conclusion (Wong et al. 2003). Little is known about late asynchronous quantal release after strong stimulation at the calyx of Held, where desensitization of postsynaptic receptors may preclude the detection of asynchronously released quanta. Here we address these points in turn with experiments and a quantitative analysis.
Methods
Slice preparation
Brainstem slices were obtained from postnatal day (P) 5–14 Wistar rats essentially as described (Taschenberger & von Gersdorff, 2000). Experiments were performed according to the ethical guidelines of the state of Lower Saxony. After decapitation, the brainstem was quickly immersed in ice-cold low-Ca2+ artificial cerebral spinal fluid (aCSF) containing (mm): NaCl 125, KCl 2.5, MgCl2 3, CaCl2 0.1, glucose 25, NaHCO3 25, NaH2PO4 1.25, ascorbic acid 0.4, myo-inositol 3, sodium pyruvate 2, pH = 7.3 when bubbled with carbogen (95% O2–5% CO2). The brainstem was glued onto the stage of a VT1000S vibratome (Leica, Germany) and 200 μm thick slices were cut. Slices were transferred to an incubation chamber containing normal aCSF and maintained at 35°C for 30–40 min, and thereafter kept at room temperature (22–24°C) for ≤ 4 h. The composition of normal aCSF was identical to low-Ca2+ aCSF except that 1.0 mm MgCl2 and 2.0 mm CaCl2 were used.
Electrophysiological recordings
Whole-cell voltage-clamp recordings were made from principal neurones in the medial nucleus of the trapezoid body (MNTB) using an EPC-10 amplifier (HEKA, Germany). Sampling intervals and filter settings were ≤ 20 μs and 4.5 kHz, respectively. Membrane currents were digitized and stored on disk using Pulse software (Heka, Germany) running on a PC. Cells were visualized by differential interference contrast and infrared video (IR-DIC) microscopy through a 40 × water-immersion objective (NA = 0.8) using an upright BX51WI microscope (Olympus, Germany) equipped with a 1.5–2 × pre-magnification and a VX45 CCD camera (PCO, Germany). All experiments were carried out at room temperature (22–24°C).
Patch pipettes were pulled from leaded glass (WPI) on a PIP-5 puller (Heka, Germany). Pipettes were coated with dental wax to reduce stray capacitance. Open tip resistance was 1–3 MΩ. Access resistance (RS) was ≤ 6 MΩ and routinely compensated by 75–95%. No corrections were made for liquid junction potentials.
Excitatory PSCs (EPSCs) were elicited by afferent fibre stimulation via a bipolar stimulation electrode placed half way between the brainstem midline and the MNTB, and recorded at a holding membrane potential (Vh) of −70 mV. Stimulation pulses (100 μs duration) were applied using a stimulus isolator unit (AMPI, Israel), with the output voltage set to 1–2 V above threshold (≤ 35 V) to exclude stimulation failures at higher frequencies. EPSC trains could be reliably evoked in every postsynaptic neurone up to 100 Hz for P5–7 and up to 300 Hz for P12–14 synapses. For each AP-evoked EPSC (eEPSC) the series resistance (RS) value was updated and stored with the data using the automated RS compensation routine implemented in ‘Pulse’. The pipette solution for measuring EPSCs consisted of (mm): CsCl 150, TEA-Cl 10, Hepes 10, EGTA 5, disodium phosphocreatine 2, ATP-Mg 4, GTP 0.3, pH = 7.3 with CsOH.
Drug application
Bicuculline methiodide (25 μm) and strychnine (2 μm) were included in the bath solution to block inhibitory synaptic currents. For cross-desensitization experiments, 250 μm kainic acid (KA), dissolved in bath solution, was puff applied (1 bar, 300 ms) from a nearby placed patch pipette (∼20–40 μm distance). Puff application of control solution did not affect synaptic transmission. Bicuculline, strychnine and KA were from Tocris Cookson. All other salts and chemicals were from Sigma.
Offline analysis
Offline analysis was performed with IgorPro software (Wavemetrics, USA). After correction for remaining series-resistance errors (Traynelis, 1998) using the RS values stored in the data files (assuming a linear I–V relationship with a reversal potential of 0 mV), EPSCs were offset corrected and low-pass filtered (fcutoff= 4.5 kHz) using a 10-pole software Bessel filter. For NMDA eEPSC trains the offset was determined by extrapolating double exponentials fitted to the decay phase of the preceding eEPSC to the time of the eEPSC peak. Miniature EPSCs (mEPSCs) were detected using a sliding template algorithm (Jonas et al. 1993; Clements & Bekkers, 1997). The mEPSC template length of 6–9 ms allowed detection of non-overlapping mEPSCs up to a rate of 110–170 events s−1. Events were only accepted as mEPSCs when the calculated detection criterion exceeded the standard deviation of the background noise at least 3-fold. An inverted template was used to check for false positive events. All data are reported as mean ±s.e.m. Statistical analysis was performed using the unpaired Student's t test (assuming unequal variances).
Fluctuation analysis
We applied two types of fluctuation analysis to repetitively elicited EPSCs (≥ 50, typically 100 repetitions). In the first method, referred to as ‘discrete ensemble fluctuation analysis’, peak amplitude fluctuations of single eEPSCs or trains were analysed essentially as described by Scheuss et al. (2002). An inter-sweep interval of 15–20 s was sufficient to allow full recovery from synaptic depression which developed during stimulation with trains of 10–50 stimuli at frequencies between 10 to 300 Hz. The ensemble mean of the ith eEPSC peak amplitude in the train was calculated according to:
| (1) |
where r denotes the individual repetition and R the total number of trains. Second (μ2=σ2) and third (μ3) moments about the means of eEPSC amplitude distributions were calculated segment-wise using maximum overlap (Scheuss & Neher, 2001) and applying the minimum possible segment sizes of n = 2 for the second moment:
with
| (2) |
and n = 3 for the third moment:
with
| (3) |
With  being the rth ensemble average of the ith eEPSC amplitude in the train:
| (4) |
For the calculation of the second moment (μ2) with a segment size of n = 2, eqn (2) simplifies to:
| (5) |
For ‘discrete ensemble fluctuation analysis’ we used these quantities as described below.
Using a second method, termed ‘continuous ensemble fluctuation analysis’, we studied late asynchronous release after prolonged high-frequency stimulation (50 stimuli, 100 Hz) essentially as described by Neher & Sakaba (2001b) except that the band-pass filter applied to difference traces was a combination of a 400 Hz single-pole high-pass followed by a 2 kHz Gaussian low-pass filter. Amplitudes and rates of spontaneous release events were estimated from 3rd and 4th cumulants (eqns 14 and 15 in Neher & Sakaba, 2001b). For each individual synapse, the calibration constants H3′, Z3′, H4′ and Z4′ were calculated from amplitude distributions and triple-exponential fits to average waveforms of mEPSCs sampled from baseline regions. Average values for the calibration constants were H3′= 2.049 ± 0.097, Z3′= 2039 ± 129 s−1, H4′= 1.131 ± 0.030 and Z4′= 11891 ± 311 s−1 (n = 6).
Variance–mean analysis with ‘jitter’ correction
Various forms of fluctuation analysis have been used in the past to estimate the quantal parameters N (number of release sites), p (release probability) and q (quantal size) (Silver et al. 1998; Clements & Silver, 2000; Oleskevich et al. 2000; Meyer et al. 2001; Scheuss et al. 2002). They are all based on the quantal theory (Katz, 1969), according to which the average eEPSC peak amplitude (I) is:
| (6) |
Knowing q, the quantal content (M) is readily obtained from:
| (7) |
Assuming binomial statistics, the variance (σ2) of eEPSC peak amplitudes can be written as:
| (8) |
Dividing σ2 by I yields:
| (9) |
Provided that p≪ 1, q can, thus, be approximated from the variance of eEPSC peak amplitudes divided by their mean amplitude (σ2/I).
However, stochastic fluctuations of the peak eEPSC amplitude arise not only from a variable number of quanta contributing to the eEPSCs. They also derive from variability of q at single sites (intrasite, type 1) and/or between individual sites (intersite, type 2). Correspondingly, methods have been developed to correct for the additional variance introduced by quantal size variability (Frerking & Wilson, 1996; Silver et al. 1998). Another source of variability, which has received little attention so far, derives from latency fluctuations of individual quantal events (‘jitter’). Since we wanted to study developmental changes in release parameters and because the amount of such temporal ‘jitter’ may change during the developmental period of interest (Chuhma et al. 2001), we considered it mandatory to include a correction for latency fluctuations in our analysis. In the appendix we derive equations which allow us to correct both for variability of quantal size and for variability of quantal latencies, based on the measured time course of release, on the average mEPSC waveform and the mEPSC amplitude distribution. Accordingly, we corrected all q estimates from σ2/I by multiplication with the factor  , where CVq denotes the average coefficient of variation of mEPSC amplitude distributions, f¯ represents the mean attenuation factor characterizing the average contribution of q to the average eEPSC peak amplitude and CVf denotes the coefficient of variation of f (see Appendix). Average values for CVq, f¯ and CVf at the respective ages are given in Table 1. Surprisingly, it turned out that for the rapid mEPSC kinetics at the calyx of Held, the correction for latency fluctuation nearly cancelled that for quantal size variability. For both the early as well as the later stage of development considered here, the corrected q estimates were therefore very close to the uncorrected values σ2/I.
Table 1.
Summary of functional properties of spontaneous quantal currents and EPSCs evoked by afferent-fibre stimulation at the developing calyx of Held synapse
| Parameter | P5–7 | P12–14 |
|---|---|---|
| mEPSCs | ||
| 20–80% rise time (μs) | 165 ± 7 (n = 10) | 102 ± 2 (n = 19) |
| Decay τ | ||
| τfast (ms) | 1.04 ± 0.08 (n = 10) | 0.22 ± 0.02 (n = 19) |
| τslow (ms) | 4.83 ± 0.78 (n = 10) | 1.25 ± 0.20 (n = 19) |
| afast (%) a | 72 ± 4 (n = 10) | 77 ± 4 (n = 19) |
| τm (ms) b | 1.91 ± 0.19 (n = 10) | 0.39 ± 0.03 (n = 19) |
| q (pA) | 36 ± 4 (n = 10) | 58 ± 5 (n = 19) |
| CVq | 0.36 ± 0.03 (n = 10) | 0.42 ± 0.02 (n = 19) |
| eEPSCs | ||
| Peak amplitude (nA) | 6.82 ± 0.37 (n = 48) | 7.40 ± 0.42 (n = 62) |
| q (pA)c | 54 ± 3 (n = 48) | 59 ± 3 (n = 62) |
| ¯fd | 0.86 ± 0.01 (n = 5) | 0.80 ± 0.01 (n = 13) |
| CVfd | 0.17 ± 0.05 (n = 5) | 0.25 ± 0.07 (n = 13) |
| QeEPSC/QmEPSC(scaled)e | 1.35 ± 0.04 (n = 5) | 1.44 ± 0.04 (n = 13) |
| Mc | 191 ± 16 (n = 48) | 194 ± 13 (n = 62) |
| RRP c,f | ||
| 100 Hz | 707 ± 60 (n = 13) | 1246 ± 133 (n = 20) |
| 300 Hz | — | 1261 ± 182 (n = 17) |
| Fc,f | ||
| 100 Hz | 0.30 ± 0.05 (n = 13) | 0.18 ± 0.03 (n = 20) |
| 300 Hz | — | 0.15 ± 0.03 (n = 17) |
| Fg,f | 0.35 ± 0.07 (n = 13) | 0.19 ± 0.07 (n = 20) |
| Release period | ||
| Decay τ (μs)d | 394 ± 17 (n = 5) | 202 ± 11 (n = 9) |
| Decay τ (μs)h,f | 351 ± 95 (n = 5) | 245 ± 20 (n = 7) |
| Half-width (μs)d | 556 ± 54 (n = 5) | 327 ± 13 (n = 9) |
| Peak rate (ms−1)d | 352 ± 81 (n = 5) | 742 ± 94 (n = 9) |
Relative amplitude of the fast decay component;
weighted mean decay time constant τm=afast τfast+aslow τslow, where afast and aslow are the relative amplitudes of fast and slow decay components, respectively;
estimates were obtained from σ2/I analysis corrected by multiplication with  to account for quantal size variability and latency fluctuations of quantal currents (see Methods);
parameters were obtained from time domain deconvolution of eEPSCs with the corresponding mEPSC waveforms;
scaling factor to correct M estimates from eEPSC peak amplitudes (M=QeEPSC/QmEPSC(scaled)I/q);
errors were estimated by bootstrap analysis using 1000 replications;
estimates from paired pulse ratio (PPR) of M1 and M2 during 100 Hz stimulation (see Results);
decay τ of release period was estimates from first latency distribution of eEPSCs in the presence of 20–25 μm CdCl2 (Barrett & Stevens, 1972).
Furthermore, in the presence of quantal latency ‘jitter’, M values derived from QeEPSC/QmEPSC (with QeEPSC and QmEPSC being the eEPSC charge and the mEPSC charge, respectively) will provide a more reliable estimate for the true quantal content than the amplitude ratio I/q. Therefore, we corrected our M estimates from I/q by multiplication with a factor QeEPSC/QmEPSC(scaled), where QmEPSC(scaled) denotes the charge of the mEPSC scaled to the eEPSC peak. The average values of this correction factor were obtained from a subset of synapses for each age group (Table 1).
Estimating release probability and quantal content from skewness
The skewness (ξ) of a distribution is derived from the second and third moments about the mean:
| (10) |
The skewness represents a measure of the degree of asymmetry and, for a binomial distribution, is related to the parameters p and N according to:
| (11) |
Thus, even without knowing N, analysing the skewness provides information about the average p: skewness will be zero at the peak of the variance–mean parabola (p= 0.5) indicating a symmetrical shape of the amplitude distribution. ξ is positive for p > 0.5 and smaller than zero for p < 0.5 (for negative EPSC amplitudes according to electrophysiological conventions).
For p≪ 1, eqn (12) simplifies to:
| (12) |
and, thus, provides another estimate for the quantal content under these conditions:
| (13) |
Results
Developmental profile of the quantal parameters q and M
To determine the developmental profile of quantal size and quantal content during maturation of the calyx of Held, we analysed spontaneously occurring mEPSCs and amplitude fluctuations of EPSCs evoked by fibre stimulation using discrete ensemble fluctuation analysis (Silver et al. 1998; Scheuss & Neher, 2001; see Methods).
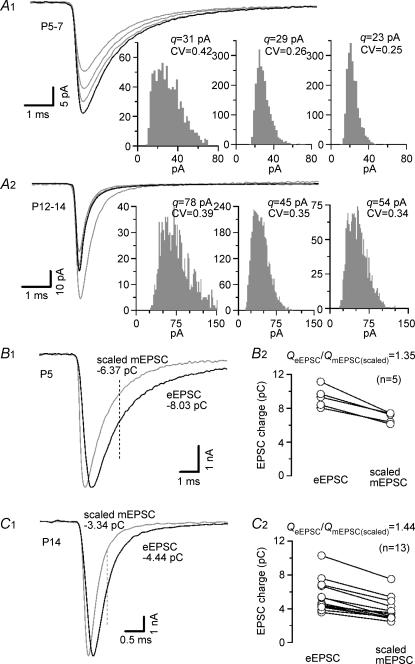
Figure 1A exemplifies mEPSC recordings from principal MNTB neurones at P5–7 (Fig. 1A1) and P12–14 (Fig. 1A2) illustrating variability of the quantal current waveforms and amplitude distributions between different synapses at a given age. For both age groups, average mEPSC waveform (grey traces) together with the corresponding amplitude histograms of three example cells are displayed. The black traces in Fig. A1 and A2 represent average mEPSC waveforms for all synapses studied at the respective age. At P12–14 mEPSC were consistently larger (p < 0.01, Student's t test), had faster rise times (p < 0.0001) and more rapid decay kinetics (p < 0.0001) compared with P5–7. Average values for the fast and slow time constants of the mEPSC decay, mEPSC peak amplitudes and their CV (Table 1) were similar to those reported by others (Sahara & Takahashi, 2001; Koike-Tani et al. 2005).
Figure 1. Analysis of spontaneous mEPSCs.
A, examples of average mEPSC waveforms (left, grey traces) and amplitude distributions (right) for three different synapses recorded at P5–7 (A1) and P12–14 (A2) (Vh=−70 mV, 2 mm Ca2+, 1 mm Mg2+). Mean values for q and CVq are given for each cell above the histograms. On average, 1090 ± 282 (P5–7, n = 10) and 1524 ± 260 (P12–14, n = 19) events per cell were analysed. Average mEPSCs waveforms of all synapses tested in each age group (P5–7, n = 10; P12–14, n = 19) are superimposed for comparison (left, black traces). During development the mEPSC kinetics accelerated and q increased slightly but CVq remained nearly unchanged. B, as a result of the temporal dispersion of release the quantal content is substantially underestimated when eEPSC peaks are divided by quantal amplitudes. To obtain correction factors, average mEPSCs were peak scaled to the eEPSCs and the charge transfer up to the 50% decay time of the eEPSCs (dashed lines in B1 and C1) was compared (B1 and C1 sample traces, B2 and C2 summary results for several synapses). The charge transfer of eEPSCs was found to be > 35% and > 44% larger than that of peak scaled mEPSCs for P5–7 (B) and P12–14 (C) synapses, respectively.
Because of the temporal dispersion of release events, the time course of individual quanta is faster than that of eEPSCs and not all quanta contribute equally to the eEPSC peak (Diamond & Jahr, 1995; Isaacson & Walmsley, 1995; Borst & Sakmann, 1996; Quastel, 1997). Figure 1B1 and C1 compare eEPSCs and mEPSCs scaled to eEPSC peak in a P5 (Fig. 1B) and a P14 (Fig. 1C) synapse to illustrate this point. Evidently, the time course of putative mono-quantal mEPSCs is more rapid than that of eEPSCs, which are composed of hundreds of quanta. In the presence of quantal latency ‘jitter’, M values derived from I/q (see below) will underestimate the true quantal content. This applies especially for rapidly decaying quantal currents because early quanta do not contribute with their full quantal size. Furthermore, late quanta do not contribute at all to the eEPSC peak. To compensate for the effect of temporal dispersion of release on M estimates from I/q, we obtained correction factors by comparing the charge transfer of eEPSCs (QeEPSC) with that of peak scaled mEPSCs (QmEPSC(scaled), Fig. 1B2 and C2). Both EPSC waveforms were integrated up to the half-decay time point of the eEPSCs to minimize the contribution of late asynchronous release. On average, QeEPSC was > 30% larger than QmEPSC(scaled) (Table 1) suggesting that M is significantly higher than the value I/q at the calyx of Held synapse (Borst & Sakmann, 1996).
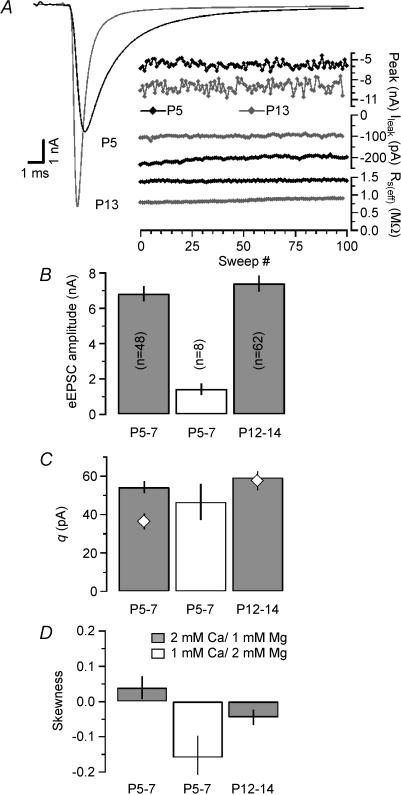
Discrete ensemble fluctuation analysis for single eEPSCs is summarized in Fig. 2. Typical experiments in a P5 and a P13 synapse are shown in Fig. 2A which depicts average waveforms and amplitude fluctuations for 100 consecutive single eEPSCs recorded at an inter-stimulus interval of 15 s. During development, the average eEPSC peak amplitudes grew slightly (Fig. 2A, Table 1), but this increase was statistically not significant (p > 0.05). Average q estimates derived from σ2/I underwent a developmental increase similar to those derived from mEPSCs, although for immature synapses, the absolute values were slightly higher than the average mEPSC amplitudes (Table 1). Using the average values for eEPSC amplitudes and quantal size, it follows that single APs release ∼200 quanta under control conditions (after correction of M for temporal dispersion of release as described above; Table 1).
Figure 2. Quantal parameters estimated by discrete ensemble fluctuation analysis of single eEPSCs.
A, representative recordings from a P5 (black traces) and a P13 synapse (grey traces). One hundred eEPSCs were evoked by afferent-fibre stimulation at a holding potential of −70 mV (2 mm Ca2+, 1 mm Mg2+) and an interstimulus interval of 15 s. Left, average EPSC waveforms. Stimulus artifacts blanked for clarity. Right, fluctuation of the eEPSC peak amplitudes (top traces). Leak current (middle traces) and effective series resistance (residual series resistance remaining after online compensation, bottom traces) were monitored to ensure stability. Estimates for q derived from σ2/I were 39 pA (P5) and 74 pA (P13) for the illustrated examples. B and C, average values for eEPSC amplitudes (B) and q (C) obtained in P5–7 (left and middle columns) and P12–14 (right columns) calyx of Held synapses. All q estimates from σ2/I analysis (C) were corrected for inter- and intra-site variability and dispersion of quantal release. Number of synapses is given in each column in B. Quantal size estimates from mEPSC analysis (Fig. 1) are shown in C for comparison (⋄). To validate the assumption of p≪ 1, σ2/I analysis was additionally performed at lowered external Ca2+ in immature synapses (middle columns). As expected, eEPSC amplitudes and M decreased but q estimates for low p conditions were similar to those under control conditions. D, the skewness of the peak eEPSC amplitude distributions (μ3/μ23/2 where μ3 and μ2 are the third and second moments of the distributions) was measured to approximate p. At P5–7, skewness was > 0. Reducing p as well as developmental maturation of the synapses led to skewness < 0 indicating lower p under those conditions.
Estimating q from σ2/I is a valid approach under the assumption that p is relatively low. This condition may not be met at P5–7 (Iwasaki & Takahashi, 2001; Taschenberger et al. 2002). To validate our q estimates from σ2/I, we additionally performed variance–mean analysis at lowered external Ca2+ (1 mm Ca2+, 2 mm Mg2+) in a subset of eight P5–7 synapses. Mean eEPSC amplitudes decreased under these conditions to 1.44 ± 0.30 nA (n = 8), but q estimates were relatively stable (46 ± 9 pA, Fig. 2B and C). In fact, the average q value obtained in low Ca2+ was closer to the mean mEPSCs amplitudes at that age than the one obtained in 2 mm Ca2+ (Table 1).
Decrease of release probability during development
The fraction of quanta released by single APs (F), represents a measure of the average release probability for the total population of available quanta (Liley & North, 1953; Betz, 1970). Previous attempts to estimate F at the calyx of Held have relied on information about the total number of releasable vesicles which proved to be a difficult parameter to estimate (Schneggenburger et al. 1999; Wu & Borst, 1999; Sun & Wu, 2001). Here we tried an alternative approach to estimate release probability: We calculated the skewness from eEPSC amplitude distributions for P5–7 (for control as well as low-Ca2+ conditions) and P12–14 calyx of Held synapses (Fig. 2D). With 2 mm external Ca2+, we obtained ξ > 0 in P5–7 synapses suggesting an average p > 0.5 at this age. When we reduced external Ca2+ or recorded from more mature synapses, ξ was < 0 suggesting an average p < 0.5. These results are, thus, consistent with a developmental reduction of the release probability. Using eqn (13) we obtained M= 54 for P5–7 synapses in low external Ca2+, which agrees reasonably with M= 41 derived from corrected I/q. However, M estimates according to eqn (13) are unlikely to be more reliable than values derived from the variance and mean because the estimation of skewness is intrinsically more noisy than that of variance (Scheuss & Neher, 2001).
Transient changes in q and M during short eEPSC trains in immature versus mature synapses
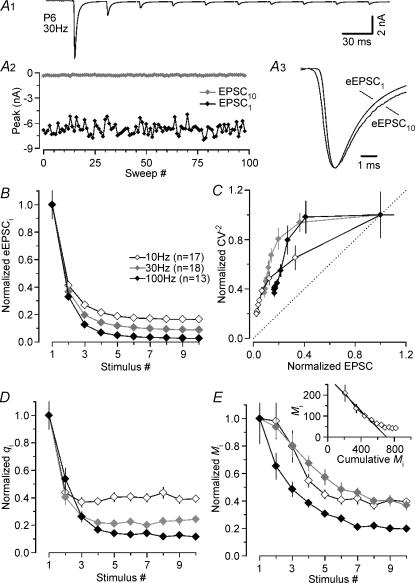
Next, we studied amplitude fluctuations of successive peaks in eEPSC trains to compare transient changes of q and M during repetitive stimulation in P5–7 and P12–14 synapses (Scheuss et al. 2002). Our trains generally consisted of 10 stimuli and the range of tested frequencies included 10, 30 and 100 Hz (P5–7) and 10, 30, 100 and 300 Hz (P12–14). 100 Hz and 300 Hz were the maximum frequencies at which eEPSCs could be reliably evoked in P5–7 and P12–14 synapses, respectively. Figure 3A illustrates a typical example for a P6 synapse stimulated at 30 Hz. The average eEPSC train is shown (Fig. 3A1) together with amplitude fluctuations for eEPSC1 and eEPSC10 (Fig. 3A2). In this synapse, q decreased by almost 90% during the train. Closer inspection of the eEPSC waveforms revealed slightly slower rise and decay kinetics for eEPSC10 when compared with that of eEPSC1 (Fig. 3A3) (Brenowitz & Trussell, 2001), which is possibly attributable to a slight broadening of presynaptic APs (Habets & Borst, 2005).
Figure 3. Prominent decrease in quantal size during fibre-stimulation evoked EPSC trains in immature calyx of Held synapses.
A, average eEPSC waveform (A1, stimulus artifacts blanked for clarity) and peak amplitude fluctuations of first (EPSC1, black trace) and last (EPSC10, grey trace) synaptic response in the train (A2), from a representative recording in a P6 synapse (30 Hz, 15 s inter-stimulus interval, Vh=−70 mV, 2 mm Ca2+, 1 mm Mg2+). In this cell, qi decreased from 58 to 6 pA for EPSC1 and EPSC10, respectively. A3, average waveforms for eEPSC1 and eEPSC10 shown superimposed on an expanded time scale and after scaling to the same peak amplitude. Before averaging, eEPSCs were aligned at their rising phase to account for fluctuations in the timing of presynaptic APs. Rise and decay of eEPSC10 are slightly slower when compared with those of eEPSC1, presumably attributable to a slight broadening of presynaptic APs during trains. B, normalized average values for eEPSC peak amplitudes during trains evoked at various stimulus frequencies (white symbols: 10 Hz, n = 17; grey symbols: 30 Hz, n = 18; black symbols: 100 Hz, n = 13). C, CV−2 analysis is consistent with a reduction in qi during eEPSC trains as indicated by data points above the identity line (dashed line). D and E, normalized average q values (D) and M values (E) from σ2/I analysis of eEPSC trains shown in B. Note the rapid and pronounced reduction in qi to ∼40% of control even at the lowest stimulus frequency (D, white symbols). Inset in E, a lower limit of the size of the readily releasable pool was obtained from the 100 Hz depression curve. The extrapolated line fit to the first 5 eEPSCs in the Miversus cumulative Mi plot (Elmqvist & Quastel, 1965) yielded an estimate of 707 ± 60 quanta.
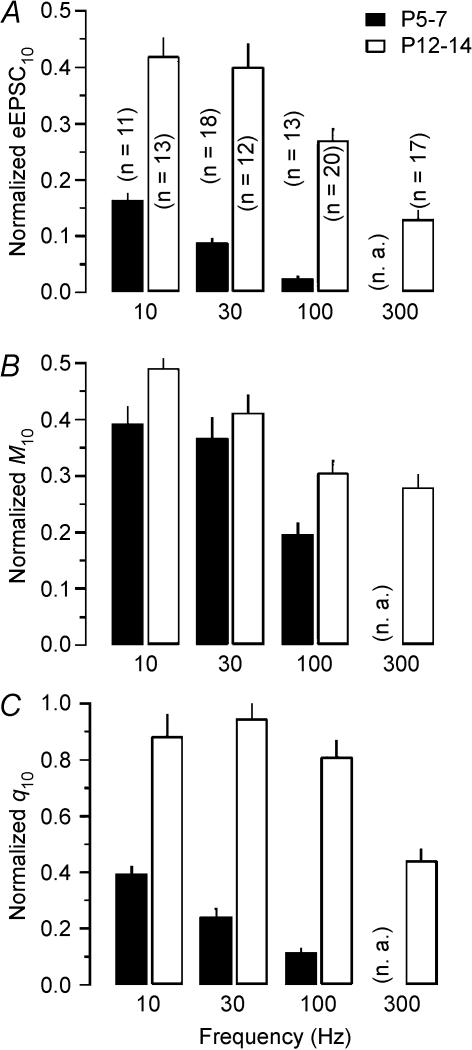
Average data are summarized in Fig. 3B–E. During trains peak amplitudes of eEPSC decreased in a frequency-dependent manner (10 Hz: from 6.63 ± 0.68 to 1.09 ± 0.07 nA; 30 Hz: from 6.73 ± 0.59 to 0.59 ± 0.04 nA; 100 Hz: from 7.19 ± 0.72 to 0.18 ± 0.02 nA; Figs 3B and 5A) (von Gersdorff et al. 1997; Taschenberger & von Gersdorff, 2000; Iwasaki & Takahashi, 2001). CV−2 analysis (Fig. 3C; Faber & Korn, 1991) is consistent with the assumption that at least part of the observed synaptic depression was attributable to a transient reduction in q, most likely because of postsynaptic desensitization (Otis et al. 1996a; Scheuss et al. 2002). The decline of q during stimulus trains was more severe at higher frequencies. However, even at the lowest stimulation frequency tested (10 Hz), q was reduced by more than 60% after 10 stimuli. The average reduction for q10 increased to 88% at 100 Hz (Figs 3D and 5C). Interestingly, the quantal size estimate for eEPSC2 (q2) was smaller at lower stimulus frequencies (10 or 30 Hz) compared with that at 100 Hz stimulation possibly because of the time required for the equilibration of released glutamate within the synaptic cleft and subsequent desensitization of postsynaptic receptors (Fig. 3D).
Figure 5. Comparison of pre- and postsynaptic contributions to steady state depression during train stimulation at the developing calyx of Held synapse.
Filled bars: immature synapses (P5–7) were stimulated using 10, 30 and 100 Hz trains. Open bars: more mature synapses (P12–14) were stimulated using 10, 30, 100 and 300 Hz trains. A, normalized steady state eEPSC amplitudes (eEPSC10) plotted versus stimulation frequency at P5–7 (eEPSC10= 0.165 ± 0.011, 0.088 ± 0.007 and 0.025 ± 0.002 for 10, 30 and 100 Hz, respectively) and P12–14 (eEPSC10= 0.420 ± 0.032, 0.401 ± 0.039, 0.271 ± 0.019 and 0.131 ± 0.014 for 10, 30, 100 and 300 Hz, respectively). Number of synapses tested is given in parenthesis (n.a., not available). B, normalized steady state M values (M10) plotted versus stimulation frequency at P5–7 (M10= 0.394 ± 0.028, 0.368 ± 0.035 and 0.198 ± 0.018) and P12–14 (M10= 0.492 ± 0.059, 0.413 ± 0.029, 0.306 ± 0.020 and 0.280 ± 0.022). C, normalized steady state q values (q10) plotted versus stimulation frequency at P5–7 (q10= 0.393 ± 0.027, 0.244 ± 0.027 and 0.116 ± 0.012) and P12–14 (q10= 0.885 ± 0.074, 0.947 ± 0.049, 0.811 ± 0.058 and 0.442 ± 0.039). Note the pronounced reduction in quantal size for stimulus frequencies ≥ 300 Hz in P12–14 synapses.
Knowing the average qi for each train response allowed us to calculate the corresponding mean quantal content (Mi). Since a large part of synaptic depression could be ascribed to a decreasing qi, the reduction of Mi during trains was slower and less complete than the depression of eEPSC amplitudes (compare Fig. 3B with 3E and Fig. 5A with 5B). During 100 Hz trains, Mi decreased from M1= 209 ± 38 to M10= 41 ± 4 quanta. Assuming constant quantal size throughout the 100 Hz trains (q1=q10), we would arrive at a much lower M10 estimate of only 5 quanta. If p is gradually reduced during 100 Hz trains, presumably because of a decreased occupancy of release sites after vesicle depletion, we may, for comparison, estimate Mi for late eEPSCs also from skewness according to eqn (13) which yielded M10= 58 quanta. Figure 5 summarizes the average pre- (decline in M) and postsynaptic (decline in q) contributions to depression of steady state eEPSCs at different stimulation frequencies in immature synapses.
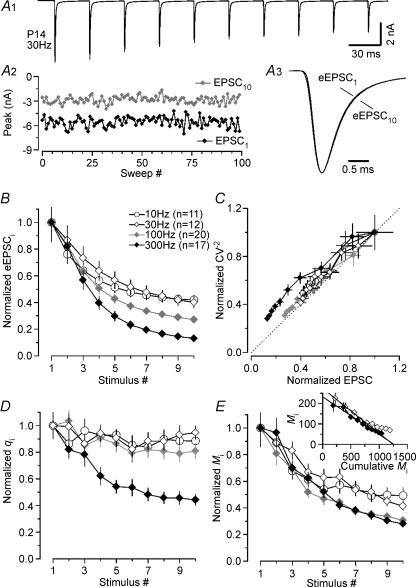
Evidence derived from experiments using various pharmacological approaches suggested reduced susceptibility of more mature synapses to receptor desensitization (Joshi & Wang, 2002; Taschenberger et al. 2002). With the experiments summarized in Fig. 4 we therefore tested if discrete ensemble fluctuation analysis in P12–14 synapses supports such a conclusion. Figure 4A illustrates a representative experiment in a P14 synapse stimulated with 30 Hz trains. In this synapse, similar q values were obtained for eEPSC1 and eEPSC10 (Fig. 4A2). In contrast to the broadening of eEPSC waveforms observed in immature synapses (see Fig. 3A3), the eEPSC kinetics remained remarkably stable during short 30 Hz trains in P12–14 synapses (Fig. 4A3) (Brenowitz & Trussell, 2001), which may indicate that more mature terminals are more resistant to AP broadening.
Figure 4. Strongly reduced contribution of postsynaptic factors to synaptic depression at P12–14 compared with immature synapses.
A, average eEPSC waveform (A1, stimulus artifacts blanked for clarity) and peak amplitude fluctuations of first (EPSC1, black trace) and last (EPSC10, grey trace) synaptic responses in the train (A2), from a representative recording in a P14 synapse (30 Hz, 15 s inter-stimulus interval, Vh=−70 mV, 2 mm Ca2+, 1 mm Mg2+). In this cell, q was similar for EPSC1 (62 pA) and EPSC10 (55 pA). A3, average waveforms for eEPSC1 and eEPSC10 shown superimposed on an expanded time scale and after scaling to the same peak amplitude. Before averaging, eEPSCs were aligned at their rising phase to account for fluctuations in the timing of the presynaptic APs. Time course of both eEPSC1 and eEPSC10 is virtually indistinguishable. B, normalized average values for eEPSC peak amplitudes during trains evoked at various stimulus frequencies (white circles: 10 Hz, n = 13; white diamonds: 30 Hz, n = 12; grey diamonds: 100 Hz, n = 20; black diamonds: 300 Hz, n = 17). C, CV−2 analysis suggests a stable qi during trains at ≤ 100 Hz because data points fall onto the identity line (dashed line). D and E, normalized average q values (D) and M values (E) from σ2/I analysis of eEPSC trains shown in B. Quantal size was nearly constant for stimulus frequencies ≤ 100 Hz (C, white and grey symbols) but decreased significantly at 300 Hz (C, black symbols). Inset in E, a lower limit of the size of the readily releasable pool was obtained from 100 and 300 Hz depression curves. The extrapolated line fits to Mi plotted versus cumulative Mi applied to the first 5 eEPSCs yielded similar estimates of 1246 ± 133 and 1261 ± 182 quanta for 100 and 300 Hz stimulation, respectively.
Summary data on synaptic depression in P12–14 synapses for stimulus frequencies of 10, 30, 100 and 300 Hz are shown in Figs 4B–E and 5. The much smaller depression of eEPSCs at this age compared with P5–7 synapses is in line with previous reports (10 Hz: from 6.71 ± 0.75 to 2.82 ± 0.21 nA; 30 Hz: from 7.31 ± 1.07 to 2.93 ± 0.28 nA; 100 Hz: from 7.71 ± 0.61 to 2.09 ± 0.15 nA; 300 Hz, from 7.63 ± 1.02 to 1.00 ± 0.11 nA; Figs 4B and 5A) (Taschenberger & von Gersdorff, 2000; Iwasaki & Takahashi, 2001). CV−2 analysis suggested that depression was mostly presynaptic in origin except for the highest frequency of 300 Hz (Fig. 4C). In P12–14 synapses, q was nearly constant at 10, 30 and 100 Hz but declined significantly at 300 Hz (Figs 4D and 5C). For frequencies ≤ 100 Hz, the depression curves for eEPSC amplitudes and M were similar (compare Fig. 4B with D and Fig. 5A with 5B) and the postsynaptic contribution to synaptic depression was therefore negligible (Fig. 5C). At 300 Hz postsynaptic receptor desensitization contributed significantly to synaptic depression. Estimates for steady state M at the end of 100 and 300 Hz trains using corrected I/q or skewness were again similar (100 Hz: 69 ± 5 versus 93 quanta, 300 Hz: 53 ± 5 versus 58 quanta).
Estimates for RRP and F from eEPSC train data
It is generally assumed that presynaptic depression at the calyx of Held results primarily from depletion of a limited reservoir of releasable quanta and replenishment of this reservoir is negligible during short 100 Hz trains (von Gersdorff et al. 1997; Schneggenburger et al. 1999). With these prerequisites fulfilled, the classical approach of Elmqvist & Quastel (1965) can be applied to approximate the size of the readily releasable pool of vesicles (RRP) from the initial depression rate of the quantal content M during trains. Using M rather than eEPSC amplitudes is necessary because of the postsynaptic contribution to depression, which reduces q. From the depression rate of M during the first 50 ms of 100 Hz trains we estimated a total of ∼710 readily releasable quanta in the immature calyx of Held (Fig. 3E inset, Table 1). It should be noted that a similar analysis based on eEPSC amplitudes rather than Mi (neglecting the decrease in qi) would give an estimate of about one third of this value. The average number of readily releasable quanta in P12–14 terminals was higher (Fig. 4E inset, Table 1). The release fraction F was obtained from dividing M1 by the estimated size of the RRP at the corresponding age. F decreased during development from 0.30 to 0.18 (Table 1). Alternatively, we may approximate F simply from the paired pulse ratio (PPR) of the quantal content of two successive eEPSCs:
 |
If we argue that F1≈F2, which is a common assumption for a simple depletion model (but see Wu & Borst, 1999), this simplifies to: PPR = 1 −F. Using M1 and M2 values as estimated above for the first two responses of 100 Hz trains we arrive at F= 0.35 and F= 0.19 for P5–7 and P12–14, respectively (Table 1).
Postsynaptic desensitization in immature synapses: rapid spill-over versus slow clearance
Having established that qi is severely reduced (∼60–90%) during repetitive stimulation in immature synapses (Fig. 3C), we considered two mechanisms: (i) Released glutamate may rapidly spill over to neighbouring postsynaptic densities (Trussell et al. 1993; Otis et al. 1996b; DiGregorio et al. 2002). Such interactions would most likely be spatially restricted to adjacent receptor clusters provided that glutamate clearance is a relatively fast process and effectively prevents the build up of transmitter during stimulus trains. Desensitization would therefore be most prominent if release occurred at a large fraction of sites whereas at low p a majority of AMPARs would not desensitize.
(ii) Alternatively, if clearance is rather slow, glutamate removal cannot keep up with the rate of release for higher stimulus frequencies. Transmitter will slowly accumulate during stimulus trains (Neher & Sakaba, 2001a) and equilibrate within the entire synaptic cleft. Such residual glutamate may progressively reduce the number of available AMPARs. Eventually, a substantial fraction of all postsynaptic receptors will be desensitized regardless of whether they had been activated by previous release. Reducing external Ca2+ and thereby lowering the fraction of sites at which release occurs would then probably delay the onset of desensitization and retard its time course but such a manipulation may have little effect on the degree of desensitization as a function of the cumulative release (‘release history’).
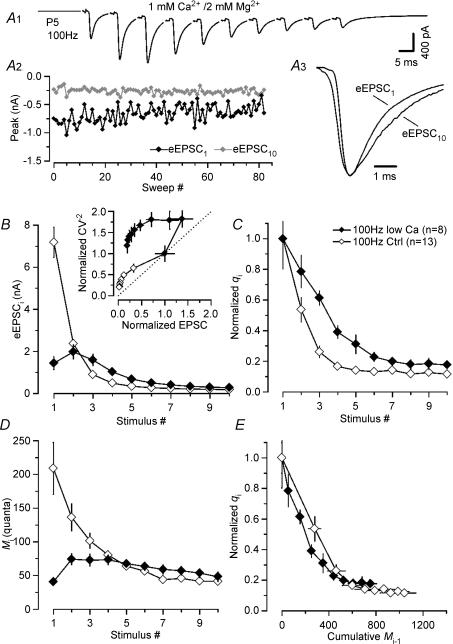
Figure 6 shows that our experimental results are more compatible with the second scenario. A P5 synapse was stimulated at 100 Hz using 1 mm Ca2+ and 2 mm Mg2+ in the bath. The initial facilitation during the first three eEPSCs in the train is consistent with the low p under these recording conditions (Fig. 6A1). Peak eEPSC amplitude fluctuations are shown in Fig. 6A2. Again, we noticed a slightly slower kinetics of eEPSC10 when compared with that of eEPSC1 (Fig. 6A3) similarly as described above for 30 Hz stimulation of immature synapses. Synaptic depression during trains was still severe despite strongly reduced eEPSC1 and, more importantly, qi decreased from q1= 29 pA to q10= 8 pA (Fig. 6A2). Figure 6B compares synaptic depression of 100 Hz trains under control conditions and with low external Ca2+. CV−2 analysis indicated postsynaptic changes under both conditions (Fig. 6B, inset). In fact, the relative decrease of q10 was comparable for control and low Ca2+ (Fig. 6C), presumably as a result of the similar quantal content for eEPSCs10 under both conditions (normal Ca2+: M10= 41 ± 4 quanta, q10= 11.6 ± 1.2%; low Ca2+: M10= 48 ± 7 quanta, q10= 17.6 ± 2.4%) (Fig. 6D). Thus, reducing initial quantal content M1 from 209 ± 38 to 41 ± 4 by lowering external Ca2+ affected the degree of desensitization at steady state much less than reducing the stimulus frequency from 100 to 10 Hz (see above).
Figure 6. Postsynaptic AMPAR desensitization is delayed but not eliminated at low p.
A, average eEPSC waveform (A1) and peak amplitude fluctuations of first (EPSC1, black trace) and last (EPSC10, grey trace) synaptic responses of a 100 Hz train (A2), recorded in a P5 synapse (Vh=−70 mV, 1 mm Ca2+, 2 mm Mg2+). Despite the strongly reduced eEPSC amplitudes, qi decreased during the train from an initial value of 29 pA (eEPSC1) to 8 pA (eEPSC10). A3, average waveforms for eEPSC1 and eEPSC10 shown superimposed on an expanded time scale and after scaling to the same peak amplitude. Before averaging, eEPSCs were aligned at their rising phase. Rise and decay of eEPSC10 are slightly slower than those of eEPSC1. B and C, averaged eEPSC peak amplitudes (B) and normalized qi (C) for 100 Hz trains in immature calyx synapses at normal (♦) and reduced external Ca2+ (⋄). Note the slower time course of desensitization but similar steady state reduction of q. Inset in B, CV−2 analysis is consistent with a reduction in qi during trains under both control conditions as well as reduced p as indicated by data points above the identity line (dashed line). D, comparison of Mi during 100 Hz trains in normal and low Ca2+. E, normalized qi plotted as a function of ‘release history’ (cumulative release Mi1). qi decreased with a similar rate of ∼0.2/100 released quanta for 100 Hz trains under control as well as low p conditions.
When qi was plotted as a function of ‘release history’ (cumulative release Mi-1 preceding the ith eEPSC in the train, Fig. 6E), it declined with a similar rate of approximately −0.2/100 released quanta under control as well as low-Ca2+ conditions. In other words, qi was reduced to a similar degree after two APs in normal Ca2+ (cumulative release of 345 quanta) or after five APs in low Ca2+ (cumulative release of 329 quanta) namely to 26 and 23% of q1.
Slow recovery from desensitization after synaptic glutamate release in immature synapses
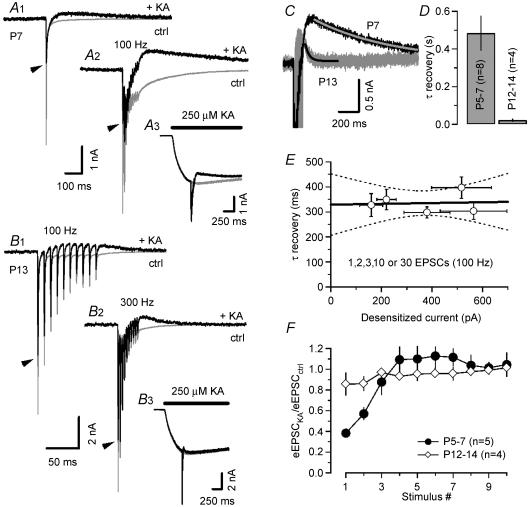
In order to measure the time course of recovery from desensitization caused by synaptic glutamate release, we performed cross-desensitization experiments using kainic acid (KA), a non-desensitizing AMPAR agonist (Fig. 7). Assuming that exogenously applied KA and synaptically released glutamate activate overlapping receptor populations, KA-induced whole-cell current responses (IKA) should be transiently reduced after eEPSCs because of receptor desensitization following synaptic glutamate release (Otis et al. 1996a).
Figure 7. Recovery of synaptic AMPARs from desensitization is substantially accelerated in more mature synapses.
A, eEPSCs at Vh=−70 mV were evoked in a P7 synapse using a single stimulus (A1) and a 100 Hz train (A2) under control conditions (grey trace) and in the presence of 250 μm puff-applied kainate (black trace). KA responses without synaptic stimulation (A3, grey trace) were subtracted from raw traces (A3, black trace) to measure the blocked current fraction of IKA attributable to desensitization of AMPARs by synaptically released glutamate (black traces in A1 and A2). B, similar experiment as illustrated in A in a P13 synapse using 100 Hz (B1) and 300 Hz (B2) trains. Control traces plotted in grey. Black traces were obtained after subtracting kainate responses without synaptic stimulation (B3). Note the faster time scale in B compared with A. Peak amplitudes of eEPSC recorded in the absence of KA are indicated by the arrowheads in (A1 and 2) and (B1 and 2). C, superposition of the difference currents for the cells shown in A and B to facilitate comparison. D, recovery of synaptic AMPARs from desensitization after short 100 Hz trains was significantly slower in immature synapses. The time course was well approximated with single exponentials (C, superimposed smooth curves) having mean time constants of 484 ± 90 ms (P5–7, n = 8) versus 21 ± 6 ms (P12–14, n = 4). E, in immature synapses, the recovery from desensitization is independent of the amount of released glutamate. The blocked fraction of IKA increased from 159 ± 45 to 517 ± 119 pA when the number of stimuli was increased from 1 to 30 (100 Hz). This was not accompanied by a significant slow down of the recovery from desensitization (pr= 0.071, n = 5). F, ratio of eEPSC amplitudes in the presences and absence of puff-applied KA. Note that in immature synapses, the first two eEPSCs were significantly smaller when evoked on top of IKA.
Patch pipettes filled with 250 μm KA were placed in the proximity of principal MNTB neurones and IKA was recorded during puff application of the agonist (300 ms duration). Two such experiments in a P7 (Fig. 7A) and a P13 (Fig. 7B) synapse are exemplified in Fig. 6A and B. Responses with afferent-fibre stimulation during IKA (Fig. 7A3 and B3, black traces) were then subtracted from traces without fibre stimulation (Fig. 7A3 and B3, grey traces) to reveal the current component that was blocked by desensitization. Control eEPSCs in the absence of IKA are superimposed for comparison. A transient reduction of IKA that recovered slowly over hundreds of milliseconds was already observed after evoking single eEPSCs in the P7 synapse (seen as outward current in the difference trace in Fig. 7A1). After stimulation with trains (10 stimuli, 100 Hz), the amount of block increased, but the time course of recovery remained similar (Fig. 7A2).
In more mature synapses the blocked current fraction was too small to be reliably observed after single stimuli. Therefore the synapse in Fig. 7B was stimulated with trains at 100 Hz (Fig. 7B1) and 300 Hz (Fig. 7B2). At P12–14, the blocked current fraction recovered significantly faster compared with the P7 synapse as illustrated in Fig. 7C where both traces were superimposed. Average τrecov values were 484 ± 90 ms (P5–7, n = 8) and 21 ± 6 ms (P12–14, n = 4). A likely mechanism for this shortening of τrecov is suggested by the morphological changes, which take place between P5 and P14, when the immature cup-shaped terminal develops fenestrations and breaks up into finger-like structures (Kandler & Friauf, 1993).
The good fit of the recovery time course by an exponential, together with the fact that the time constant τrecov of that exponential decreased during development, prompted us to explore possible causes for this behaviour. Therefore, we investigated how the recovery of IKA depends on the strength and duration of the preceding stimulation in five P5–7 synapses. As discussed in detail below, such information can give important hints regarding the geometry of the synaptic cleft. We varied the amount of released glutamate by increasing the number of stimuli from 1 to 2, 3, or 10–30 (100 Hz). This led to an increasing peak amplitude of the blocked current from 159 ± 45 to 517 ± 119 pA (measured ∼50 ms after the end of the stimulation) but did not affect the recovery time constant (Fig. 7E).
Interestingly, the peak eEPSC amplitudes during 100 Hz trains evoked in P12–14 synapses in the presence of exogenous KA were on average only slightly smaller than those recorded in the absence of KA (Fig. 7F). This is the expected behaviour if one postulates that synaptic AMPARs are far from saturation (Liu et al. 1999; McAllister & Stevens, 2000; Ishikawa et al. 2002). In immature synapses, however, only the late eEPSCs had similar amplitudes under both conditions whereas eEPSC1 and, to a lesser extent, eEPSC2, were significantly smaller during KA application compared with control. This observation is consistent with the assumption that EPSC1, but not the later eEPSCs, saturated postsynaptic AMPARs when evoked on top of IKA. This may indicate that AMPAR occupancy was higher for eEPSC1 and decreased thereafter during trains in immature synapses. Higher AMPAR occupancy at the beginning of the stimulus train may arise from higher peak glutamate concentrations because of glutamate pooling between neighbouring release sites (Trussell et al. 1993) or multivesicular release (Auger et al. 1998; Wadiche & Jahr, 2001). In more mature synapses, the AMPAR occupancy appeared to be unchanged during trains.
Differential depression of NMDA and AMPA eEPSCs in immature but not mature synapses
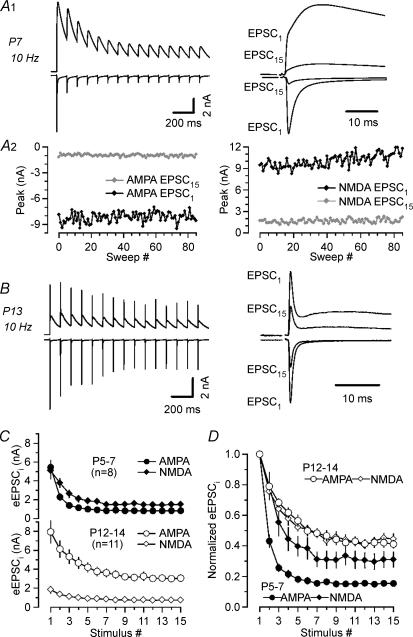
Our observation that synaptic AMPARs desensitize even during 10 Hz stimulation (Figs 3D and 5A1) was unexpected because previous experiments in P8–10 synapses suggested that low-frequency depression is solely attributable to vesicle depletion (von Gersdorff et al. 1997). We therefore sought to confirm our finding by comparing synaptic depression of AMPA and NMDA eEPSC trains in individual synapses. Since NMDARs desensitize more slowly and less completely than AMPARs, we expected qi to decrease less pronouncedly for NMDA eEPSC trains. Consequently, the two eEPSCs components should depress differentially during 10 Hz trains in immature synapses in which desensitization contributes significantly to depression. In contrast, both AMPA (eEPSCAMPA) and NMDA (eEPSCNMDA) eEPSC components should depress in parallel in P12–14 synapses because depression is almost exclusively presynaptic for stimulation frequencies ≤ 100 Hz at this age.
Figure 8 illustrates such experiments: a P7 synapse (Fig. 8A) and a P13 (Fig. 8B) synapse were stimulated using 10 Hz trains consisting of 15 stimuli. AMPA and NMDA eEPSCs were recorded at −70 and +35 mV, respectively. eEPSC1 and eEPSC15 were superimposed and shown on an expanded timescale for comparison. The smaller eEPSCNMDA in more mature synapses was in agreement with previous reports (Taschenberger & von Gersdorff, 2000; Joshi & Wang, 2002). Ensemble fluctuation analysis (Fig. 8A2) confirmed the hypothesized smaller qi reduction for eEPSCNMDA compared with eEPSCAMPA for the immature synapse shown in Fig. 8A1. Figure 8C depicts average depression curves. In Fig. 8D they were normalized to the first peak amplitudes of the eEPSC trains. At P5–7 the onset of depression was clearly faster for eEPSCAMPA trains. Amplitudes of the second and third eEPSCAMPA were reduced to 43 ± 4 and 26 ± 2%, respectively, of the initial value (n = 8). In contrast, amplitudes of the second and third eEPSCNMDA amounted to 79 ± 9 and 55 ± 9%, respectively, of the corresponding initial value. In addition, there was also a clear difference in the steady state depression level of eEPSCAMPA(eEPSC15= 15 ± 2%)versus eEPSCNMDA(eEPSC15= 31 ± 5%) at P5–7. In more mature synapses on the other hand, both time course and degree of depression were indistinguishable for eEPSCAMPA (eEPSC2= 79 ± 3%, eEPSC3= 68 ± 3% and eEPSC15= 41 ± 3% of the initial amplitude) and eEPSCNMDA (eEPSC2= 76 ± 2%, eEPSC3= 64 ± 2% and eEPSC15= 44 ± 3% of the initial amplitude. These data are thus consistent with a prominent contribution of postsynaptic receptor desensitization even at a low frequency stimulation in P5–7 synapses and a reduction of its role during postnatal maturation.
Figure 8. AMPA and NMDA eEPSC trains depress differentially in immature synapses.
A and B, comparison of 10 Hz trains (15 stimuli) of AMPA and NMDA eEPSCs recorded at Vh−70 mV and +35 mV, respectively, in a P7 (A1) and a P13 (B) calyx of Held synapse. First and last synaptic responses are shown superimposed on an expanded time scale for comparison (right) A2, discrete ensemble fluctuation analysis of AMPA and NMDA eEPSC components of the immature synapses shown in A1. For AMPA EPSCs (left), qi decreased from 30 to 13 pA during the 10 Hz train whereas qi remained almost constant for NMDA eEPSCs (right, 40 versus 36 pA). C, AMPA (circles) and NMDA (diamonds) eEPSC depression curves for P5–7 and P12–14 synapses. (Baselines for NMDA eEPSCs were determined from the extrapolation of exponential fits to the decay of the preceding responses.) D, same data as shown in C but amplitudes were normalized to the peak of the first eEPSCs of the trains to facilitate comparison. Note the similar time course and extent of depression for AMPA and NMDA eEPSC at P12–14 (white symbols) but different steady state depression levels in immature synapses (P5–7, black symbol).
Developmental profile of the kinetics of action potential-evoked phasic release
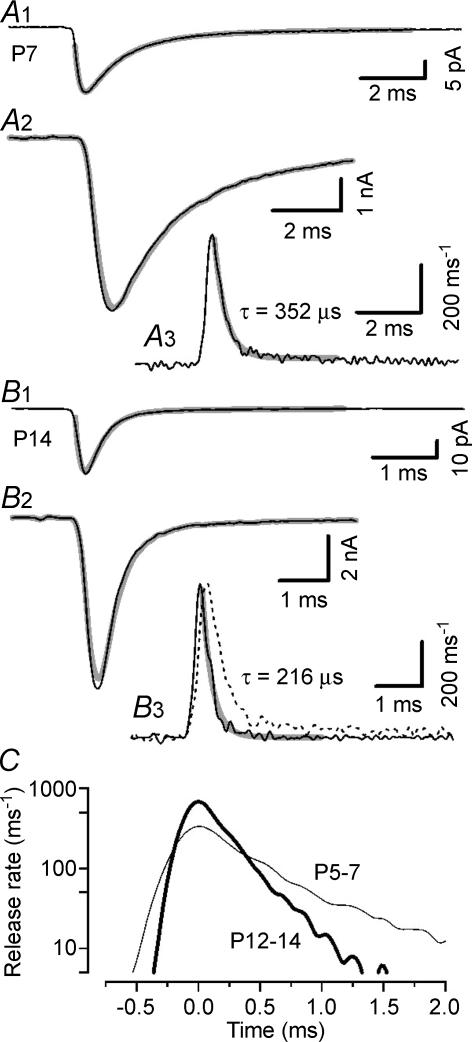
Characteristic features of the developing calyx of Held synapses are a shortening of the presynaptic AP waveform and a more efficient coupling between Ca2+ influx and exocytosis in more mature terminals (Taschenberger & von Gersdorff, 2000; Taschenberger et al. 2002). Both changes are expected to affect the time course of AP-evoked phasic release. We therefore investigated possible changes in the release time course by applying a time-domain deconvolution analysis as described by Neher & Sakaba (2001a) except that the residual glutamate current was assumed to be negligible. This seems a reasonable assumption for single, AP-evoked eEPSCs. Figure 9 illustrates two representative experiments in a P7 (Fig. 9A) and a P14 (Fig. 9B) synapse. For each synapse, amplitude and time course of the quantal responses were estimated from triple exponentials fitted to average mEPSC waveforms (Fig. 9A1 and B1). These parameters were then used to deconvolve the mEPSCs from the eEPSC waveforms of the same synapse (Fig. 9A2 and B2) yielding the time courses of quantal release (Fig. 9A3 and B3). For comparison the re-convolved eEPSC waveform is shown superimposed on the eEPSCs in Fig. 9A2 and B2. Except for a small deviation around the peak, the two waveforms were indistinguishable. As shown in Fig. 9C, the release probability function was significantly changed in P12–14 with respect to immature synapses: it peaked at significantly higher values (p < 0.01) and the duration of phasic release became significantly shorter (p < 0.01). On average, peak release rates were > 2 times higher in P12–14 synapses compared with P5–7 (Table 1). Thus, a concomitant increase in the peak release rates seems to compensate for the decrease in mEPSC half-width to produce relatively constant eEPSC peak amplitudes throughout development. The developmental increase in peak rates was accompanied by a significant acceleration of the decay time course of the release function as well as a decrease of its mean half-width (Table 1). Interestingly, the reduction of the duration of glutamate release was virtually identical to that previously reported for the duration of presynaptic APs during the same developmental period (from 564 ± 40 to 334 ± 26 μs, Taschenberger & von Gersdorff, 2000).
Figure 9. Developmental profile of the time course of phasic AP-triggered release at the calyx of Held synapse.
A and B, average mEPSCs (A1 and B1) and eEPSCs (A2 and B2) recorded at Vh=−70 mV in a P7 (A) and a P14 (B) synapse (2 mm Ca2+, 1 mm Mg2+). Triple exponential fits to the mEPSC waveforms (single-exponential rise plus double-exponential decay, overlaid grey curves in A1 and B1) were deconvolved from the eEPSCs using a time-domain deconvolution algorithm to estimate the time course of phasic release (A3 and B3). Time constants were τrise= 160 μs, τfast= 918 μs, τslow= 2.57 ms (A1) and τrise= 110 μs, τfast= 231 μs, τslow= 2.11 ms (B1). Release rates decayed rapidly with exponential time constants of 352 and 216 μs in the P7 and the P14 synapse, respectively (overlaid grey curves in A3 and B3). For comparison, a scaled copy of the release rate of the P7 synapse is shown in B3 (broken line). The convolution of the estimated time course of release with the mEPSC is shown superimposed for comparison in A2 and B2 (grey curves). Note the different time scale in A and B. C, comparison of the average time course of release of P5–7 (thin line, n = 5) and P12–14 (thick line, n = 9) synapses. Time constants of exponential fits to the release decay are given in Table 1.
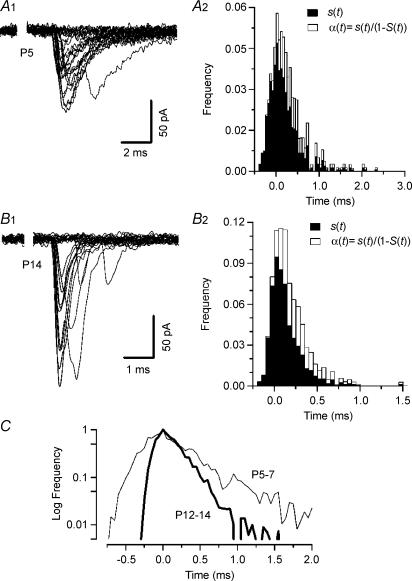
The deconvolution analysis presented in Fig. 9 was performed under the assumption that a contribution of residual glutamate to the eEPSC waveform was negligible. To verify that this is a valid assumption we also analysed the frequency distribution of first latencies of quantal eEPSCs recorded in the presence of 20–25 μm CdCl2 (Barrett & Stevens, 1972; Isaacson & Walmsley, 1995) (Fig. 10). Estimates for the release time course obtained by this method were comparable to those obtained by deconvolution analysis (Table 1).
Figure 10. Estimating the kinetics of phasic release from first latency distributions.
A1 and B1, evoked quantal EPSCs in the presence of 25 μm CdCl2 recorded in a P5 (A) and a P14 (B) synapse. At least 40% of all trials failed to evoked postsynaptic responses under these conditions. The average fraction of transmission failures (N0/N) was 0.53 ± 0.05 (n = 5) and 0.51 ± 0.05 (n = 7) for P5–7 and P12–14, respectively. The average quantal content amounted to 0.7 ± 0.1 for both age groups (assuming Poisson statistics: M= ln(N/N0). Release probability was calculated from the first latencies of quantal responses using the method described by Barrett & Stevens (1972). Using their terminology, the release probability at time t is given by α(t) =s(t)/(1 −S(t)), where s(t) represents the probability of a first quantal latency occurring at time t and 1 −S(t) gives the probability that no release has occurred up to time t. A2 and B2, frequency distributions of first latencies (s(t), filled bars) and release probability (α(t), open bars) for the synapses shown in A1 and B1. Note the different time scale in A2 and B2. C, comparison of the average time course of release of P5–7 (thin line) and P12–14 (thick line) synapses. Peaks of the release probability functions were aligned at t= 0 ms and normalized. Time constants of exponential fits to the release decay are given in Table 1.
Characterization of late asynchronous release after prolonged eEPSC trains in mature synapses
At inhibitory as well as excitatory synapses, phasic release triggered by presynaptic APs is often followed by a barrage of asynchronous release events, in particular in response to trains of stimulation. Although the peak rates of asynchronous release vary among different synapses, they usually require hundreds of milliseconds to several seconds to decay back to resting levels (Goda & Stevens, 1994; Cummings et al. 1996; Lu & Trussell, 2000; Oleskevich & Walmsley, 2002). Little is known about asynchronous release at the calyx of Held which is thought to operate primarily as a high-fidelity relay. A shift from a phasic to an asynchronous mode of release may therefore be unfavourable because it may impair the temporal information carried by presynaptic spike trains. On the other hand, postsynaptic desensitization after extended stimulation periods may essentially preclude the detection of asynchronously released quanta in immature synapses because it reduces quantal amplitudes by such a degree that individual quanta can no longer be revealed. In fact, late asynchronous release has previously been analysed in another calyceal synapse primarily to study changes in q following AP-evoked glutamate release (Otis et al. 1996a). For more mature synapses, our data indicated a nearly constant qi during short trains and frequencies ≤ 100 Hz but we did not test whether this holds true also for extended periods of synaptic stimulation.
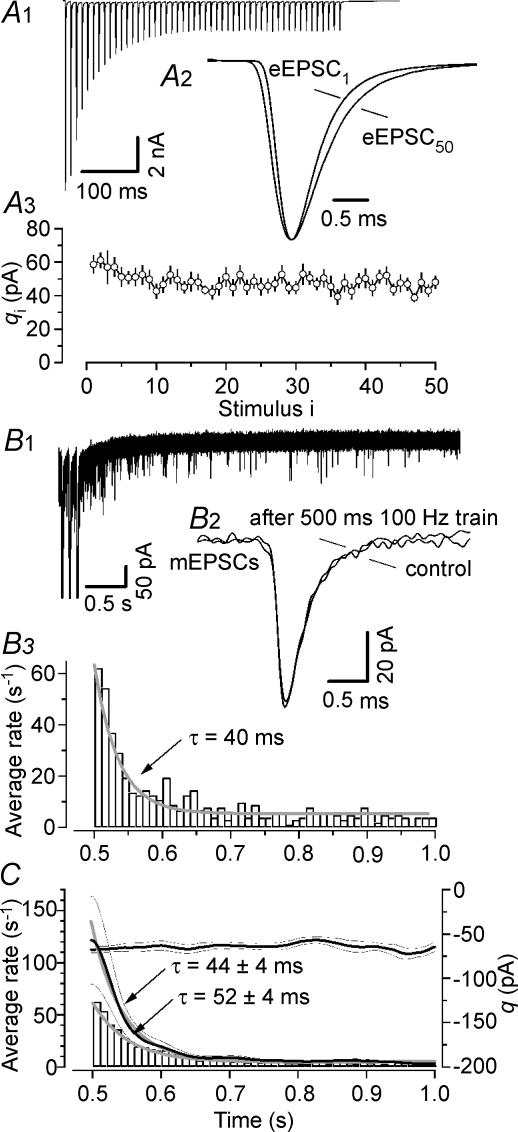
In six P12–14 synapses, using 500 ms long 100 Hz trains (consisting of 50 stimuli, Fig. 11A), we therefore applied discrete ensemble fluctuation analysis and, in addition, analysed asynchronously released mEPSCs immediately after cessation of stimulation using two different approaches: (i) we counted individual quanta by using an automated sliding template algorithm similar to that described by Clements & Bekkers (1997); (ii) we employed continuous ensemble fluctuation analysis as described by Neher & Sakaba (2001b). The data are summarized in Fig. 11. Unlike short 100 Hz train stimuli, such extended periods of 100 Hz stimulation produced a sizable broadening of eEPSC kinetics in P12–14 synapses (Fig. 11A2) similar to that described above for immature synapses when using short 30 or 100 Hz trains (Figs 3A3 and 6A3). On average, the 20–80% rise times increased by ∼36% (from 177 ± 5 to 240 ± 12 μs for eEPSC1 and eEPSC50, respectively) and the mean half-width increased by ∼26% (from 673 ± 34 to 847 ± 45 μs for eEPSC1 and eEPSC50, respectively). In agreement with the data described above (Fig. 4D), qi estimates from σ2/I remained remarkably stable throughout the 500 ms 100 Hz trains (Fig. 11A3). For the analysis of asynchronous release, mEPSCs were captured from baseline recordings before fibre stimulation (control) and as early as 6 ms after the peak of the last eEPSC (eEPSC50). In the synapse depicted in Fig. 11A and B, asynchronous release decreased exponentially with a time constant of ∼40 ms from a peak rate of ∼60 s−1 back to baseline level. In none of the P12–14 synapses tested did we observe a change in the average waveform of mEPSCs recorded before and immediately after fibre stimulation (Fig. 11B2). Data from six experiments are summarized in Fig. 11C. Under resting conditions, the frequency of spontaneously occurring mEPSCs was very low in P12–14 synapses with an average of 2.82 ± 0.36 s−1. This rate was > 20 times elevated (62.6 ± 11.8 s−1) when measured ≥ 6 ms after the peak of eEPSC50 and decayed exponentially with an average time constant of 44 ± 4 ms back to baseline (Fig. 11C) which is > 10-fold faster than previously observed in cultured hippocampal neurones when using an even milder train stimulus (Cummings et al. 1996).
Figure 11. Characterization of late asynchronous release after extended high-frequency stimulation of more mature synapses.
A, phasic release. A1, average waveform of 105 consecutive eEPSC trains evoked in a P14 synapse by afferent-fibre stimulation (100 Hz, 500 ms). A2, average waveforms for eEPSC1 and eEPSC50 shown on an expanded time scale and after scaling to the same peak amplitude. Before averaging, eEPSCs were aligned at their rising phase to account for fluctuations in the timing of the presynaptic APs. Evidently, rise and decay of eEPSC50 are slightly slower than those of eEPSC1. A3, quantal size estimate from fluctuation analysis plotted versus stimulus number. During 500 ms of 100 Hz stimulation q is relatively stable. Average quantal size decreased from q1= 57 ± 9 pA to q50= 48 ± 4 pA (n = 5). B, asynchronous release. B1, initial 30 consecutive single sweeps recorded in the synapse shown in A were superimposed to illustrate transiently elevated rate of asynchronous release immediately after the eEPSC train. Only the last three train responses are shown; eEPSC peaks are truncated for clarity. B2, average waveforms of mEPSCs sampled before stimulation and during a time window of 100 ms immediately after cessation of stimulation were virtually indistinguishable. B3, asynchronous release rate as a function of time for the synapse shown in A and B. Note its fast decay back to resting level. C, summary data from 6 synapses. Under resting conditions, the average frequency of spontaneously occurring mEPSCs was 2.82 ± 0.36 events s−1 at P12–14. The rate increased transiently > 20 times (to 62.65 ± 11.75 events s−1) immediately following 500 ms long 100 Hz trains (histogram). For comparison we estimated the rate of asynchronous release via continuous ensemble fluctuation analysis (Neher & Sakaba, 2001b) which yielded peak release rates that were on average about two times higher than those reported by the template matching algorithm while the decay time constants for the asynchronous release rate were similar with both methods. Thick black lines indicate mean value and thin black lines indicate ± s.e.m. Note that the estimated quantal size was constant throughout the analysis time window.
To identify mEPSCs we used a sliding template mEPSC detection algorithm with a template length of 6 ms. The performance of this algorithm is high for well-separated synaptic events but deteriorates at higher release rates when individual events start to overlap, effectively limiting the maximum detectable release rate to 1/6 e−3 s−1= 167 s−1. In addition to closely spaced mEPSCs which may remain undetected, this method may fail to identify small mEPSCs with amplitudes close to the baseline noise. Thus, an automated ‘counting of quanta’ is likely to underestimate asynchronous release rates. For comparison we therefore also estimated the rate of late asynchronous release by continuous ensemble fluctuation analysis (Neher & Sakaba, 2001b) which yielded maximum rates, that were on average nearly two times higher (121.6 ± 42.2 s−1 at 6 ms after the peak of eEPSC50) than those reported by the template matching algorithm, while the average decay time constant was similar (52 ± 5 ms, Fig. 11C). The advantage of the continuous ensemble fluctuation analysis is the possibility to estimate the mean amplitude of the elementary events as a function of time. Consistent with the data described above, q was found to be constant without any decrease immediately after the end stimulation (Fig. 11C).
How do the average rates for asynchronously released quanta compare to the phasic AP-triggered release? To answer this question, we estimated the average quantal content of eEPSC50 by either discrete ensemble fluctuation analysis or simply by dividing the eEPSC charge by the mEPSC charge. M values obtained with both methods, multiplied with the stimulation frequency, yielded comparable average steady state rates for the phasic release (5.3 ± 0.6 and 7.1 ± 0.6 ms−1). Comparing this value to the peak rate for asynchronous release events as determined above (∼0.063–0.122 ms−1), we can conclude that, even during relatively long periods of intense stimulation, the average rates of phasic release are ≥ 40 times higher than those of asynchronous release measured shortly after the end of the train. With an estimated number of ∼678 active zones (AZs) at the age of P12–14 (Taschenberger et al. 2002) the above steady state rates for the phasic release translates into 8–10 quanta s−1 per AZ.
Discussion
Applying fluctuation analysis to eEPSC trains, we investigated developmental changes in the synaptic parameters quantal size (q), size of the readily releasable pool (RRP) and release fraction (F) as well as the modulation of q during short-term plasticity at the calyx of Held. Quantal size and RRP increased moderately during development, whereas F decreased. During repetitive fibre stimulation of young synapses, q declined rapidly. In more mature synapses, the decrease in q was generally smaller but not negligible for higher stimulus frequencies (300 Hz). The pronounced decline of q in young synapses, even during low-frequency stimulation (10–30 Hz), resulted from a slow recovery of synaptic AMPARs from desensitization presumably as a result of delayed glutamate clearance at this age. Recovery from desensitization required several hundreds of milliseconds in immature synapses but accelerated > 20 times during development.
We further observed changes in the time course of AP-evoked phasic release: peak release rates increased more than 2-fold whereas their half-width decreased during development. After extended high-frequency stimulation of more mature synapses, the rates of asynchronous vesicle release increased transiently > 35-fold but recovered rapidly with an exponential time constant of ∼50 ms back to resting levels. However, the average rates of phasic release measured at steady state were more than an order of magnitude higher than those of asynchronous release measured shortly after the end of the train and exceeded a value of 10 quanta s−1 per active zone at P12–14. These observations are consistent with the unique function of the mature calyx of Held synapse as a reliable and high-fidelity relay.
Quantal size and quantal content estimated by variance–mean analysis
We estimated q by analysing eEPSC amplitude fluctuations during consecutive trials. The σ2/I ratio yields a reliable q estimate only under conditions where p≪ 1. With increasing p, variance–mean ratios will underestimate q. We consider p to be low at the developing calyx of Held under the applied recording conditions because: (1) previous studies demonstrated a > 2-fold increase of eEPSCs when external Ca2+ was elevated (Schneggenburger et al. 1999; Taschenberger et al. 2002); (2) the release fraction F is ≤ 0.35 at any developmental stage (Schneggenburger et al. 1999; Bollmann et al. 2000; Scheuss et al. 2002; Taschenberger et al. 2002; and this study); (3) variance mean plots from data recorded at normal Ca2+ were adequately fitted with simple lines, rather than parabolas as expected for higher p values (not shown); (4) q estimates from σ2/I obtained in P5–7 synapses with low external Ca2+ were comparable to those obtained in normal bath solution.
Because individual quanta are released with some ‘jitter’, the eEPSC peak samples quantal events at different times along their time course. The average contribution f¯ of q to the eEPSC peak amplitude depends on the release time course and the waveform of the quantal event. We found that both the release time course as well as the mEPSC waveform are faster in more mature calyces and we derived equations describing the effect of latency ‘jitter’ on mean and variance of the eEPSC peak. Differences in release time course and mEPSC kinetics did, however, not explain the developmental differences in the quantal size estimates. Our analysis further showed that in the presence of latency ‘jitter’, I/q provides only a lower estimate of M. Applying a correction factor obtained by dividing eEPSC charge by peak scaled mEPSC charge is one way to remedy this.
Estimating the RRP at the calyx synapse
We applied the classical approach of Elmqvist & Quastel (1965) to estimate the size of the readily releasable pool of vesicles from the initial depression rate of the quantal content during 100 Hz trains. This approach is valid because presynaptic depression during such trains results primarily from depletion of vesicles and replenishment is negligible at this stimulation frequency at the calyx of Held (von Gersdorff et al. 1997; Schneggenburger et al. 1999). Using Mi rather than eEPSC amplitudes is important because of the postsynaptic contribution to depression, which reduces qi.
The RRP size represents a lower limit of the number of release sites N in the binomial model (Nsites≥ RRP) since not all sites are necessarily occupied at rest. Reliable estimates for N can, however, only be obtained from σ2/I analysis under conditions where p > 0.5 (Meyer et al. 2001; Scheuss et al. 2002), which were not met in our study.
The observed increase of the RRP size and concomitant decrease of F during maturation correlate with morphological changes. Ultra-structural analysis of a fully reconstructed P9 calyx provided a number of 554 AZs with an average of two docked vesicles per AZ (Sätzler et al. 2002). During postnatal development the number of AZs seemed to grow moderately, whereas the average number of docked vesicles decreased (Taschenberger et al. 2002). With more than one docked vesicle per AZ at the calyx of Held (Sätzler et al. 2002; Taschenberger et al. 2002) the RRP value may represent an upper estimate for the number of active zones (Nsites≥ RRP ≥NAZ), unless some AZs remain silent, because their vesicles are not fusion competent or because of a lack of postsynaptic AMPARs. It should be noted that RRP estimates derived from Cm measurements using prolonged presynaptic depolarizations tend to yield larger values (Sun & Wu, 2001). However, deconvolution analysis of postsynaptic currents evoked by such depleting presynaptic stimuli (Sakaba & Neher, 2001b) uncovered two components with different kinetics of release and recovery. It remains to be shown to which extent these different release components are recruited during AP-evoked release (Trommershäuser et al. 2003).
Slow glutamate clearance at the immature calyx synapse
Analysing the cause for the severe reduction in qi during trains of stimuli at the immature calyx, we found that the relationship between qi and previous release history points towards slow accumulation of glutamate in the synaptic cleft due to delayed clearance, which progressively accumulates AMPARs in a desensitized state. In the absence of a degrading enzyme, transmitter clearance at glutamatergic synapses relies solely on diffusion and uptake. Pre- and postsynaptic transporters seem to be absent from the calyx synapse (Palmer et al. 2003). This leaves diffusion as the only mechanism for the removal of glutamate from the synaptic cleft. Delayed clearance has previously been observed at the parallel fibre input at Purkinje cells (Barbour et al. 1994) and at the chick nucleus magnocellularis (nMAG) synapse (Otis et al. 1996b).
We performed cross-desensitization experiments to monitor the clearance of released glutamate from the synaptic cleft under the assumption that AMPARs recover relatively fast from desensitization after complete glutamate removal. Time constants of recovery from desensitization (τrecov) of native AMPARs are generally < 100 ms (Raman & Trussell, 1995; Angulo et al. 1997; Joshi et al. 2004). In P12–14 synapses, IKA recovered from desensitization caused by synaptically released glutamate with an average τrecov of 21 ms. This is slightly faster than the value measured for the nMAG synapse (τrecov= 53 ms, Otis et al. 1996a) and resembles τrecov of AMPAR currents in patches excised from MNTB neurones of P13–15 mice (28 ms, Joshi et al. 2004) or chick nMAG (16 ms, Raman & Trussell, 1995). For immature synapses however, IKA recovered almost eight times slower than AMPAR currents in patches excised from mouse MNTB neurones of corresponding age (62 ms, Joshi et al. 2004). While we cannot exclude that AMPARs of the immature rat calyx of Held recover unusually slowly from desensitization, it is more likely that the measured τrecov reflects slow clearance of residual glutamate.
The time course of recovery of IKA after synaptic glutamate release was well fitted by an exponential in both age groups. This was unexpected because for diffusion processes one usually observes more complicated time courses and for many geometries the time course of the diffusional relaxation slows down when more time is allowed for the synaptic cleft to fill up. Exponential decays and, particularly, our finding that τrecov was independent of the filling state (Fig. 7E), are more characteristic of a single-compartment situation.
Eccles & Jaeger (1958) already pointed out that the decay of the average neurotransmitter concentration in a synaptic cleft resembling that of a neuromuscular junction is close to an exponential. They considered the synaptic cleft to be a strip of infinite length and of width 2 a, which is open to the side and impermeable to transmitter at the top and the bottom. They further assumed that at time zero transmitter concentration is spatially uniform within the cleft and zero outside (eqn (2) of Eccles & Jaeger, 1958). These assumptions may very well represent the situation towards the end of 100 ms stimulus trains in the synaptic cleft formed by a finger-like calyx. Apart from a few micro domains of elevated glutamate around those active zones where release had taken place during the last few stimuli, transmitter concentration will be reasonably uniform. Eccles & Jaeger found that deviations from a single exponential with τo=a2/(Dπ2) are on the order of 15–20% and limited to very short times (< 1% at t=τo/3). Therefore, such a cleft behaves like a single compartment and we can calculate the half-width of this compartment as  . For the P12–14 calyces with an average τrecov= 21 ms and a value of D= 0.33 μm2 ms−2, as reported by Nielsen et al. 2004) for cerebellar mossy fibre-granule cell synapses, we obtain an upper bound for the half-width of a ‘finger’of ∼8 μm. For P5–7 synapses (τrecov= 484 ms) the same calculation would result in a half-width of ∼40 μm. This value is close to the whole circumference (∼47 μm) of a MNTB principal neurone having a diameter of 15 μm, such that the approximation of an elongated strip is no longer valid. Eccles & Jaeger (1958) also give an expression for the concentration change in a disc-like geometry of the synaptic cleft (their eqn (1)), which again shows that the decay is dominated by a single exponential with τo=a2/(Dα12), where α1 is the first positive root of a Bessel function with a value of 2.405. With the experimentally determined τrecov of 484 ms, we obtain a value of 15.9 μm for the radius a of the disc. This seems a reasonable value assuming that the immature, cup-shaped calyx contacts ∼63% of the principal cell surface area (Taschenberger et al. 2002). Under the simplifying assumption that τrecov approximately reflects the decay of free glutamate in the synaptic cleft, our results, thus, agree well with the expectations from the morphological changes from a cup to a finger-like shape as calyces mature (Kandler & Friauf, 1993).
Phasic and asynchronous release at the mature calyx synapse
Deconvolution analysis revealed a more than doubling of the peak rates of AP-evoked phasic release during development. In P12–14 calyx synapses, the rate decayed exponentially with an average time constant of ∼200–250 μs, which is much faster than in climbing fibre synapses of the cerebellum (∼750 μs, Wadiche & Jahr, 2001) but closer to that in hippocampal principal neurone–interneurone synapses (298 μs, 34°C, Geiger et al. 1997) and another calyceal synapse, the end bulb of Held (294 μs, Isaacson & Walmsley, 1995).
The time course of phasic transmitter release triggered by presynaptic APs is governed by the kinetics of Ca2+ binding to the Ca2+ sensor and the temporal profile of the local Ca2+ signal. The latter is determined by the AP waveform, the kinetics of Ca2+ influx, buffering and extrusion and by the spatial relationship between presynaptic Ca2+ channels and the release machinery (Meinrenken et al. 2003). Both the time course of the local Ca2+ signal and the Ca2+ sensitivity of the release machinery may be subject to developmental changes during synapse maturation. In fact, a shortening of APs with increasing age has been demonstrated for the developing calyx of Held terminal (Taschenberger & von Gersdorff, 2000). A reduced presynaptic Ca2+ influx could provide a mechanism for the developmental decrease of F. The higher peak release rates in more mature synapses suggests, on the other hand, a more efficient coupling of Ca2+ influx to exocytosis (Taschenberger et al. 2002) perhaps because of a more intimate association between presynaptic Ca2+ channels and the release machinery (Fedchyshyn & Wang, 2005). This seems to compensate for the briefer Ca2+ influx during mature APs and allows the maintenance of large eEPSC amplitudes despite much more rapid kinetics of the underlying quantal events in more mature synapses.
Interestingly, even at the end of extended 100 Hz stimulation, the vast majority of all released vesicles seemed to contribute to phasic release. We estimated that more mature calyxes were able to sustain an average rate of ∼10 quanta s−1 per active zone for the phasic release. This rate is ∼10-fold higher than the maximal endocytotic capacity of 1 quanta s−1 per AZ reported for hippocampal terminals (Sankaranarayanan & Ryan, 2001). A preferential synchronous mode of release could be beneficial to maintain such high release rates and would be especially appropriate for a relay synapse which was found to reliably operate up to 800 Hz at the age of P14 (Taschenberger & von Gersdorff, 2000). Specialized structures such as the mitochondria-associated adherens complex (Rowland et al. 2000) may enable the terminals to maintain high exocytotic rates. With a RRP of ∼1250 vesicles and a recovery rate of 1/4 s−1 (von Gersdorff et al. 1997) we expect an average steady state release rate of 0.312 ms−1. For long 100 Hz trains the measured rates were, however, > 10 times higher. This can only be reconciled if we postulate a larger RRP or, alternatively, a faster recruitment of quanta during stimulation (Wang & Kaczmarek, 1998; Sakaba & Neher, 2001a).
In conclusion, an impressive number of developmental refinements affecting presynaptic AP waveform and Ca2+ handling, release time course, prevalence of synchronous versus asynchronous release, quantal parameters and kinetics of quantal currents, transmitter clearance and synaptic plasticity (Chuhma & Ohmori, 1998; Taschenberger & von Gersdorff, 2000; Iwasaki & Takahashi, 2001; Joshi & Wang, 2002; Taschenberger et al. 2002; Joshi et al. 2004; Fedchyshyn & Wang, 2005; Koike-Tani et al. 2005; Leao et al. 2005) have been identified which endow the calyx of Held synapse with the functional properties to provide timely precise and reliable inhibition required by the auditory system for precise sound localization (Grothe, 2003).
Acknowledgments
We thank Takeshi Sakaba, Ralf Schneggenburger and Jürgen Klingauf for valuable discussions, Craig E. Jahr for helpful comments, Nobutake Hosoi and Matthew Holt for critically reading the manuscript and Frank Würriehausen for expert advice on programming.
Appendix
Variance–mean analysis in the case that individual quanta are released with variable latency
For the calculation of the effect of latency fluctuations (‘jitter’) of released quanta on the mean eEPSC peak amplitude Īp as well as the contribution of such fluctuations to the variance of Ip during successive trials (σ2I), we distinguish three ‘independent’ random processes: first whether or not an all-or-none release event occurs at a given release site in response to a stimulus; second, the time at which the release event takes place within a given time interval after the stimulus; and third, the quantal amplitude generated by the release event (we assume that one site releases at most once per eEPSC and that all quanta sum linearly). Such a distinction is necessary for fluctuation analysis in the case of multisite synapses where the time tp of the peak of multiquantal eEPSCs remains relatively constant but individual quanta occur at different times around this peak time and thus contribute in variable amounts to the eEPSC peak amplitude. In contrast, at single-site synapses, evoked EPSCs represent individual quanta and the ‘jitter’ in the timing of release is taken care of by determining peak amplitudes at the respective tp. For synapses with few release sites tp might vary considerably depending on the timing of the underlying quantal events. In this case, the analysis outlined below will be valid if a fixed tp is used, which may be taken as the peak time of the average eEPSC waveform.
The current generated at the time tp of the eEPSC peak by a release event occurring at time tr at a single site is:
 |
(A1) |
where q is the quantal amplitude, m(t) the time course of the normalized quantal current and r is a release event parameter with:
 |
(A2) |
where δ is Dirac's delta function.
Denoting the expectation of an expression by E, the average current contributed by a single site is:
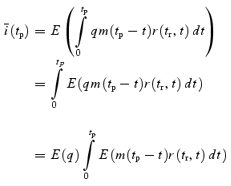 |
(A3) |
Now introducing an attenuation factor f as:
| (A4) |
Yields:
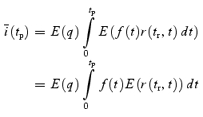 |
(A5) |
since f is no random process in itself. The expectation of r(tp,t) can be expressed as the probability p that a release event occurs and the probability Θ(t) that it takes place at time t in case a release event occurs.
| (A6) |
Thus:
 |
(A7) |
because f can now be considered as a random variable (dependent on t) and a probability distribution of t and also E(q) is the average of q.
For the variance of the contribution from a single site we need to know:
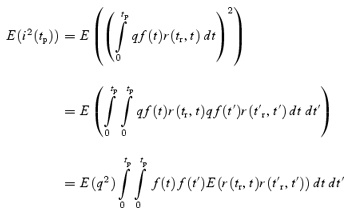 |
(A8) |
Because release can occur only once per site:
| (A9) |
and we get:
 |
(A10) |
Such that for a single site the variance is:
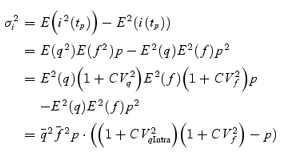 |
(A11) |
where CVqIntra and CVf are the coefficients of variation of the intrasite quantal variability and attenuation factor, respectively.
Allowing for intersite quantal variability with CVqInter, but assuming for all release sites the same probability of release as well as uniform distribution of the attenuation factor, the mean eEPSC peak amplitude Īp and the variance of the eEPSC peak amplitude (σ2I) for N release sites are obtained from eqn (7) and (11) as:
| (A12) |
and
 |
(A13) |
(compare eqns (8) and (14) in Scheuss & Neher, 2001).
Thus the variance/mean ratio is:
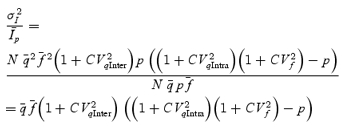 |
(A14) |
Solving for the mean quantal amplitude q¯ we arrive at:
 |
(A15) |
which for p≪ 1 simplifies to:
 |
(A16) |
where for practical purposes the coefficient of variation CVqMini of the distribution of mEPSCs accounts for the combined statistical effect of intra- and intersite quantal variability.
Calculation of f¯ and CV2f
If the quantal time course m(t) and the release rate r(t) are known, e.g. from average peak normalized mEPSC traces and deconvolution of the eEPSC (Neher & Sakaba, 2001a), respectively, the mean of the attenuation factor f can be calculated from:
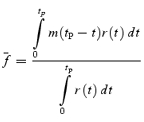 |
(A17) |
The variance σ2f is:
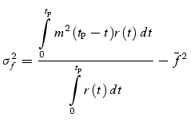 |
(A18) |
such that:
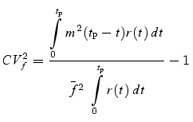 |
(A19) |
For numerical calculation of f¯ and CV2f it is important to use the same m(t), which was used to calculate r(t) and also tp as the time of peak of the convolution of r(t) and m(t) (which should, of course, coincide with the measured peak time, if deconvolution was done correctly).
References
- Angulo MC, Lambolez B, Audinat E, Hestrin S, Rossier J. Subunit composition, kinetic, and permeation properties of AMPA receptors in single neocortical nonpyramidal cells. J Neurosci. 1997;17:6685–6696. doi: 10.1523/JNEUROSCI.17-17-06685.1997. [DOI] [PMC free article] [PubMed] [Google Scholar]
- Auger C, Kondo S, Marty A. Multivesicular release at single functional synaptic sites in cerebellar stellate and basket cells. J Neurosci. 1998;18:4532–4547. doi: 10.1523/JNEUROSCI.18-12-04532.1998. [DOI] [PMC free article] [PubMed] [Google Scholar]
- Barbour B, Keller BU, Llano I, Marty A. Prolonged presence of glutamate during excitatory synaptic transmission to cerebellar Purkinje cells. Neuron. 1994;12:1331–1343. doi: 10.1016/0896-6273(94)90448-0. [DOI] [PubMed] [Google Scholar]
- Barrett EF, Stevens CF. The kinetics of transmitter release at the frog neuromuscular junction. J Physiol. 1972;227:691–708. doi: 10.1113/jphysiol.1972.sp010054. [DOI] [PMC free article] [PubMed] [Google Scholar]
- Betz WJ. Depression of transmitter release at the neuromuscular junction of the frog. J Physiol. 1970;206:629–644. doi: 10.1113/jphysiol.1970.sp009034. [DOI] [PMC free article] [PubMed] [Google Scholar]
- Blitz DM, Foster KA, Regehr WG. Short-term synaptic plasticity: a comparison of two synapses. Nat Rev Neurosci. 2004;5:630–640. doi: 10.1038/nrn1475. [DOI] [PubMed] [Google Scholar]
- Bollmann JH, Sakmann B, Borst JG. Calcium sensitivity of glutamate release in a calyx-type terminal. Science. 2000;289:953–957. doi: 10.1126/science.289.5481.953. [DOI] [PubMed] [Google Scholar]
- Borst JG, Helmchen F, Sakmann B. Pre- and postsynaptic whole-cell recordings in the medial nucleus of the trapezoid body of the rat. J Physiol. 1995;489:825–840. doi: 10.1113/jphysiol.1995.sp021095. [DOI] [PMC free article] [PubMed] [Google Scholar]
- Borst JG, Sakmann B. Calcium influx and transmitter release in a fast CNS synapse. Nature. 1996;383:431–434. doi: 10.1038/383431a0. [DOI] [PubMed] [Google Scholar]
- Brenowitz S, Trussell LO. Maturation of synaptic transmission at end-bulb synapses of the cochlear nucleus. J Neurosci. 2001;21:9487–9498. doi: 10.1523/JNEUROSCI.21-23-09487.2001. [DOI] [PMC free article] [PubMed] [Google Scholar]
- Chuhma N, Koyano K, Ohmori H. Synchronisation of neurotransmitter release during postnatal development in a calyceal presynaptic terminal of rat. J Physiol. 2001;530:93–104. doi: 10.1111/j.1469-7793.2001.0093m.x. [DOI] [PMC free article] [PubMed] [Google Scholar]
- Chuhma N, Ohmori H. Postnatal development of phase-locked high-fidelity synaptic transmission in the medial nucleus of the trapezoid body of the rat. J Neurosci. 1998;18:512–520. doi: 10.1523/JNEUROSCI.18-01-00512.1998. [DOI] [PMC free article] [PubMed] [Google Scholar]
- Clements JD, Bekkers JM. Detection of spontaneous synaptic events with an optimally scaled template. Biophys J. 1997;73:220–229. doi: 10.1016/S0006-3495(97)78062-7. [DOI] [PMC free article] [PubMed] [Google Scholar]
- Clements JD, Silver RA. Unveiling synaptic plasticity: a new graphical and analytical approach. Trends Neurosci. 2000;23:105–113. doi: 10.1016/s0166-2236(99)01520-9. [DOI] [PubMed] [Google Scholar]
- Cummings DD, Wilcox KS, Dichter MA. Calcium-dependent paired-pulse facilitation of miniature EPSC frequency accompanies depression of EPSCs at hippocampal synapses in culture. J Neurosci. 1996;16:5312–5323. doi: 10.1523/JNEUROSCI.16-17-05312.1996. [DOI] [PMC free article] [PubMed] [Google Scholar]
- Diamond JS, Jahr CE. Asynchronous release of synaptic vesicles determines the time course of the AMPA receptor-mediated EPSC. Neuron. 1995;15:1097–1107. doi: 10.1016/0896-6273(95)90098-5. [DOI] [PubMed] [Google Scholar]
- DiGregorio DA, Nusser Z, Silver RA. Spillover of glutamate onto synaptic AMPA receptors enhances fast transmission at a cerebellar synapse. Neuron. 2002;35:521–533. doi: 10.1016/s0896-6273(02)00787-0. [DOI] [PubMed] [Google Scholar]
- Eccles JC, Jaeger JC. The relationship between the mode of operation and the dimensions of the junctional regions at synapses and motor end-organs. Proc R Soc Lond B Biol Sci. 1958;148:38–56. doi: 10.1098/rspb.1958.0003. [DOI] [PubMed] [Google Scholar]
- Elmqvist D, Quastel DM. A quantitative study of end-plate potentials in isolated human muscle. J Physiol. 1965;178:505–529. doi: 10.1113/jphysiol.1965.sp007639. [DOI] [PMC free article] [PubMed] [Google Scholar]
- Faber DS, Korn H. Applicability of the coefficient of variation method for analyzing synaptic plasticity. Biophys J. 1991;60:1288–1294. doi: 10.1016/S0006-3495(91)82162-2. [DOI] [PMC free article] [PubMed] [Google Scholar]
- Fedchyshyn MJ, Wang LY. Developmental transformation of the release modality at the calyx of held synapse. J Neurosci. 2005;25:4131–4140. doi: 10.1523/JNEUROSCI.0350-05.2005. [DOI] [PMC free article] [PubMed] [Google Scholar]
- Forsythe ID. Direct patch recording from identified presynaptic terminals mediating glutamatergic EPSCs in the rat CNS, in vitro. J Physiol. 1994;479:381–387. doi: 10.1113/jphysiol.1994.sp020303. [DOI] [PMC free article] [PubMed] [Google Scholar]
- Frerking M, Wilson M. Effects of variance in mini amplitude on stimulus-evoked release: a comparison of two models. Biophys J. 1996;70:2078–2091. doi: 10.1016/S0006-3495(96)79774-6. [DOI] [PMC free article] [PubMed] [Google Scholar]
- Geiger JR, Lubke J, Roth A, Frotscher M, Jonas P. Submillisecond AMPA receptor-mediated signaling at a principal neuron-interneuron synapse. Neuron. 1997;18:1009–1023. doi: 10.1016/s0896-6273(00)80339-6. [DOI] [PubMed] [Google Scholar]
- Goda Y, Stevens CF. Two components of transmitter release at a central synapse. Proc Natl Acad Sci U S A. 1994;91:12942–12946. doi: 10.1073/pnas.91.26.12942. [DOI] [PMC free article] [PubMed] [Google Scholar]
- Grothe B. New roles for synaptic inhibition in sound localization. Nat Rev Neurosci. 2003;4:540–550. doi: 10.1038/nrn1136. [DOI] [PubMed] [Google Scholar]
- Habets RL, Borst JG. Post-tetanic potentiation in the rat calyx of Held synapse. J Physiol. 2005;564:173–187. doi: 10.1113/jphysiol.2004.079160. [DOI] [PMC free article] [PubMed] [Google Scholar]
- Isaacson JS, Walmsley B. Counting quanta: direct measurements of transmitter release at a central synapse. Neuron. 1995;15:875–884. doi: 10.1016/0896-6273(95)90178-7. [DOI] [PubMed] [Google Scholar]
- Ishikawa T, Sahara Y, Takahashi T. A single packet of transmitter does not saturate postsynaptic glutamate receptors. Neuron. 2002;34:613–621. doi: 10.1016/s0896-6273(02)00692-x. [DOI] [PubMed] [Google Scholar]
- Iwasaki S, Takahashi T. Developmental regulation of transmitter release at the calyx of Held in rat auditory brainstem. J Physiol. 2001;534:861–871. doi: 10.1111/j.1469-7793.2001.00861.x. [DOI] [PMC free article] [PubMed] [Google Scholar]
- Jonas P, Major G, Sakmann B. Quantal components of unitary EPSCs at the mossy fibre synapse on CA3 pyramidal cells of rat hippocampus. J Physiol. 1993;472:615–663. doi: 10.1113/jphysiol.1993.sp019965. [DOI] [PMC free article] [PubMed] [Google Scholar]
- Joshi I, Shokralla S, Titis P, Wang LY. The role of AMPA receptor gating in the development of high-fidelity neurotransmission at the calyx of Held synapse. J Neurosci. 2004;24:183–196. doi: 10.1523/JNEUROSCI.1074-03.2004. [DOI] [PMC free article] [PubMed] [Google Scholar]
- Joshi I, Wang LY. Developmental profiles of glutamate receptors and synaptic transmission at a single synapse in the mouse auditory brainstem. J Physiol. 2002;540:861–873. doi: 10.1113/jphysiol.2001.013506. [DOI] [PMC free article] [PubMed] [Google Scholar]
- Kandler K, Friauf E. Pre- and postnatal development of efferent connections of the cochlear nucleus in the rat. J Comp Neurol. 1993;328:161–184. doi: 10.1002/cne.903280202. [DOI] [PubMed] [Google Scholar]
- Katz B. The Release of Neural Transmitter Substances. Liverpool, UK: Liverpool University Press; 1969. [Google Scholar]
- Koike-Tani M, Saitoh N, Takahashi T. Mechanisms underlying developmental speeding in AMPA-EPSC decay time at the calyx of Held. J Neurosci. 2005;25:199–207. doi: 10.1523/JNEUROSCI.3861-04.2005. [DOI] [PMC free article] [PubMed] [Google Scholar]
- Leao RM, Kushmerick C, Pinaud R, Renden R, Li GL, Taschenberger H, Spirou G, Levinson SR, von Gersdorff H. Presynaptic Na+ channels: locus, development, and recovery from inactivation at a high-fidelity synapse. J Neurosci. 2005;25:3724–3738. doi: 10.1523/JNEUROSCI.3983-04.2005. [DOI] [PMC free article] [PubMed] [Google Scholar]
- Liley AW, North KA. An electrical investigation of effects of repetitive stimulation on mammalian neuromuscular junction. J Neurophysiol. 1953;16:509–527. doi: 10.1152/jn.1953.16.5.509. [DOI] [PubMed] [Google Scholar]
- Liu G, Choi S, Tsien RW. Variability of neurotransmitter concentration and nonsaturation of postsynaptic AMPA receptors at synapses in hippocampal cultures and slices. Neuron. 1999;22:395–409. doi: 10.1016/s0896-6273(00)81099-5. [DOI] [PubMed] [Google Scholar]
- Lu T, Trussell LO. Inhibitory transmission mediated by asynchronous transmitter release. Neuron. 2000;26:683–694. doi: 10.1016/s0896-6273(00)81204-0. [DOI] [PubMed] [Google Scholar]
- McAllister AK, Stevens CF. Nonsaturation of AMPA and NMDA receptors at hippocampal synapses. Proc Natl Acad Sci U S A. 2000;97:6173–6178. doi: 10.1073/pnas.100126497. [DOI] [PMC free article] [PubMed] [Google Scholar]
- Meinrenken CJ, Borst JG, Sakmann B. Local routes revisited: the space and time dependence of the Ca2+ signal for phasic transmitter release at the rat calyx of Held. J Physiol. 2003;547:665–689. doi: 10.1113/jphysiol.2002.032714. [DOI] [PMC free article] [PubMed] [Google Scholar]
- Meyer AC, Neher E, Schneggenburger R. Estimation of quantal size and number of functional active zones at the calyx of held synapse by nonstationary EPSC variance analysis. J Neurosci. 2001;21:7889–7900. doi: 10.1523/JNEUROSCI.21-20-07889.2001. [DOI] [PMC free article] [PubMed] [Google Scholar]
- Neher E, Sakaba T. Combining deconvolution and noise analysis for the estimation of transmitter release rates at the calyx of held. J Neurosci. 2001a;21:444–461. doi: 10.1523/JNEUROSCI.21-02-00444.2001. [DOI] [PMC free article] [PubMed] [Google Scholar]
- Neher E, Sakaba T. Estimating transmitter release rates from postsynaptic current fluctuations. J Neurosci. 2001b;21:9638–9654. doi: 10.1523/JNEUROSCI.21-24-09638.2001. [DOI] [PMC free article] [PubMed] [Google Scholar]
- Nielsen TA, DiGregorio DA, Silver RA. Modulation of glutamate mobility reveals the mechanism underlying slow-rising AMPAR EPSCs and the diffusion coefficient in the synaptic cleft. Neuron. 2004;42:757–771. doi: 10.1016/j.neuron.2004.04.003. [DOI] [PubMed] [Google Scholar]
- Oleskevich S, Clements J, Walmsley B. Release probability modulates short-term plasticity at a rat giant terminal. J Physiol. 2000;524:513–523. doi: 10.1111/j.1469-7793.2000.00513.x. [DOI] [PMC free article] [PubMed] [Google Scholar]
- Oleskevich S, Walmsley B. Synaptic transmission in the auditory brainstem of normal and congenitally deaf mice. J Physiol. 2002;540:447–455. doi: 10.1113/jphysiol.2001.013821. [DOI] [PMC free article] [PubMed] [Google Scholar]
- Otis T, Zhang S, Trussell LO. Direct measurement of AMPA receptor desensitization induced by glutamatergic synaptic transmission. J Neurosci. 1996a;16:7496–7504. doi: 10.1523/JNEUROSCI.16-23-07496.1996. [DOI] [PMC free article] [PubMed] [Google Scholar]
- Otis TS, Wu YC, Trussell LO. Delayed clearance of transmitter and the role of glutamate transporters at synapses with multiple release sites. J Neurosci. 1996b;16:1634–1644. doi: 10.1523/JNEUROSCI.16-05-01634.1996. [DOI] [PMC free article] [PubMed] [Google Scholar]
- Palmer MJ, Taschenberger H, Hull C, Tremere L, von Gersdorff H. Synaptic activation of presynaptic glutamate transporter currents in nerve terminals. J Neurosci. 2003;23:4831–4841. doi: 10.1523/JNEUROSCI.23-12-04831.2003. [DOI] [PMC free article] [PubMed] [Google Scholar]
- Quastel DM. The binomial model in fluctuation analysis of quantal neurotransmitter release. Biophys J. 1997;72:728–753. doi: 10.1016/s0006-3495(97)78709-5. [DOI] [PMC free article] [PubMed] [Google Scholar]
- Raman IM, Trussell LO. The mechanism of alpha-amino-3-hydroxy-5-methyl-4-isoxazolepropionate receptor desensitization after removal of glutamate. Biophys J. 1995;68:137–146. doi: 10.1016/S0006-3495(95)80168-2. [DOI] [PMC free article] [PubMed] [Google Scholar]
- Rizzoli SO, Betz WJ. Synaptic vesicle pools. Nat Rev Neurosci. 2005;6:57–69. doi: 10.1038/nrn1583. [DOI] [PubMed] [Google Scholar]
- Rowland KC, Irby NK, Spirou GA. Specialized synapse-associated structures within the calyx of Held. J Neurosci. 2000;20:9135–9144. doi: 10.1523/JNEUROSCI.20-24-09135.2000. [DOI] [PMC free article] [PubMed] [Google Scholar]
- Sahara Y, Takahashi T. Quantal components of the excitatory postsynaptic currents at a rat central auditory synapse. J Physiol. 2001;536:189–197. doi: 10.1111/j.1469-7793.2001.00189.x. [DOI] [PMC free article] [PubMed] [Google Scholar]
- Sakaba T, Neher E. Calmodulin mediates rapid recruitment of fast-releasing synaptic vesicles at a calyx-type synapse. Neuron. 2001a;32:1119–1131. doi: 10.1016/s0896-6273(01)00543-8. [DOI] [PubMed] [Google Scholar]
- Sakaba T, Neher E. Quantitative relationship between transmitter release and calcium current at the calyx of held synapse. J Neurosci. 2001b;21:462–476. doi: 10.1523/JNEUROSCI.21-02-00462.2001. [DOI] [PMC free article] [PubMed] [Google Scholar]
- Sankaranarayanan S, Ryan TA. Calcium accelerates endocytosis of vSNAREs at hippocampal synapses. Nat Neurosci. 2001;4:129–136. doi: 10.1038/83949. [DOI] [PubMed] [Google Scholar]
- Sätzler K, Sohl LF, Bollmann JH, Borst JG, Frotscher M, Sakmann B, Lubke JH. Three-dimensional reconstruction of a calyx of Held and its postsynaptic principal neuron in the medial nucleus of the trapezoid body. J Neurosci. 2002;22:10567–10579. doi: 10.1523/JNEUROSCI.22-24-10567.2002. [DOI] [PMC free article] [PubMed] [Google Scholar]
- Scheuss V, Neher E. Estimating synaptic parameters from mean, variance, and covariance in trains of synaptic responses. Biophys J. 2001;81:1970–1989. doi: 10.1016/S0006-3495(01)75848-1. [DOI] [PMC free article] [PubMed] [Google Scholar]
- Scheuss V, Schneggenburger R, Neher E. Separation of presynaptic and postsynaptic contributions to depression by covariance analysis of successive EPSCs at the calyx of held synapse. J Neurosci. 2002;22:728–739. doi: 10.1523/JNEUROSCI.22-03-00728.2002. [DOI] [PMC free article] [PubMed] [Google Scholar]
- Schneggenburger R, Meyer AC, Neher E. Released fraction and total size of a pool of immediately available transmitter quanta at a calyx synapse. Neuron. 1999;23:399–409. doi: 10.1016/s0896-6273(00)80789-8. [DOI] [PubMed] [Google Scholar]
- Silver RA, Momiyama A, Cull-Candy SG. Locus of frequency-dependent depression identified with multiple-probability fluctuation analysis at rat climbing fibre–Purkinje cell synapses. J Physiol. 1998;510:881–902. doi: 10.1111/j.1469-7793.1998.881bj.x. [DOI] [PMC free article] [PubMed] [Google Scholar]
- Sun JY, Wu LG. Fast kinetics of exocytosis revealed by simultaneous measurements of presynaptic capacitance and postsynaptic currents at a central synapse. Neuron. 2001;30:171–182. doi: 10.1016/s0896-6273(01)00271-9. [DOI] [PubMed] [Google Scholar]
- Takahashi T, Forsythe ID, Tsujimoto T, Barnes-Davies M, Onodera K. Presynaptic calcium current modulation by a metabotropic glutamate receptor. Science. 1996;274:594–597. doi: 10.1126/science.274.5287.594. [DOI] [PubMed] [Google Scholar]
- Taschenberger H, Leao RM, Rowland KC, Spirou GA, von Gersdorff H. Optimizing synaptic architecture and efficiency for high-frequency transmission. Neuron. 2002;36:1127–1143. doi: 10.1016/s0896-6273(02)01137-6. [DOI] [PubMed] [Google Scholar]
- Taschenberger H, von Gersdorff H. Fine-tuning an auditory synapse for speed and fidelity: developmental changes in presynaptic waveform, EPSC kinetics, and synaptic plasticity. J Neurosci. 2000;20:9162–9173. doi: 10.1523/JNEUROSCI.20-24-09162.2000. [DOI] [PMC free article] [PubMed] [Google Scholar]
- Traynelis SF. Software-based correction of single compartment series resistance errors. J Neurosci Meth. 1998;86:25–34. doi: 10.1016/s0165-0270(98)00140-x. [DOI] [PubMed] [Google Scholar]
- Trommershäuser J, Schneggenburger R, Zippelius A, Neher E. Heterogeneous presynaptic release probabilities: functional relevance for short-term plasticity. Biophys J. 2003;84:1563–1579. doi: 10.1016/S0006-3495(03)74967-4. [DOI] [PMC free article] [PubMed] [Google Scholar]
- Trussell LO, Zhang S, Raman IM. Desensitization of AMPA receptors upon multiquantal neurotransmitter release. Neuron. 1993;10:1185–1196. doi: 10.1016/0896-6273(93)90066-z. [DOI] [PubMed] [Google Scholar]
- von Gersdorff H, Schneggenburger R, Weis S, Neher E. Presynaptic depression at a calyx synapse: the small contribution of metabotropic glutamate receptors. J Neurosci. 1997;17:8137–8146. doi: 10.1523/JNEUROSCI.17-21-08137.1997. [DOI] [PMC free article] [PubMed] [Google Scholar]
- Wadiche JI, Jahr CE. Multivesicular release at climbing fiber-Purkinje cell synapses. Neuron. 2001;32:301–313. doi: 10.1016/s0896-6273(01)00488-3. [DOI] [PubMed] [Google Scholar]
- Walmsley B, Alvarez FJ, Fyffe RE. Diversity of structure and function at mammalian central synapses. Trends Neurosci. 1998;21:81–88. doi: 10.1016/s0166-2236(97)01170-3. [DOI] [PubMed] [Google Scholar]
- Wang LY, Kaczmarek LK. High-frequency firing helps replenish the readily releasable pool of synaptic vesicles. Nature. 1998;394:384–388. doi: 10.1038/28645. [DOI] [PubMed] [Google Scholar]
- Wong AY, Graham BP, Billups B, Forsythe ID. Distinguishing between presynaptic and postsynaptic mechanisms of short-term depression during action potential trains. J Neurosci. 2003;23:4868–4877. doi: 10.1523/JNEUROSCI.23-12-04868.2003. [DOI] [PMC free article] [PubMed] [Google Scholar]
- Wu LG, Borst JG. The reduced release probability of releasable vesicles during recovery from short-term synaptic depression. Neuron. 1999;23:821–832. doi: 10.1016/s0896-6273(01)80039-8. [DOI] [PubMed] [Google Scholar]
- Zucker RS, Regehr WG. Short-term synaptic plasticity. Annu Rev Physiol. 2002;64:355–405. doi: 10.1146/annurev.physiol.64.092501.114547. [DOI] [PubMed] [Google Scholar]


