Abstract
While the heart size maintains a constant proportion to body size, heart function parameters, such as heart rate and cardiac output, show a more complex scaling pattern. How these phenomena affect the long-axis left ventricular (LV) function is unknown. We studied 10 mice, 15 rats, 6 rabbits, 8 mongrel dogs and 38 human volunteers. Doppler tissue echocardiography data were postprocessed to reconstruct mitral annulus (MA) peak systolic velocity and displacement. The relationship between MA peak velocity, MA displacement and LV ejection time, and LV end-diastolic volume (and mass) were fit to an allometric (power-law) equation Y=kMβ. LV mass varied from 0.062 to 255 g, while end-diastolic volume varied from 0.014 to 205 ml. β values of the relation between LV ejection time and LV end-diastolic volume and mass were 0.247 ± 0.017 and 0.267 ± 0.018, respectively. β values of the relationship between MA displacement and LV end-diastolic volume and mass were 0.358 ± 0.047 and 0.390 ± 0.051 (P < 0.023 versusβ of LV ejection time). β values of the relationship between MA peak systolic velocity and LV end-diastolic volume and mass were 0.096 ± 0.012 and 0.100 ± 0.013, respectively (P < 0.0001 versus 0). Finally, β values of the relationship between the long-to-short axis displacement ratio and LV end-diastolic volume and mass were 0.077 ± 0.017 and 0.086 ± 0.019 (P < 0.0001 versus 0). We conclude that MA velocity, displacement, and long-to-short axis displacement ratio scale allometrically to heart size. This reduces the relative long-axis contribution to heart function in small mammals.
The heart is a hollow muscular organ whose purpose is to supply oxygen at a rate that is proportional to the metabolic rate of the body. While the size of the heart varies by several orders of magnitude between mammalian species, it maintains a constant proportion of about 0.6% of total body size (Prothero, 1979). On the other hand, the proportion between metabolic rate and body size shows a more complex scaling pattern. How these two phenomena affect different parameters of the function of the heart is ill defined.
Scaling in biology is usually allometric, i.e. the size of an organ size or its functional characteristics may be expressed as a power function of body mass or weight (Lindstedt & Schaeffer, 2002). In general, equations of the type Y=kMβ express the allometric relationship. For example, RR interval duration scales allometrically to the body size with the power of 0.25 (Noujaim et al. 2004), while the metabolic rate and cardiac output scale with the power of 0.75 (West et al. 1997). It has been proposed that the scaling with the power of one-quarter, or of its multiples (such as 0.75, 1, etc.), reflects a fundamental fractal-like branching structure of living organisms (West et al. 1997). Since the heart weight of all mammals keeps a constant proportion to their body mass, the value of the allometric scaling exponent of any particular heart function index would be the same versus either the body or the heart size. In our laboratory, we have the opportunity to collect and analyse data using the same equipment in a variety of animal models that differ dramatically in size. We have observed that, in contrast to what was originally assumed, there is a wide variability of reconstructed myocardial tissue velocities among different species. This has not been previously assessed systematically because of technical issues involved in myocardial tissue velocity analysis by standard pulsed-wave Doppler imaging in the setting of rapid heart rate, and problems induced by anaesthesia of the animals (Rottman et al. 2003) and lack of awareness of the problem. At the same time, assessment of myocardial tissue velocities is becoming increasingly popular for the noninvasive assessment of left ventricular (LV) function in small-animal models of heart disease (Derumeaux et al. 2002; Askari et al. 2003). The primary aim of this study, therefore, was to determine whether long-axis myocardial tissue velocities scale to heart size. The secondary aim was to quantify the scaling exponents of myocardial tissue velocities and their time-integral (i.e. long-axis tissue displacement).
Methods
Background
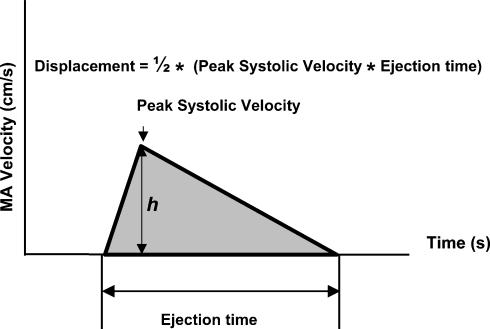
The line describing the systolic mitral annulus (MA) velocity as a function of time (Fig. 1) has characteristic ascending and descending portions, which together with the horizontal (time) axis comprise a triangular profile. We begin, therefore, by simplifying the shape of a systolic portion of the myocardial Doppler tissue velocity profile to a triangle. As seen from Fig. 1, the base equals LV ejection time, the height (h) corresponds to the peak systolic velocity, and the shaded area of the triangle (i.e. the time integral of the velocity) equals the long-axis LV displacement.
Figure 1. A simplified triangular geometry of the systolic part of the myocardial tissue velocity profile.
The base equals left ventricular (LV) ejection time, the height (h) corresponds to the peak systolic velocity, and the shaded area of the triangle (i.e. the time integral of the velocity; one-half of the base by height product) equals the long-axis left ventricular displacement. MA, mitral annulus.
It has been previously demonstrated that a number of electrocardiographic time intervals, such as the RR and PR intervals (Noujaim et al. 2004), scale allometrically versus the heart (or body) size with a β value (i.e. the power of the scaling exponent) of 0.25. The same is to be expected for the ejection time (see Results). Scaling of the LV long-axis displacement to heart size is unknown. We will explore two plausible, but mutually opposing, proposals. In the first, we assume that the long-axis displacement (D) scales to the heart size with the power of 0.25. If so, peak velocity (v) equals:
 |
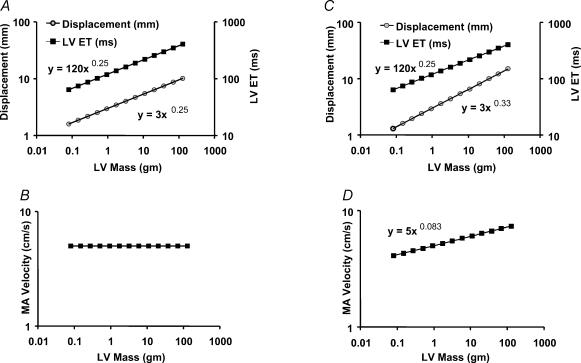
where a, b and k are proportionality constants. Thus, if the displacement scaling were with a power of 0.25, then peak myocardial velocities should be constant across the species (Fig. 2A and B).
Figure 2. Scaling relationships of MA displacement, velocity and LV ejection time assuming a triangular geometry of the systolic velocity profile.
If annulus displacement and ejection time scale to LV mass according to power function with the same exponent (A), MA velocity is independent of ventricular mass (B). If displacement scales to LV mass with a power that is larger than the exponent of ejection time–LV mass relationship (C), MA velocity scales with ventricular mass (D).
In the second proposal, we link D to the geometrical dimensions of the ventricle. As a model we use the cuboid equation for LV volume that assumes that LV long axis is two times longer than the short axis. (Pombo et al. 1971) We also assume that relative amounts of long- and short-axis displacements are the same and equal to 30% of initial end-diastolic value. If the LV short-axis end-diastolic diameter is designated as EDD, then the stroke volume (SV) can be expressed as (Pombo et al. 1971):
If we substitute EDD with the LV long-axis displacement D(D= 0.3 × 2 × EDD) and regroup, we obtain:
Since the SV scales with the heart size with the power of 1 (West et al. 1997):
Therefore:
 |
where c, b and k′ are proportionality constants. Thus, if D scaled according to Euclidean geometry with power of 0.33, then v should decrease with decreasing heart size (Fig. 2D).
It should be pointed out that the triangular model, as illustrated in Fig. 1, is a simplification. The deviations observed in a real-life heart require direct measurements and evaluation of all three systolic parameters (peak velocity, ejection time and displacement) in order to make conclusions about the applicability of a particular scaling relationship.
Study samples
The data from human subjects used and analysed for this study were reported in part in a previous publication (Sun et al. 2004). The studies in human subjects were performed in accordance with the Declaration of Helsinki. The Institutional Review Board approved that study, and all participants gave informed consent. Normal volunteers free of any known cardiovascular disease were recruited. All subjects underwent a thorough history, physical examination, and had a normal electrocardiogram. None of them reported taking any kind of cardio-active medication (except aspirin). From the initial study group (Sun et al. 2004), we selected 38 subjects whose age was between 21 and 45 years.
The animal data were collected during echocardiographic evaluation of control (normal) animals used in several different studies in the period of 2001–2004. Although these studies may be viewed technically as retrospective to our current report, the data collection in each of them was prospective and specified by the respective study protocols. Importantly, the evaluation of the reported echocardiographic data was performed in each study and animal by using compatible equipment and techniques.
The animal studies were approved by the Institutional Animal Research Committee and were in compliance with the ‘Guide for the Care and Use of Laboratory Animals’ published by the National Institutes of Health.
Procedures
All subjects (humans and animals) were studied in left lateral decubitus position. Due to the specificity of the animals' behaviour, the procedures differed slightly among the species. Eight mongrel dogs were trained to lie down calmly for echocardiography. Six white New Zealand rabbits were sedated with a subanaesthetic dose of 85 mg kg−1 of ketamine intramuscularly, with the handler keeping the head covered with soft cloth in a dark room. Fifteen Lewis rats were sedated with a subanaesthetic dose of 85 mg kg−1 of ketamine intraperitoneally. After ketamine administration, both rats and rabbits responded to transducer application to the chest wall, and they had to be gently restrained by the sonographer and/or handler. Finally, 10 C57/BL6 mice were assessed in a conscious state, with each one of them having at least one previous echocardiography session with the same handler.
Data collection
Echocardiography was performed using either Vivid 5, or Vivid 7 echocardiography machine (GE Medical, Milwaukee, WI, USA). M-mode echocardiography, two-dimensional echocardiography, and two-dimensional colour tissue Doppler echocardiography data were collected using a dual harmonic 1.7/3.4 MHz or 2.0/4.2 MHz sector transducer (humans, dogs), 6 MHz or 11.5 MHz paediatric sector transducer (rabbits, rats) and 14 MHz epicardial linear transducer (mice). The minimal frame rates acquired during standard two-dimensional echocardiography in humans, dogs, rabbits, rats and mice were 30, 50, 70, 90 and 160 frames s−1, respectively. The minimal frame rates acquired during colour tissue Doppler two-dimensional echocardiography in humans, dogs, rabbits, rats and mice were 125, 125, 189, 200 and 208 frames s−1, respectively. Data were digitized in a proprietary format for further analysis.
Data analysis
Data were analysed using Echopac PC (GE Medical). LV ejection time was measured directly from the digital pulsed-wave Doppler tracing of the LV outflow tract with the sweep speed set to 200 mm s−1. Short-axis displacement was calculated as:
where LV EDD and LV ESD are LV end-diastolic and end-systolic diameters measured from M-mode data. LV end-diastolic and end-systolic volumes were measured from the long-axis view by the single-plane Simpson equation. LV mass was calculated from two-dimensional echocardiography data by the bullet equation:
where 1.05 is the specific gravity of muscle, Aepi and Aendo are the epi- and endocardial parasternal short-axis areas, respectively, and L is the parasternal long-axis LV length. LV mass was calculated using both end-systolic and end-diastolic data, and the two estimates were then averaged. Previous studies have validated LV mass measurement based on two-dimensional echocardiography in mice (Collins et al. 2001), rabbits (Plehn et al. 1993), dogs (Wyatt et al. 1979) and humans (Reichek et al. 1983). Additionally, the validation of LV mass estimation by the bullet equation in mice, rats, dogs and humans performed in our laboratory is presented as supplemental data.
We reconstructed the velocity of the septal point of the MA using an apical four-chamber view recorded in transthoracic Doppler echocardiography (TDE) mode. The regions of interest for individual species were set to 8 × 8, 6 × 6, 4 × 4, 2 × 1 and 1 × 1 mm, respectively. For the analysis of human, dog and rabbit data, at least three beats were measured. For small rodents, at least six beats (for rats) or nine beats (for mice) were averaged. In rats and mice, MA diastolic E- and A-wave velocities were frequently fused. In these cases, the highest diastolic velocity observed after isovolumic relaxation interval was taken to represent the E-wave velocity. To obtain end-systolic displacement, MA velocities over at least three beats were averaged for humans, dogs and rabbits, while at least six or nine beats were averaged for rats and mice, respectively. The data were then integrated from the mitral valve closure time to aortic valve closure time to obtain end-systolic MA displacement. Long-axis–short-axis displacement ratio (L/Sh) was calculated by dividing end-diastolic displacement by short-axis displacement.
Intra- and interobserver variability of small rodent Doppler tissue imaging data
Intra- and interobserver variability of reconstructed myocardial tissue velocity data have been extensively studied in humans (Popovic et al. 2002; Sun et al. 2004). Here, we present intra- and interobserver variability of reconstructed myocardial tissue velocity data obtained in small rodents. Fourteen data sets obtained in rats that were not included in this report were measured twice after a time interval of >1 month by the same observer, and at that time also by a second observer blinded to the measurements of the first observer. In an identical manner, eight data sets obtained in mice that were not included in this paper were measured. Inter- and intraobserver variability was then quantified as absolute and relative difference between the two measurements.
Statistical methods
Allometric scaling is assumed to follow the power function (Zar, 1984):
where M is LV heart size parameter (i.e. LV EDV or LV mass), Y is a dependent variable (i.e. myocardial pick tissue velocity, LV ejection time, long (or short)-axis displacement, and long-axis–short-axis displacement ratio), k is constant, and β is the power of the scaling exponent.
To fit the data, we used a nonlinear regression method with Levenberg Marquardt algorithm (SPSS 10.0, SPSS, Inc., Chicago, IL, USA). Confidence intervals (95%) for exponent β were calculated using asymptotic error of estimate. A single-sample t statistic was used to compare the exponent β with a priori values of 0 and 0.25. A t test statistic was also used to compare the values of exponent β (Dawson-Saunders & Trapp, 1990). Data are presented as means ±s.d., or as exponent β± standard error of estimate (s.e.e). A P value < 0.05 was considered significant.
Results
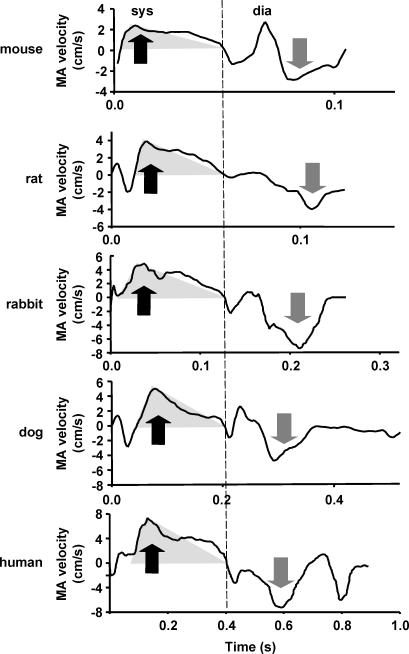
Basic morphometric and echocardiography parameters of different species are presented in Table 1. In our subjects, LV mass varied from 0.062 to 255 g, while EDV varied from 0.014 to 205 ml. Thus, body weight and heart size varied by up to four orders of magnitude among the subjects. Figure 3 represents characteristic myocardial tissue velocity profiles in different species.
Table 1.
Basic morphometric and echocardiography data of different species
| Body weight (kg) | RR interval (ms) | ET (ms) | EDV (ml) | ESV (ml) | EF | LV mass (g) | |
|---|---|---|---|---|---|---|---|
| Mouse (n = 10) | 0.028 ± 0.002 | 92.3 ± 5.6 | 42 ± 3 | 0.024 ± 0.01 | 0.008 ± 0.003 | 0.65 ± 0.14 | 0.091 ± 0.02 |
| Rat (n = 15) | 0.272 ± 0.021 | 143.9 ± 16.3 | 63 ± 9 | 0.189 ± 0.05 | 0.065 ± 0.025 | 0.66 ± 0.08 | 0.596 ± 0.153 |
| Rabbit (n = 6) | 3.01 ± 0.39 | 307.2 ± 25.6 | 125 ± 17 | 3.1 ± 0.6 | 1.2 ± 0.4 | 0.61 ± 0.08 | 3.6 ± 0.5 |
| Dog (n = 8) | 26.6 ± 4.2 | 504 ± 70.9 | 166 ± 16 | 58.2 ± 13.7 | 23.4 ± 6.3 | 0.59 ± 0.07 | 95.7 ± 19.5 |
| Human (n = 38) | 70.2 ± 13.1 | 938.8 ± 181.3 | 305 ± 20 | 106.5 ± 33.1 | 31.6 ± 15.4 | 0.70 ± 0.11 | 177.8 ± 44 |
LV mass, left ventricular mass by the bullet equation; EDV, LV end-diastolic volume by Simpson's single-plane method; EF, LV ejection fraction by Simpson's single-plane method; ESV, LV end-systolic volume by Simpson's single-plane method; ET, LV ejection time by pulsed-wave Doppler echocardiography.
Figure 3. Typical myocardial tissue velocity profiles recorded at the septal part of the MA.
A transparent grey triangle superimposed on the ejection part of velocity profile represents its simplified triangular geometry (see Fig. 1). Note a satisfactory correspondence between the true and simplified profile in all species. Also note an increase of velocity with the increase of species size. dia, diastole; sys, systole. Black arrows, peak-systolic velocity; grey arrows, E-wave velocity. The dashed line represents end-systole.
Scaling of time intervals
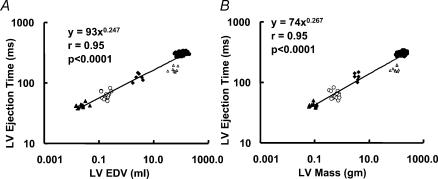
The RR interval scaling to LV end-diastolic volume and LV mass was compatible with the value of exponent of 0.25 (exponent βEDV= 0.307 ± 0.030, and βLVmass= 0.315 ± 0.034, P > 0.05 when compared with the value of 0.25 for both). The LV ejection time also scaled to LV end-diastolic volume and LV mass, in concordance with the value of exponent of 0.25 (exponent βEDV= 0.247 ± 0.017, and βLVmass= 0.267 ± 0.018, P > 0.1 when compared with the value of 0.25 for both) (Fig. 4A and B).
Figure 4. Scaling of LV ejection time to end-diastolic volume (A) and LV mass (B).
Ejection time was measured directly from pulsed-wave Doppler of the LV outflow tract. End-diastolic volume was estimated using Simpson's single-plane method, while mass was estimated using the bullet equation detailed in Methods. ▵, mice; ○, rats; ▴, rabbits; ▵, dogs; •, humans.
Scaling of long-axis function
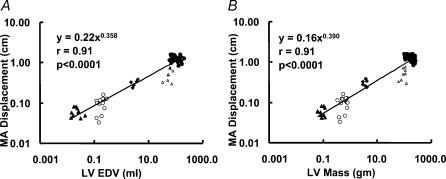
MA end-systolic displacement scaled with powers of βEDV= 0.358 ± 0.047, and βLVmass= 0.390 ± 0.051. Both were larger than the corresponding scaling exponents of LV ejection time (P= 0.021, and P= 0.023, respectively; Fig. 5A and B). In fact, the displacement exponents βEDV and βLVmass were close to the Euclidean exponent of 0.33. We have shown in the Methods (Background) that in such cases the peak systolic velocity should not remain constant, but should scale with a power of β= 0.0833.
Figure 5. Scaling of end-systolic displacement of the MA.
Scaling of end-systolic displacement of the MA (calculated by integrating MA myocardial tissue velocity signal) to both end-diastolic volume (A) and LV mass (B) shows a scaling exponent β larger than the corresponding ones for LV ejection times (see text for details). ▵, mice; ○, rats; ▴, rabbits; ▵, dogs; •, humans.
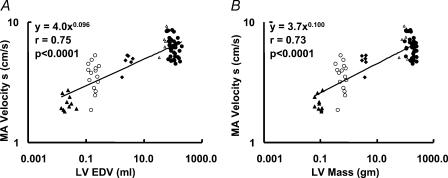
Indeed, a statistically significant scaling exponent of peak systolic velocity to both LV end-diastolic volume and LV mass was observed (βEDV= 0.096 ± 0.012 and βLVmass= 0.100 ± 0.013, P < 0.0001 when compared with 0 for both) (Fig. 6A and B).
Figure 6. Scaling of peak systolic velocity of the MA to end-diastolic volume (A) and LV mass (B).
MA velocity s, peak systolic velocity of the MA. ▵, mice; ○, rats; ▴, rabbits; ▵, dogs; •, humans.
A similar conclusion was made based on the measurements of the diastolic velocity. Indeed, the E-wave velocity scaled to LV end-diastolic volume and mass with even higher exponents (βEDV= 0.127 ± 0.018 and βLVmass= 0.129 ± 0.019, P < 0.0001 when compared with 0 for both).
Short-axis function and long-to-short axis displacement relationship
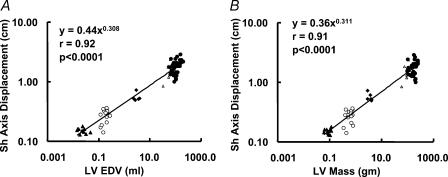
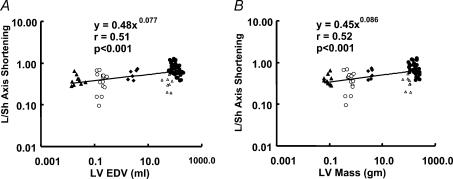
LV short-axis displacement scaled to LV end-diastolic volume with the power of βEDV= 0.308 ± 0.033, and to LV mass with the power of βLVmass= 0.311 ± 0.034. These values were not significantly different from the scaling power for the LV ejection time (P > 0.1) (Fig. 7A and B). As a result, the L/Sh axis displacement ratio showed significant scaling exponents (βEDV= 0.077 ± 0.017 and βLVmass= 0.086 ± 0.019, P < 0.0001 for both when compared with 0) (Fig. 8A and B).
Figure 7. Scaling of short-axis displacement to end-diastolic volume (A) and LV mass (B).
▵, mice; ○, rats; ▴, rabbits; ▵, dogs; •, humans.
Figure 8. Scaling of long-to-short axis (L/Sh) displacement ratio to end-diastolic volume (A) and LV mass (B).
▵, mice; ○, rats; ▴, rabbits; ▵, dogs; •, humans.
These results indicate that long- and short-axis displacements scale differently, and indicate limitations of the model outlined in our second proposition (see Methods, Background). Notably, the scaling power for the long-axis velocities predicted by the model was β= 0.083, while the experimental values for this parameter were in the range 0.096–0.129.
Intra- and interobserver variability in small rodents
Intra- and interobserver variability of reconstructed myocardial tissue velocity data is presented in Table 2. While, expectedly, relative variability of myocardial tissue displacement, and S- and E-wave velocities, was higher in mice than in rats, it was still in a satisfactory range.
Table 2.
Intra- and interobserver variability of reconstructed myocardial velocity data in the mouse and the rat
| Mouse Absolute (relative) | Rat Absolute (relative) | |
|---|---|---|
| Intraobserver | ||
| S-wave velocity (cm s−1 (%)) | 0.13 ± 0.09 (9.1 ± 6.2) | 0.27 ± 0.26 (3 ± 3) |
| E-wave velocity (cm s−1 (%)) | 0.18 ± 0.18 (9.7 ± 10.2) | 0.30 ± 0.20 (2.7 ± 2.7) |
| Displacement (cm (%)) | 0.004 ± 0.003 (11.7 ± 7.8) | 0.006 ± 0.005 (1.6 ± 1) |
| Interobserver | ||
| S-wave velocity (cm s−1 (%)) | 0.18 ± 0.13 (13.5 ± 9.1) | 0.23 ± 0.22 (6.3 ± 6.1) |
| E-wave velocity (cm s−1 (%)) | 0.19 ± 0.17 (9.7 ± 7.8) | 0.42 ± 0.38 (1.6 ± 1) |
| Displacement (cm (%)) | 0.004 ± 0.004 (12.0 ± 13.0) | 0.011 ± 0.008 (2.9 ± 2.5) |
Discussion
To our knowledge, this is the first report that shows that long-axis myocardial tissue velocities scale allometrically to heart size. This observation can be mechanistically linked to different scaling exponents of long-axis displacement and ejection time. Furthermore, we have shown that scaling exponents for long- and short-axis displacement are different. This difference resulted in a decreased impact of long-axis displacement on total ventricular output, as demonstrated by a smaller long-to-short axis displacement ratio in small mammals. Thus, it appears that heart size influences both contraction velocity and the pattern of cardiac contraction.
Previous studies
Schaefer et al. (2003) and Watson et al. (2004) noted that, when compared with humans, myocardial tissue velocities are smaller in mice and rats, respectively. However, no scaling of these data to ventricular size was attempted. Also, anaesthesia may have affected their measurement (Rottman et al. 2003). Interestingly, a recent paper noted that myocardial tissue velocities increase with cardiac growth in children (Eidem et al. 2004). While no quantitative relationship was shown between tissue velocities and either body or heart weight, it has been previously shown that, during individual growth, organ function is allometrically scaled to body size (Beunen et al. 1997). Thus, ample evidence corroborates that size-dependent scaling of myocardial tissue velocities occurs in mammals.
Significance of a scaling exponent
Many biological phenomena, including heart and circulation variables, scale with a power of 0.25 or its multiples versus the body mass. For example, the electrocardiogram RR interval scales with the power of 0.25 (West et al. 1997). Cardiac output and metabolism scale according to power of 0.75 (West et al. 1997; Lindstedt & Schaeffer, 2002), while LV contractility, SV and LV mass scale to animal size according to the power of 1 (West et al. 1997; Georgakopoulos et al. 1998; Lindstedt & Schaeffer, 2002). West et al. (1997) have hypothesized that the quarter-power scaling may be explained by the interplay of physical and geometric constraints that are implicit in the organ architecture, such as invariance of the smallest units (e.g. myocytes), tendency to minimize energy spent on the transport of resources, and fractal-like behaviour of the energy-supply branching network (e.g. circulatory system). Our data show that RR intervals and LV ejection time exhibit a scaling exponent compatible with the value of 0.25. In contrast, the scaling exponent for MA displacement was larger than that for LV ejection time, which led to the new observation that long-axis myocardial tissue velocities show scaling to the heart size. Our data are concordant with our second proposed model that predicts that if the ejection time scales with the exponent of 0.25, and if the displacement scales with the Euclidean exponent of 0.33, the resulting velocity should scale to the heart size with exponent of 0.083. We showed that scaling occurs with both systolic and diastolic velocities, although the observed values were slightly larger than the predicted by the model. Such discrepancy could be explained by our novel observation that exponents of short- and long-axis displacement scaling were different, which unexpectedly resulted in a significant scaling between the heart size and long-to-short axis displacement ratio.
Scaling, ventricular structure and function
It is safe to propose that ventricular function should reflect its structure. A ventricle composed of circumferentially orientated fibres would show predominant short-axis displacement. And, vice versa, a ventricle composed exclusively of longitudinally orientated fibres would display a piston-like behaviour, with predominant long-axis displacement. The fact that the normal human ventricle shows a complex and changing transmural fibre orientation (Rademakers et al. 1994), is logically reflected in its function by a significant amount of both long- and short-axis displacement during systolic contraction (Henein & Gibson, 1999; Aurigemma et al. 1995). Furthermore, since a large number of fibres are orientated neither parallel nor perpendicular to the long axis of the heart, a torsional component of the contraction is readily observed (Knudtson et al. 1997).
As previous work has shown that the degree and type of transmural change of fibre orientation is quantitatively very similar among species of different size, one could assume that the long-axis, short-axis and torsional components of contraction should show a constant proportion across all species (Grimm et al. 1976; Costa et al. 1997). In contrast, a recent paper reported that left ventricle of a mouse heart displays a total twist that is 10 times smaller than the one observed in humans (Henson et al. 2000). Since twist is an expression of fibre orientation (Ashikaga et al. 2004), one has to conclude that functional characteristics that reflect LV structure may be affected by the heart size. Furthermore, although not systematically assessed previously, it is well known that fractional shortening (short-axis displacement divided by initial short-axis diameter) is larger in smaller animals. For example, two independent groups reported average fractional shortening values of 52 and 56% in normal mice (Gardin et al. 1995; Yang et al. 1999), while the normal fractional shortening in man is only 33 ± 3% (Felner & Schlant, 1976). In contrast, a recent report that used three-dimensional imaging techniques has shown a mouse ejection fraction of 63 ± 5% (Dawson et al. 2004), which is very comparable to normal values of 67 ± 8% in humans. Thus, it seems obvious that relative contribution of long- versus short-axis function to overall ejection fraction markedly differs between the species. Our present results further extend these observations by demonstrating that heart size affects the contribution of long- versus short-axis displacement to total ventricular output in a predictable manner. The origin of interspecies differences in myocardial function that are influenced by heart size can only be speculated. McMahon analysed the fact that the ratio of length to diameter in major skeletal muscles is smaller in large mammals (McMahon, 1975). He conjectured that this type of scaling is due to elastic constraints imposed on a skeletal muscle, which, as a result, leads to specific scaling of the body shape to the weight of the organism. Some unknown elastic constraints might be affecting long-to-short axis function scaling of cardiac muscle. Another possible factor could be that LV fibres are rope-shaped structures built by myocytes, with basically invariant dimensions in different species (Torrent-Guasp et al. 2001). It is possible that the shape of this structure, which is essentially a one-dimensional object embedded in a three-dimensional matrix, exhibits scaling to heart size in order to accommodate the invariant myocyte dimensions.
Practical implications
For a long time, studies in comparative physiology have stressed similarities of the heart structure and function among various mammalian species. This is important as it enables translation of experimental data into the clinical domain. We have shown that while these assumptions still hold true qualitatively, there are quantitative differences that become important when data are compared among species that dramatically differ in size. Furthermore, since the velocities are lower in the very small mammalian hearts, they may be more difficult to measure accurately.
Limitations
First, different animal subjects were handled slightly differently. Sedation may have decreased LV systolic function in rabbits and rats (Rottman et al. 2003), while handling the nonanaesthetized mice may have brought catecholamine surge. On the other hand, mouse systolic function operates close to its contractility maximum (Reyes et al. 2003), and thus an additional contractility increase induced by the stress of the echocardiography examination would be small. Also, the RR intervals closely followed the predicted and previously described quarter-power allometric equation, implying that our data were collected in generally normal conditions. Second, limited resolution of the images obtained in mice was the underlying cause of the pronounced increase in intra- and interobserver variability reported in Table 2. Furthermore, it should be acknowledged that similar increases in intra- and interobserver variability might be expected for the other cardiac parameters measured directly (or indirectly) in mice versus the other species. Third, LV mass was not directly measured, but was instead estimated by the bullet equation. However, our supplemental data confirm that the measurement errors were within acceptable limits. Of note, there was no systematic measurement bias in the echo estimates, while the 95% confidence intervals in mice, although wider than in other animal species, were within acceptable limits and consistent with the previously published validation study (Collins et al. 2001). Finally, some methodological limitations of applying power function in biological sciences have been raised (Smith, 1984).
In conclusion, we have shown that long-axis myocardial tissue velocities express allometric scaling to the heart size. This observation can be mechanistically linked to observed differences in the scaling exponents of long-axis displacement and ejection time. Interestingly, scaling exponents for long- and short-axis displacement were also different. This reduced the long- versus short-axis contribution to heart function in very small mammals.
Acknowledgments
This study was supported in part by a National American Heart Association grant 0235172 N to Dr Cheng and through grants by the National Space Biomedical Research Institute through NASA NCC 9-58 (Houston, TX), the Department of Defense (Ft. Dietrick, Md, USAMRMC grant No. 02360007), and by the National Institutes of Health, National Center for Research Resources, General Clinical Research Center (grant MO1 RR-018390).
Supplemental material
The online version of this paper can be accessed at:
DOI: 10.1113/jphysiol.2005.090779
http://jp.physoc.org/cgi/content/full/jphysiol.2005.090779/DC1and contains supplemental material consisting of a figure entitled: Comparison of the LV mass estimated by twodimensional echocardiography using the bullet equation with the gold standard.
This material can also be found as part of the full-text HTML version available from http://www.blackwell-synergy.com
References
- Ashikaga H, Criscione JC, Omens JH, Covell JW, Ingels NB., Jr Transmural left ventricular mechanics underlying torsional recoil during relaxation. Am J Physiol Heart Circ Physiol. 2004;286:H640–647. doi: 10.1152/ajpheart.00575.2003. [DOI] [PMC free article] [PubMed] [Google Scholar]
- Askari AT, Unzek S, Popovic ZB, Goldman CK, Forudi F, Kiedrowski M, Rovner A, Ellis SG, Thomas JD, DiCorleto PE, Topol EJ, Penn MS. Effect of stromal-cell-derived factor 1 on stem-cell homing and tissue regeneration in ischaemic cardiomyopathy. Lancet. 2003;362:697–703. doi: 10.1016/S0140-6736(03)14232-8. [DOI] [PubMed] [Google Scholar]
- Aurigemma GP, Silver KH, Priest MA, Gaasch WH. Geometric changes allow normal ejection fraction despite depressed myocardial shortening in hypertensive left ventricular hypertrophy. J Am Coll Cardiol. 1995;26:195–202. doi: 10.1016/0735-1097(95)00153-q. [DOI] [PubMed] [Google Scholar]
- Beunen GP, Rogers DM, Woynarowska B, Malina RM. Longitudinal study of ontogenetic allometry of oxygen uptake in boys and girls grouped by maturity status. Ann Hum Biol. 1997;24:33–43. doi: 10.1080/03014469700004752. [DOI] [PubMed] [Google Scholar]
- Collins KA, Korcarz CE, Shroff SG, Bednarz JE, Fentzke RC, Lin H, Leiden JM, Lang RM. Accuracy of echocardiographic estimates of left ventricular mass in mice. Am J Physiol Heart Circ Physiol. 2001;280:H1954–1962. doi: 10.1152/ajpheart.2001.280.5.H1954. [DOI] [PubMed] [Google Scholar]
- Costa KD, May- Newman K, Farr D, O'Dell WG, McCulloch AD, Omens JH. Three-dimensional residual strain in midanterior canine left ventricle. Am J Physiol Heart Circ Physiol. 1997;273:H1968–1976. doi: 10.1152/ajpheart.1997.273.4.h1968. [DOI] [PMC free article] [PubMed] [Google Scholar]
- Dawson D, Lygate CA, Saunders J, Schneider JEYeX, Hulbert K, Noble JA, Neubauer S. Quantitative 3-dimensional echocardiography for accurate and rapid cardiac phenotype characterization in mice. Circulation. 2004;110:1632–1637. doi: 10.1161/01.CIR.0000142049.14227.AD. [DOI] [PubMed] [Google Scholar]
- Dawson-Saunders B, Trapp RG. Basic and Clinical Biostatistics. East Norwalk, CT: Appleton and Lange; 1990. [Google Scholar]
- Derumeaux G, Mulder P, Richard V, Chagraoui A, Nafeh C, Bauer F, Henry JP, Thuillez C. Tissue Doppler imaging differentiates physiological from pathological pressure-overload left ventricular hypertrophy in rats. Circulation. 2002;105:1602–1608. doi: 10.1161/01.cir.0000012943.91101.d7. [DOI] [PubMed] [Google Scholar]
- Eidem BW, McMahon CJ, Cohen RR, Wu J, Finkelshteyn I, Kovalchin JP, Ayres NA, Bezold LI, O'Brian Smith E, Pignatelli RH. Impact of cardiac growth on Doppler tissue imaging velocities: a study in healthy children. J Am Soc Echocardiogr. 2004;17:212–221. doi: 10.1016/j.echo.2003.12.005. [DOI] [PubMed] [Google Scholar]
- Felner JM, Schlant RC. Echocardiography: a Teaching Atlas. New York: Grune and Stratton; 1976. [Google Scholar]
- Gardin JM, Siri FM, Kitsis RN, Edwards JG, Leinwand LA. Echocardiographic assessment of left ventricular mass and systolic function in mice. Circ Res. 1995;76:907–914. doi: 10.1161/01.res.76.5.907. [DOI] [PubMed] [Google Scholar]
- Georgakopoulos D, Mitzner WA, Chen CH, Byrne BJ, Millar HD, Hare JM, Kass DA. In vivo murine left ventricular pressure–volume relations by miniaturized conductance micromanometry. Am J Physiol Heart Circ Physiol. 1998;274:H1416–1422. doi: 10.1152/ajpheart.1998.274.4.H1416. [DOI] [PubMed] [Google Scholar]
- Grimm AF, Katele KV, Lin HL. Fiber bundle direction in the mammalian heart. An extension of the ‘nested shells’ model. Basic Res Cardiol. 1976;71:381–388. doi: 10.1007/BF01910776. [DOI] [PubMed] [Google Scholar]
- Henein MY, Gibson DG. Long axis function in disease. Heart. 1999;81:229–231. doi: 10.1136/hrt.81.3.229. [DOI] [PMC free article] [PubMed] [Google Scholar]
- Henson RE, Song SK, Pastorek JS, Ackerman JJ, Lorenz CH. Left ventricular torsion is equal in mice and humans. Am J Physiol Heart Circ Physiol. 2000;278:H1117–1123. doi: 10.1152/ajpheart.2000.278.4.H1117. [DOI] [PubMed] [Google Scholar]
- Knudtson ML, Galbraith PD, Hildebrand KL, Tyberg JV, Beyar R. Dynamics of left ventricular apex rotation during angioplasty: a sensitive index of ischemic dysfunction. Circulation. 1997;96:801–808. doi: 10.1161/01.cir.96.3.801. [DOI] [PubMed] [Google Scholar]
- Lindstedt L, Schaeffer PJ. Use of allometry in predicting anatomical and physiological parameters of mammals. Lab Anim. 2002;36:1–19. doi: 10.1258/0023677021911731. [DOI] [PubMed] [Google Scholar]
- McMahon TA. Using body size to understand the structural design of animals: quadrupedal locomotion. J Appl Physiol. 1975;39:619–627. doi: 10.1152/jappl.1975.39.4.619. [DOI] [PubMed] [Google Scholar]
- Noujaim SF, Lucca E, Munoz V, Persaud D, Berenfeld O, Meijler FL, Jalife J. From mouse to whale: a universal scaling relation for the PR interval of the electrocardiogram of mammals. Circulation. 2004;110:2802–2808. doi: 10.1161/01.CIR.0000146785.15995.67. [DOI] [PubMed] [Google Scholar]
- Plehn JF, Foster E, Grice WN, Huntington-Coats M, Apstein CS. Echocardiographic assessment of LV mass in rabbits: models of pressure and Volume overload hypertrophy. Am J Physiol Heart Circ Physiol. 1993;265:H2066–2072. doi: 10.1152/ajpheart.1993.265.6.H2066. [DOI] [PubMed] [Google Scholar]
- Pombo JF, Troy BL, Russell RO., Jr Left ventricular volumes and ejection fraction by echocardiography. Circulation. 1971;43:480–490. doi: 10.1161/01.cir.43.4.480. [DOI] [PubMed] [Google Scholar]
- Popovic ZB, Grimm RA, Perlic G, Chinchoy E, Geraci M, Sun JP, Donal E, Xu XF, Greenberg NL, Wilkoff BL, Thomas JD. Noninvasive assessment of cardiac resynchronization therapy for congestive heart failure using myocardial strain and left ventricular peak power as parameters of myocardial synchrony and function. J Cardiovasc Electrophysiol. 2002;13:1203–1208. doi: 10.1046/j.1540-8167.2002.01203.x. [DOI] [PubMed] [Google Scholar]
- Prothero J. Heart weight as a function of body weight in mammals. Growth. 1979;43:139–150. [PubMed] [Google Scholar]
- Rademakers FE, Rogers WJ, Guier WH, Hutchins GM, Siu CO, Weisfeldt ML, Weiss JL, Shapiro EP. Relation of regional cross-fiber shortening to wall thickening in the intact heart. Three-dimensional strain analysis by NMR tagging. Circulation. 1994;89:1174–1182. doi: 10.1161/01.cir.89.3.1174. [DOI] [PubMed] [Google Scholar]
- Reichek N, Helak J, Plappert T, Sutton MS, Weber KT. Anatomic validation of left ventricular mass estimates from clinical two-dimensional echocardiography: initial results. Circulation. 1983;67:348–352. doi: 10.1161/01.cir.67.2.348. [DOI] [PubMed] [Google Scholar]
- Reyes M, Freeman GL, Escobedo D, Lee S, Steinhelper ME, Feldman MD. Enhancement of contractility with sustained afterload in the intact murine heart: blunting of length-dependent activation. Circulation. 2003;107:2962–2968. doi: 10.1161/01.CIR.0000070964.96190.67. [DOI] [PubMed] [Google Scholar]
- Rottman JN, Ni G, Khoo M, Wang Z, Zhang W, Anderson ME, Madu EC. Temporal changes in ventricular function assessed echocardiographically in conscious and anesthetized mice. J Am Soc Echocardiogr. 2003;16:1150–1157. doi: 10.1067/S0894-7317(03)00471-1. [DOI] [PubMed] [Google Scholar]
- Schaefer A, Klein G, Brand B, Lippolt P, Drexler H, Meyer GP. Evaluation of left ventricular diastolic function by pulsed Doppler tissue imaging in mice. J Am Soc Echocardiogr. 2003;16:1144–1149. doi: 10.1067/S0894-7317(03)00679-5. [DOI] [PubMed] [Google Scholar]
- Smith RJ. Allometric scaling in comparative biology: problems of concept and method. Am J Physiol Regul Integr Comp Physiol. 1984;246:R152–160. doi: 10.1152/ajpregu.1984.246.2.R152. [DOI] [PubMed] [Google Scholar]
- Sun JP, Popovic ZB, Greenberg NL, Xu XF, Asher CR, Stewart WJ, Thomas JD. Noninvasive quantification of regional myocardial function using Doppler-derived velocity, displacement, strain rate, and strain in healthy volunteers: effects of aging. J Am Soc Echocardiogr. 2004;17:132–138. doi: 10.1016/j.echo.2003.10.001. [DOI] [PubMed] [Google Scholar]
- Torrent-Guasp F, Buckberg GD, Clemente C, Cox JL, Coghlan HC, Gharib M. The structure and function of the helical heart and its buttress wrapping. I. The normal macroscopic structure of the heart. Semin Thorac Cardiovasc Surg. 2001;13:301–319. doi: 10.1053/stcs.2001.29953. [DOI] [PubMed] [Google Scholar]
- Watson LE, Sheth M, Denyer RF, Dostal DE. Baseline echocardiographic values for adult male rats. J Am Soc Echocardiogr. 2004;17:161–167. doi: 10.1016/j.echo.2003.10.010. [DOI] [PubMed] [Google Scholar]
- West GB, Brown JH, Enquist BJ. A general model for the origin of allometric scaling laws in biology. Science. 1997;276:122–126. doi: 10.1126/science.276.5309.122. [DOI] [PubMed] [Google Scholar]
- Wyatt HL, Heng MK, Meerbaum S, Hestenes JD, Cobo JM, Davidson RM, Corday E. Cross-sectional echocardiography. I. Analysis of mathematic models for quantifying mass of the left ventricle in dogs. Circulation. 1979;60:1104–1113. doi: 10.1161/01.cir.60.5.1104. [DOI] [PubMed] [Google Scholar]
- Yang XP, Liu YH, Rhaleb NE, Kurihara N, Kim HE, Carretero OA. Echocardiographic assessment of cardiac function in conscious and anesthetized mice. Am J Physiol Heart Circ Physiol. 1999;277:H1967–1974. doi: 10.1152/ajpheart.1999.277.5.H1967. [DOI] [PubMed] [Google Scholar]
- Zar JH. Biostatistical Analysis. Englewood Cliffs, NJ: Prentice Hall; 1984. [Google Scholar]
Associated Data
This section collects any data citations, data availability statements, or supplementary materials included in this article.


