

Abstract
Objective
Endoventricular patch plasty (the Dor procedure) has gained favor as a surgical treatment for heart failure associated with large anteroapical myocardial infarction. We tested the hypothesis that the Dor procedure reduces left ventricular volume, increases end-systolic elastance, decreases diastolic compliance, and maintains left ventricular function.
Methods
In 6 male Dorsett sheep, the left anterior descending coronary artery and its second diagonal branch were ligated 40% of the distance from apex to base. Sixteen weeks after myocardial infarction, a Dor procedure was performed with a Dacron patch that was 50% of the infarct neck dimension. Absolute left ventricular volume was measured with magnetic resonance imaging, and left ventricular pressure and relative left ventricular volume changes during pharmacologic preload reduction were measured with a volume conductance catheter 2 weeks before and 2 and 6 weeks after the Dor procedure. End-systolic elastance, diastolic compliance, and Starling relationships were calculated from the resultant left ventricular pressure/volume loops.
Results
Two weeks after the Dor procedure, the left ventricular volume at end systole and end diastole was significantly reduced, and there was no redilation at 6 weeks. Six weeks after the Dor procedure, the ejection fraction was significantly increased. Although stroke volume increased slightly at 6 weeks, the change was not significant. The slopes of end-systolic elastance, diastolic compliance, and Starling relationships were unchanged at 2 and 6 weeks.
Conclusions
The Dor procedure significantly reduces left ventricular volume. Unlike linear repair, left ventricular volume changes seem stable. The ejection fraction is improved, and left ventricular function (stroke volume and the Starling relationship) is maintained.
Heart failure from ischemic cardiomyopathy is an increasing medical and economic problem, and the need for improved medical and surgical therapy is clear. Surgical ventricular restoration (SVR) operations have been designed to restore left ventricular (LV) size, shape, and wall stress to pre–myocardial infarction (MI) values, and it is hoped that this will lead to improved survival. SVR operations build on the success of medical therapies that stabilize LV volume after MI and improve mortality. In general, these operations propose to reduce the increased end-diastolic (ED) wall stress that occurs after MI.1 ED wall stress leads to eccentric LV hypertrophy (remodeling)2 and eventually leads to decompensation and heart failure. High border-zone stress and nonischemic infarct extension3,4 may also be particularly important.
In 1984, Dor used endoventricular circular patch plasty (the Dor procedure*) to restore LV size and shape by excluding the infarcted anterior LV wall and the interventricular septum in patients with ischemic cardiomyopathy and either an akinetic or dyskinetic anterior wall.5 The Dor procedure is theoretically better than linear aneurysm plication because plication fails to exclude the infarcted interventricular septum.6
Although studies have reported the Dor procedure to be safe,7 the effect of the isolated Dor procedure is unknown. Because Dor procedures are often performed with concomitant coronary bypass and mitral valve repair,7 improvement in postoperative systolic function may be from the coronary bypass and not from the Dor procedure. In addition, the mechanical effect of SVR operations is complex and depends on how the procedure affects both end-systolic (ES) and ED pressure/volume relationships (ESPVR and EDPVR, respectively; ES elastance [EES] and diastolic compliance [DC]) and how those changes combine to effect ventricular function as measured by the Starling relationship.8 This was demonstrated by Batista’s operation, in which the effect on DC was greater than on EES, thus leading to a net reduction in the Starling relationship.8
Finally, redilation has been noted after LV patch aneurysmorrhaphy.9 However, it has not been clear whether the redilation noted in Dor’s series was caused by the SVR per se or was the result of progressive coronary or mitral valve disease.
In this study, we measured LV volume, chamber stiffness (EES and DC), and function in sheep with anteroapical MI 2 weeks before and 2 and 6 weeks after the Dor procedure. The sheep anteroapical infarct model is highly reproducible. For instance, because sheep do not have preformed intra-arterial collaterals, the amount of infarcted myocardium is 22.9% ± 2.5%.10 In addition, LV ED volume increases by 98% and ejection fraction decreases from 71.2% to 39.7% 10 weeks after infarction without significant changes of EES, DC, or the Starling relationship.11 We tested the hypotheses that the Dor procedure reduces LV volume, increases EES, decreases DC, and maintains LV function (Starling relationship).
Materials and Methods
Animals used in this study were treated in compliance with the “Guide for the Care and Use of Laboratory Animals” prepared by the Institute of Laboratory Animal Resources, National Research Council, and published by the National Academy Press (revised 1996).
Myocardial Infarction
Six adult sheep underwent anteroapical MI as previously described.10 In brief, castrated male Dorsett sheep were anesthetized (ketamine 33 mg/kg intramuscularly; isoflurane maintenance, 2%–4% inspired), and their lungs were mechanically ventilated (tidal volume, 15 mL/kg; model 309-0612-800; Ohio Medical Products, Madison, Wis). During a left thoracotomy, ligatures were placed around the left anterior descending artery and its second diagonal branch at a point 40% of the distance from the apex to the base and sequentially tightened, thus causing an anteroapical MI. When present, branches of the posterior descending artery, which also supply this region, were ligated 20% of the distance from the apex to the base. After the thoracotomy was closed, the sheep recovered from anesthesia.
Dor Procedure
Sixteen weeks after MI, a partial lower sternotomy was performed with the sheep under general anesthesia. Pericardial adhesions were divided. The right femoral artery and inferior vena cava were cannulated to establish cardiopulmonary bypass (Sarns Roller Blood Pump [Ann Arbor, Mich] and model 541 Medtronic Affinity NT Hollow Fiber Oxygenator [Minneapolis, Minn]). The procedure was performed with the LV warm and beating. An elliptical Dacron patch was fashioned so that the major and minor axes were 50% of the corresponding infarct neck on magnetic resonance imaging (MRI). An incision was made in the apical infarct, and the transition between infarcted aneurysm and uninfarcted myocardium was determined by inspection and palpation. The patch was positioned parallel to the septum and sutured to the line of transition with interrupted 2-0 Ethibond Excel suture (Ethicon, Somerville, NJ). All dyskinetic portions of the anterior wall and septum were excluded. The LV incision was closed in an edge-to-edge fashion with running 3-0 Prolene suture (Ethicon). Bypass was discontinued, the sternotomy was closed, and sheep recovered from anesthesia.
Volume Conductance Catheter
Two weeks before and 2 and 6 weeks after the Dor procedure, the sheep were anesthetized and intubated as described previously. A calibrated 7F Mikro-Tip pressure/volume combination catheter (model SPC-570; Millar Instruments Inc, Houston, Tex) was advanced into the LV via the right carotid artery, and an 8F thermo-dilution catheter (Abbott Laboratories Inc, Chicago, Ill) was introduced into the pulmonary artery via the right jugular vein under fluoroscopic guidance. Positioning of the volume conductance and pulmonary artery catheters was further confirmed by pressure waveform and segmental conductance signals (conductance catheter only). Lidocaine (100 mg intravenously [IV]), metaprolol (5 mg/kg IV), and atropine (1.0 mg IV) were administered before data collection, and all data were collected with the same level of anesthesia (1% inspired isoflurane). Volume conductance catheter output was collected with the ventilator temporarily suspended during pharmacologic preload reduction with nitroglycerin (2.0 mg IV) sufficient to decrease LV systolic pressure by more than 40 mm Hg.
The conductance catheter was connected to a signal generator (model Sigma-5-DF; Leycom, Oegsteest, The Netherlands) by using the dual-field mode. Blood conductance was measured in a 4-electrode cuvette.12 The pressure signals were amplified by using a Millar transducer control unit (model TCB-600; Millar Instruments). Processed pressure and volume signals were simultaneously collected with an analog acquisition system (model ACQ-16; Gould Instrument Systems Inc, Valley View, Ohio).
Magnetic Resonance Imaging
MRIs were obtained immediately after pressure/volume data collection. Each sheep was placed in a sealed Plexiglas container and transported to the magnetic resonance scanner. The animal was positioned laterally recumbent on its left side in the magnet (Siemens Symphony MRI scanner, 1.5 T with quantum gradients; Siemens Medical Systems, Iselin, NJ) with its chest centered in a Helmholtz coil. A series of tagged MRIs in orthogonal short- and long-axis planes was obtained. MRI data acquisition was triggered by the R wave of the electrocardiogram.
MRI Analysis
A modified version of the tagged-MRI postprocessing software Findtags (Laboratory of Cardiac Energetics, National Institutes of Health, Bethesda, Md) was used to contour the endocardial and epicardial surfaces of each slice, which had 8 t o 1 2 images separated by 40 milliseconds. The space between slices was uniformly 6 mm. Endocardial and epicardial surfaces were formed by using a Delaunay triangulation13 of contour points in 3 dimensions. Ventricular volume measured by MRI (VMRI) was calculated by piecewise integration of the volume enclosed by the endocardial surface throughout the cardiac cycle. For MRI image sets, ED was defined as the first image of the set. The image with the smallest volume was defined as ES. LV stroke volume and ejection fraction were calculated from the ES and ED volumes. The dimensions of the LV chamber at both ED and ES were measured from MRIs by using ImageJ (version 1.32J; Wayne Rasband, National Institutes of Health). The dimension of the LV long axis was defined as a linear distance from the midpoint of the mitral annulus plane to the apex, and the dimension of the short axis was defined as the linear distance from the anterior endocardium to the posterior endocardium at the midpapillary muscle plane.
Conductance Catheter Analysis
Five beats were selected from the volume conductance catheter before pharmacologic preload reduction to obtain cardiac baseline values. Fifteen beats were selected from each pharmacologic preload reduction by using custom software written in Labview (National Instruments Corporation, Austin, Tex). ED was defined as 40 milliseconds before 40% of the maximum positive rate of rise of LV pressure. ES was identified as the point of maximal elastance.14
Relative LV volume (VCOND) changes during pharmacologic preload reduction were measured with the conductance catheter. Absolute LV volume (LVVi) was obtained by modifying the VCOND by using the volume measured from tagged MRIs (VMRI) according to the following equation:
where VCONDi is the LV relative volume measured from the conductance catheter at time i, VCONDED is the LV relative volume measured at ED of the first beat after nitroglycerin injection, and VMRIED is the corresponding volume measured from tagged MRIs at ED. The methods of EES and DC determination have been described in detail previously.11
The Starling relationships were calculated from the ESPVR and EDPVR. First, the elastance of the artery was calculated as the slope connecting points at 100 mm Hg on the ESPVR to 20 mm Hg on the EDPVR. Stroke volume was then computed between the curves of ESPVR and EDPVR while keeping this artery elastance constant. Finally, the Starling relationship was determined by each point on the EDPVR and its corresponding stroke volume.
Statistical Analysis
All values are expressed as mean ± SD and compared by repeated-measures analysis with a mixed model to test for both fixed and random effects. We performed the analysis by using SAS PROC MIXED (SAS for Windows, version 9.1; SAS Institute, Cary, NC), which uses a maximum likelihood or restricted maximum likelihood estimation technique, as opposed to ordinary least squares. As a consequence, subjects with missing data were not automatically deleted from the analysis. Also, variables can be either continuous or categorical, and relationships between the variables can be linear or curvilinear because the mixed model does not assume a normal distribution.15
Results
All 6 infarcted sheep survived the Dor procedure and completed the entire protocol. None of the sheep required ino-tropic support after surgery. Weight loss was minimal. Repeated-measures analysis of baseline heart rate, left ventricular pressure at ES and ED, isovolumic relaxation period, systolic and diastolic pulmonary arterial pressures, and artery elastance found no significant difference before and after the Dor procedure (Table 1).
TABLE 1.
Repeated measures of baseline values and left ventricular chamber geometry
| Variable | 2 wk before Dor procedure | 2 wk after Dor procedure | 6 wk after Dor procedure |
|---|---|---|---|
| Weight (kg) | 40.0 ± 10.7 | 38.8 ± 8.1 | 39.2 ± 9.5 |
| Heart rate (bpm) | 84.6 ± 10.0 | 77.0 ± 11.2 | 80.2 ± 19.5 |
| LVP at ES (mm Hg) | 101.2 ± 10.9 | 100.6 ± 17.6 | 106.2 ± 16.9 |
| LVP at ED (mm Hg) | 10.5 ± 3.9 | 17.2 ± 6.1 | 13.3 ± 8.8 |
| TAU (ms) | 44.1 ± 3.5 | 51.5 ± 14.0 | 47.9 ± 8.4 |
| PAS (mm Hg) | 16.0 ± 6.4 | 19.8 ± 7.7 | 20.8 ± 7.4 |
| PAD (mm Hg) | 8.0 ± 2.9 | 10.5 ± 4.0 | 11.3 ± 6.0 |
| Ea (mm Hg/mL) | 3.27 ± 0.94 | 3.57 ± 1.80 | 3.27 ± 1.42 |
| Long axis at ED (mm) | 89.3 ± 7.4 | 64.2 ± 4.9* | 62.6 ± 4.0* |
| Long axis at ES (mm) | 81.0 ± 4.2 | 57.0 ± 4.6* | 57.7 ± 4.8* |
| Short axis† at ED (mm) | 39.3 ± 7.1 | 36.8 ± 4.5 | 37.3 ± 4.0 |
| Short axis† at ES (mm) | 33.6 ± 6.8 | 30.5 ± 5.8 | 30.5 ± 4.0 |
Values are expressed as mean ± SD. No significant difference was found between values 2 and 6 weeks after the Dor procedure. LVP, Left ventricular pressure; ES, end-systole; ED, end-diastole; TAU, isovolumic relaxation period; PAS, systolic pulmonary arterial pressure; PAD, diastolic pulmonary arterial pressure; Ea, elastance of artery.
Significantly different (P < .01) when compared with values 2 weeks before the Dor procedure.
Values of the short axis were measured at the midpapillary plane.
The LV aneurysm neck dimension was 4.97 ± 0.48 cm × 4.33 ± 0.53 cm. Dacron (DuPont, Wilmington, Del) patches sized 2.48 ± 0.24 cm × 2.17 ± 0.27 cm were used for the Dor procedure. MRIs showed that the Dor procedure excluded the entire dyskinetic anterior LV aneurysm and dyskinetic septum by using a patch (Figure 1). LV aneurysms in all sheep were dyskinetic as measured with the center-line method (Figure 2).
Figure 1.
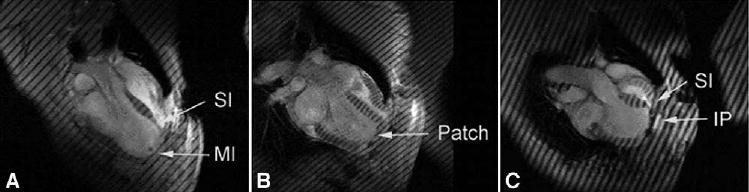
Long-axis magnetic resonance images A, after MI; B, 2 weeks after the Dor procedure; and C, 2 weeks after plication in sheep. MI, Dyskinetic infarct; SI, septal infarct; IP, infarct plication. All images were obtained at end systole. Note that the LV shapes obtained with plication and the Dor procedure are significantly different. For instance, the postplication shape (C) is very globular, with acute bending at the plication. The LV shape after the Dor procedure, although it seems rectangular, is less spherical and more ellipsoidal than that after plication (B).
Figure 2.
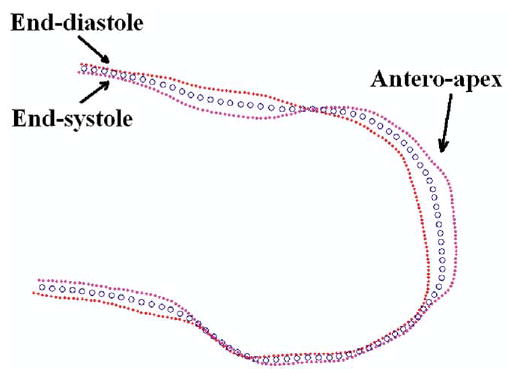
LV wall motion was measured by using the center-line method (blue circles are the center line). The endocardium was contoured from long-axis tagged magnetic resonance images at both the end-systolic (pink dots) and end-diastolic (red dots) phases. The anteroapical aneurysms in all 6 sheep were dyskinetic.
Two weeks after the Dor procedure, LV volume and LV long axes at ES and ED were significantly reduced, and there was no redilation at 6 weeks. Six weeks after the Dor procedure, the ejection fraction was significantly increased. Although the stroke volume increased slightly at 6 weeks, the change was not significant (Figure 3 and Table 1).
Figure 3.
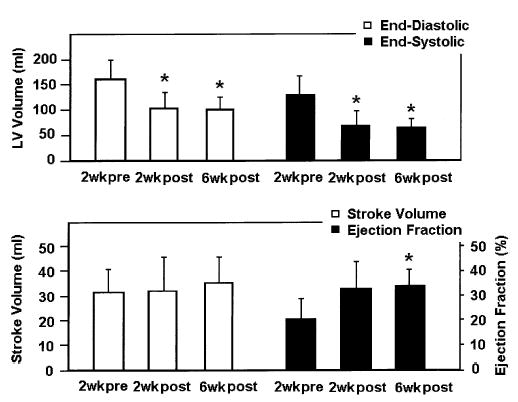
LV volume measurements at 2 weeks before and 2 and 6 weeks after the Dor procedure. End-diastolic LV volumes were 161.6 ± 37.1 mL, 99.9 ± 32.0 mL, and 101.3 ± 22.2 mL, respectively (P = .0003). End-systolic LV volumes were 130.1 ± 36.0 mL, 68.0 ± 29.5 mL, and 66.3 ± 14.3 mL, respectively (P = .0008). LV at both ED and ES did not redilate at 6 weeks after the Dor procedure. LV stroke volume did not change significantly (31.5 ± 9.4 mL before vs 31.9 ± 13.9 mL and 35.0 ± 10.8 mL at 2 and 6 weeks after the Dor procedure, respectively; P = .543). Ejection fraction improved (0.21 ± 0.08 before vs 0.33 ± 0.11 and 0.34 ± 0.07 at 2 and 6 weeks after the procedure, respectively; P = .041). When compared with the value at 2 weeks before the Dor procedure, the ejection fraction was significantly improved 6 weeks afterward (P = .014). *P < .05 compared with the 2-week pre–Dor procedure value.
LV chamber stiffness did not increase after the Dor procedure. There were no significant differences in the slopes of pressure/volume curves for EES and DC (Figures 4 and 5).
Figure 4.
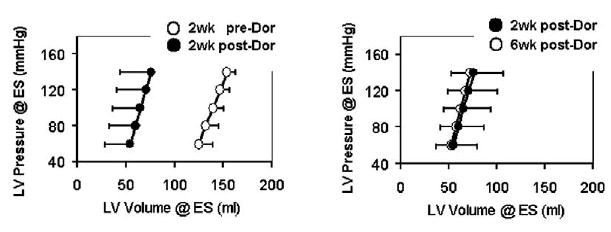
The effect of the Dor procedure on end-systolic elastance. EES equals the slope of the ESPVR curve. EES was 3.90 ± 2.39, 4.38 ± 2.27, and 4.67 ± 2.20 at these 3 time periods (P = .808). ESPVR moved to the left in parallel after the Dor procedure. The y-intercept was −326.5 ± 179.3, −149.3 ± 60.1, and −178.6 ± 128.3 for the 3 time periods (P = .031). The curve did not shift back to the preoperative value at 6 weeks after the Dor procedure (P = .80 when comparing the values at 2 and 6 weeks after the Dor procedure). The average r2 values of individual regression analyses were 0.95, 0.98, and 0.97.
Figure 5.
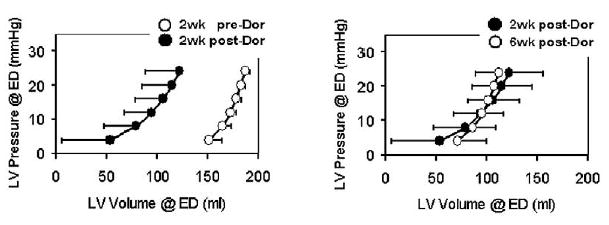
The effect of the Dor procedure on diastolic compliance. DC, which equals the exponential term of the EDPVR curve, was 0.053 ± 0.025, 0.040 ± 0.028, and 0.058 ± 0.041 at these 3 time periods (P = .706). EDPVR moved to the left after the Dor procedure. The multipliers were 0.021 ± 0.027, 1.74 ± 2.30, and 0.66 ± 0.85 (P = .148). The curve did not shift back to the preoperative value at 6 weeks after the Dor procedure. The average r2 values of individual regression analyses were 0.89, 0.76, and 0.90.
LV function as assessed by Starling relationship was unchanged (Figure 6). The Starling curves after the Dor procedure did become slightly steeper at 2 weeks. However, the difference was not significant.
Figure 6.
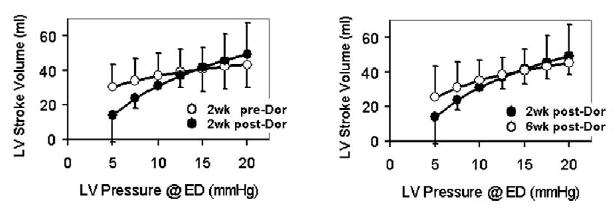
The effect of the Dor procedure on the Frank-Starling relationship. The Starling curves were computed when the LV end-systolic pressure was 100 mm Hg and the end-diastolic pressure was 20 mm Hg. The Starling curves did not change significantly after the Dor procedure (P = .769).
Discussion
The Dor procedure significantly reduced LV volume and improved ejection fraction. However, LV function was maintained. Specifically, the ESPVR and EDPVR shifted in parallel. EES and DC did not change significantly. As a result, the acute postoperative pump function (Starling relationship) was unchanged. Finally, LV volume changes were stable at 6 weeks.
LV Function After the Dor Procedure
The effect of SVR o n ventricular function is difficult to determine from clinical data given that the operations often include concomitant coronary bypass and mitral valve repair. For instance, EES has previously been noted to improve after the Dor procedure in humans. Tanoue and colleagues16 used cardiac catheter data and a single-beat method of EES estimation, and Schreuder and colleagues17 used a conductance catheter to measure EES. However, all of Tanoue’s patients and 7 o f 9 patients in Schreuder’s study received coronary artery bypass grafts. Because they isolate the effect of SVR, experimental studies in sheep11 and in rodents18 and mathematical simulations1,19,20 are critical.
The acute change in pump function (Starling relationship) after SVR may be related to the degree of volume reduction. For example, our previous study of linear aneurysm repair (plication) in the same sheep model found that plication caused a similar parallel shift in the ESPVR and EDPVR but a small downward shift in the Starling relationship.11 The sheep model and the methods used in the 2 studies were similar.11 However, the degree of volume reduction with plication was greater (41% reduction in ED LV volume) than with the Dor procedure (29% reduction).11
A review of animal studies and mathematical simulations suggests that the postoperative pump function (Starling relationship) after SVR may also be related to the contractility of the excluded LV wall. For instance, partial ventri-culectomy (Batista’s operation) is probably the worst case because it removes functioning (although weakened) myocardium. Lumped parameter20 and finite element1 simulations show that the EDPVR shifts further to the left than the ESPVR. As a consequence, the Starling relationship is substantially depressed.1,20
We agree with Artrip and colleagues20 that exclusion of akinetic myocardium (the SAVER operation21) has an effect on LV function that is midway between exclusion of noncontractile myocardium (Dor procedure) and Batista’s operation. Using finite element simulations, we have recently shown that akinetic scar must contain contractile myocardium.22 As a consequence, methods able to determine the residual contractility reserve of the excluded akinetic anterior wall, including dobutamine stress echocardiography23 and tagged MRI,2 should be of significant benefit.
LV Volume and Postoperative Remodeling
As described previously, redilation has been recorded after SVR procedures. For instance, Dor and associates’9 clinical outcome data suggested that patients who underwent LV patch aneurysmorrhaphy experienced LV redilation and an increase in ES and ED ventricular volume of 22% and 29%, respectively, 1 year after the procedure. However, it has not been clear whether the redilation noted in Dor and colleagues’ series was caused by the SVR per se or was the result of progressive coronary or mitral valve disease.
Our study of linear aneurysm plication in the sheep model found that the LV redilated and that the LV volumes at both ED and ES returned to preplication values at 6 weeks.11 Also, in rats with ischemic cardiomyopathy, infarct plication caused an initial 25.8% reduction in LV ED volume, but volume returned nearly to preoperative values at 4 weeks.18 This is in contrast to the present study, in which LV redilation was not seen 6 weeks after Dor procedure. This suggests that the Dor procedure is a better antiremodeling operation than linear plication.
Effect on Stress
Redilation may be caused by LV wall stress. However, calculation of wall stress after SVR requires a detailed finite element stress analysis.24 Infarct plication fails to exclude the septal infarct, and a high-stress area in and around the septal infarct should remain. Also, nonischemic infarct extension, which is caused by high systolic border-zone stress and subsequent myocyte extension during isovolumic systole,3,4 may be prevented by the stress reduction produced by the Dor procedure.
Second, plication causes bending in the border zone and remote myocardium. This is clearly seen in the postplication echocardiographic images shown previously by Ratcliffe and associates (figure 2 of Ratcliffe and associates11) and in a similar MRI image obtained 2 weeks after aneurysm plication in sheep (Figure 1). Bending of the LV wall may cause epicardial tensile and endocardial compressive stress.
Limitations and Future Directions
The need for combined MRI/conductance catheter LV volume methodology is the principal limitation of this study. It is important to accurately estimate the absolute LV volume when assessing heart function with a volume conductance catheter because an offset between the true LV volume and the conductance-derived volume is common. To obtain reliable ventricular volume, tagged MRI, which provides 3-dimensional LV volume measurement from aspects of both the long axis and the short axis, was used in this study to modify the relative volume measured by the volume conductance catheter.
In the present study, LV re-dilation was not seen 6 weeks after the Dor procedure. However, this relatively short period of observation does not preclude eventual redilation. In future, we may extend the duration of follow-up. The effect of SAVER in akinetic myocardium will be investigated as well.
Conclusion
The Dor procedure significantly reduces LV volume. Unlike linear repair, LV volume changes seem stable. The ejection fraction is improved, and the LV function (stroke volume and the Starling relationship) is maintained.
Footnotes
This study was supported by National Institutes of Health grants R01-HL-63348 (M.B.R.) and R01-HL-58759 (J.M.G.), a VA Merit Review (A.W.W.), and an American Heart Association fellowship (J.C.W.).
To avoid confusion, we use Dor procedure to refer only to patch aneurysmorrhaphy performed on an LV with a dyskinetic infarct. We use SAVER procedure (surgical anterior ventricular endoventricular restoration) to refer only to a patch reconstruction of the LV with akinetic infarct.
References
- 1.Guccione JM, Moonly SM, Wallace AW, Ratcliffe MB. Residual stress produced by ventricular volume reduction surgery has little effect on ventricular function and mechanics: a finite element model study. J Thorac Cardiovasc Surg. 2001;122:592–9. doi: 10.1067/mtc.2001.114939. [DOI] [PubMed] [Google Scholar]
- 2.Bogen DK, Rabinowitz SA, Needleman A, McMahon TA, Abelmann WH. An analysis of the mechanical disadvantage of myocardial infarction in the canine left ventricle. Circ Res. 1980;47:728–41. doi: 10.1161/01.res.47.5.728. [DOI] [PubMed] [Google Scholar]
- 3.Jackson BM, Gorman JH, Moainie SL, Guy TS, Narula N, Narula J, et al. Extension of borderzone myocardium in postinfarction dilated cardiomyopathy. J A m Coll Cardiol. 2002;40:1160–7. doi: 10.1016/s0735-1097(02)02121-6. discussion 1168–71. [DOI] [PubMed] [Google Scholar]
- 4.Ratcliffe MB. Non-ischemic infarct extension: a new type of infarct enlargement and a potential therapeutic target. J A m Coll Cardiol. 2002;40:1168–71. [Google Scholar]
- 5.Dor V, Saab M, Coste P, Kornaszewska M, Montiglio F. Left ventricular aneurysm: a new surgical approach. Thorac Cardiovasc Surg. 1989;37:11–9. doi: 10.1055/s-2007-1013899. [DOI] [PubMed] [Google Scholar]
- 6.Ohara K. Current surgical strategy for post-infarction left ventricular aneurysm—from linear aneurysmectomy to Dor’s operation. Ann Thorac Cardiovasc Surg. 2000;6:289–94. [PubMed] [Google Scholar]
- 7.Dor V, Di Donato M, Sabatier M, Montiglio F, Civaia F. Left ventricular reconstruction by endoventricular circular patch plasty repair: a 17-year experience. Semin Thorac Cardiovasc Surg. 2001;13:435–47. doi: 10.1053/stcs.2001.29966. [DOI] [PubMed] [Google Scholar]
- 8.Ratcliffe MB, Hong J, Salahieh A, Ruch S, Wallace AW. The effect of ventricular volume reduction surgery in the dilated, poorly contractile left ventricle: a simple finite element analysis. J Thorac Cardiovasc Surg. 1998;116:566–77. doi: 10.1016/S0022-5223(98)70162-X. [DOI] [PubMed] [Google Scholar]
- 9.Dor V, Sabatier M, Di Donato M, Maioli M, Toso A, Montiglio F. Late hemodynamic results after left ventricular patch repair associated with coronary grafting in patients with postinfarction akinetic or dyskinetic aneurysm of the left ventricle. J Thorac Cardiovasc Surg. 1995;110:1291–9. doi: 10.1016/S0022-5223(95)70052-8. discussion 1300–1. [DOI] [PubMed] [Google Scholar]
- 10.Markovitz LJ, Savage EB, Ratcliffe MB, Bavaria JE, Kreiner G, Iozzo RV, et al. Large animal model of left ventricular aneurysm. Ann Thorac Surg. 1989;48:838–45. doi: 10.1016/0003-4975(89)90682-6. [DOI] [PubMed] [Google Scholar]
- 11.Ratcliffe MB, Wallace AW, Salahieh A, Hong J, Ruch S, Hall TS. Ventricular volume, chamber stiffness, and function after anteroapical aneurysm plication in the sheep. J Thorac Cardiovasc Surg. 2000;119:115–24. doi: 10.1016/s0022-5223(00)70225-x. [DOI] [PubMed] [Google Scholar]
- 12.Baan J, van der Velde ET, de Bruin HG, Smeenk GJ, Koops J, van Dijk AD, et al. Continuous measurement of left ventricular volume in animals and humans by conductance catheter. Circulation. 1984;70:812–23. doi: 10.1161/01.cir.70.5.812. [DOI] [PubMed] [Google Scholar]
- 13.Wrazidlo W, Brambs HJ, Lederer W, Schneider S, Geiger B, Fischer C. An alternative method of three-dimensional reconstruction from two-dimensional CT and MR data sets. Eur J Radiol. 1991;12:11–6. doi: 10.1016/0720-048x(91)90125-f. [DOI] [PubMed] [Google Scholar]
- 14.Kono A, Maughan WL, Sunagawa K, Hamilton K, Sagawa K, Weisfeldt ML. The use of left ventricular end-ejection pressure and peak pressure in the estimation of the end-systolic pressure-volume relationship. Circulation. 1984;70:1057–65. doi: 10.1161/01.cir.70.6.1057. [DOI] [PubMed] [Google Scholar]
- 15.Krueger C, Tian L. A comparison of the general linear mixed model and repeated measures ANOVA using a dataset with multiple missing data points. Biol Res Nurs. 2004;6:151–7. doi: 10.1177/1099800404267682. [DOI] [PubMed] [Google Scholar]
- 16.Tanoue Y, Ando H, Fukumura F, Umesue M, Uchida T, Taniguchi K, et al. Ventricular energetics in endoventricular circular patch plasty for dyskinetic anterior left ventricular aneurysm. Ann Thorac Surg. 2003;75:1205–8. doi: 10.1016/s0003-4975(02)04761-6. discussion 1208–9. [DOI] [PubMed] [Google Scholar]
- 17.Schreuder JJ, Castiglioni A, Maisano F, Steendijk P, Donelli A, Baan J, et al. Acute decrease of left ventricular mechanical dys-synchrony and improvement of contractile state and energy efficiency after left ventricular restoration. J Thorac Cardiovasc Surg. 2005;129:138–45. doi: 10.1016/j.jtcvs.2004.03.057. [DOI] [PubMed] [Google Scholar]
- 18.Nishina T, Nishimura K, Yuasa S, Miwa S, Nomoto T, Sakakibara Y, et al. Initial effects of the left ventricular repair by plication may not last long in a rat ischemic cardiomyopathy model. Circulation. 2001;104:I241–5. doi: 10.1161/hc37t1.094522. [DOI] [PubMed] [Google Scholar]
- 19.Dang AB, Guccione JM, Zhang P, Wallace AW, Gorman RC, Gorman JH, III, et al. Effect of ventricular size and patch stiffness in surgical anterior ventricular restoration: a finite element model study. Ann Thorac Surg. 2005;79:185–93. doi: 10.1016/j.athoracsur.2004.06.007. [DOI] [PubMed] [Google Scholar]
- 20.Artrip JH, Oz MC, Burkhoff D. Left ventricular volume reduction surgery for heart failure: a physiologic perspective. J Thorac Cardiovasc Surg. 2001;122:775–82. doi: 10.1067/mtc.2001.116208. [DOI] [PubMed] [Google Scholar]
- 21.Athanasuleas CL, Stanley AW, Buckberg GD, Dor V, Di Donato M, Siler W. Surgical anterior ventricular endocardial restoration (SAVER) for dilated ischemic cardiomyopathy. Semin Thorac Cardiovasc Surg. 2001;13:448–58. doi: 10.1053/stcs.2001.30372. [DOI] [PubMed] [Google Scholar]
- 22.Dang AB, Guccione JM, Mishell JM, Zhang P, Wallace AW, Gorman RC, et al. Akinetic myocardial infarcts must contain contracting myocytes: finite-element model study. Am J Physiol Heart Circ Physiol. 2005;288:H1844–50. doi: 10.1152/ajpheart.00961.2003. [DOI] [PubMed] [Google Scholar]
- 23.Cheirif J. Diagnosis of myocardial stunning: a new use for myocardial contrast and dobutamine echocardiography. Am J Card Imaging. 1995;9:261–8. [PubMed] [Google Scholar]
- 24.Guccione JM, Moonly SM, Moustakidis P, Costa KD, Moulton MJ, Ratcliffe MB, et al. Mechanism underlying mechanical dysfunction in the border zone of left ventricular aneurysm: a finite element model study. Ann Thorac Surg. 2001;71:654–62. doi: 10.1016/s0003-4975(00)02338-9. [DOI] [PubMed] [Google Scholar]