Abstract
Femtosecond stimulated Raman spectroscopy (FSRS) is a new technique that produces high-quality vibrational spectra free from background fluorescence. FSRS combines a narrow-bandwidth picosecond Raman pump pulse with an ∼80 fs continuum probe pulse to produce stimulated Raman spectra from the pump-induced gain in the probe spectrum. The high intensity of the Raman pump combined with the broad bandwidth of the probe produces high signal-to-noise vibrational spectra with very short data acquisition times. FSRS spectra of standard solutions and solvents such as aqueous Na2SO4, aqueous KNO3, methanol, isopropanol, and cyclohexane are collected in seconds. Furthermore, stimulated Raman spectra can be obtained using just a single pump–probe pulse pair that illuminates the sample for only ∼1 ps. Fluorescence rejection is demonstrated by collecting FSRS spectra of dyes (rhodamine 6G, chlorophyll a, and DTTCI) with varying degrees of fluorescence background and resonance enhancement. The high signal-to-noise, short data acquisition time, fluorescence rejection, and high spectral and temporal resolution of femtosecond stimulated Raman spectroscopy make it a valuable new vibrational spectroscopic technique.
Keywords: Fem tosecond stimulated Raman, Time-resolved Raman, Vibrational spectroscopy, Fluorescence rejection, Raman depolarization ratios
INTRODUCTION
Raman spectroscopy is a valuable analytical and vibrational structural technique that has been widely used in chemical, biological, and time-resolved studies.1-3 Resonance enhancement of the Raman scattering can be exploited to study selected molecular species, and time-resolved studies extending into the picosecond domain can be performed with pulsed lasers.3 However, even resonance Raman cross-sections are small (∼10−24 cm2/molecule·str), making an illuminated molecule ∼108 times more likely to absorb a photon than to scatter.2 Additionally, most molecules and associated impurities produce background fluorescence that can easily overwhelm the Raman signal. These limitations have made it difficult to exploit the technique routinely, so many analytical and industrial applications have relied upon Fourier transform infrared (FT-IR) or FT-Raman spectroscopy.4,5 We show here that these limitations are completely addressed by stimulated Raman scattering (SRS), making it a generally applicable vibrational technique.
Stimulated Raman scattering occurs when two coherent optical fields, the Raman pump beam at ωp and the Stokes probe beam at ωS, are incident on a sample that contains a molecular vibration whose frequency ωv is equal to ωp – ωS. The Stokes Raman transitions of the sample cause net attenuation of the pump beam and net gain in the probe beam. A schematic for femtosecond stimulated Raman spectroscopy (FSRS) is presented in Fig. 1. The Raman spectrum is collected with two pulses overlapped in time: (1) the Raman pump, which is a narrow-bandwidth (∼15 cm−1) pulse ∼1 ps in duration, and (2) a broadband ∼50 fs probe pulse extending from 500–2300 cm−1 to the red of the Raman pump. The Raman spectrum is determined by the pump-induced gain of the probe pulse. Because the dispersion and detection of the probe intensity is not time-resolved, the FSRS frequency resolution is independent of the time–energy Fourier relationship of the femtosecond pulse. Instead, the frequency resolution is determined by the convolution of the bandwidth of the Raman pump, the intrinsic Raman line-width, and the inherent resolution of the spectrographic system. Additional benefits of FSRS are that the amplification process is self-phase matched and the detection of the coherent and intense probe beam is unaffected by any spontaneous fluorescence at the sample point. These benefits contrast distinctly with coherent anti-Stokes Raman spectroscopy, which requires an intense and therefore generally narrow bandwidth Stokes pulse, three-pulse phase-matching, and generates complex lineshapes.6,7
Fig. 1.
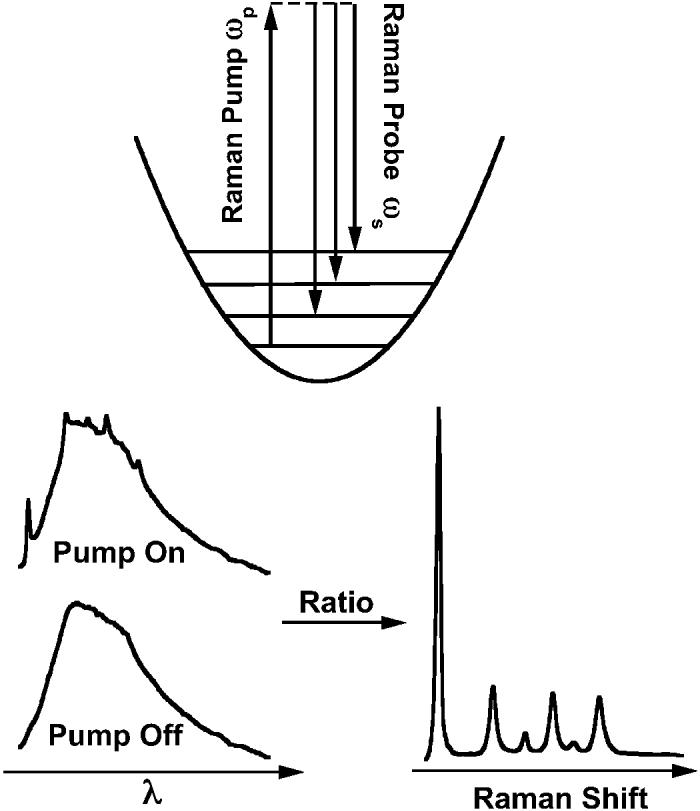
Illustration of the femtosecond broadband stimulated Raman technique. In the presence of the narrow bandwidth (∼15 cm−1) Raman pump, the probe continuum is amplified at Raman resonances, ωS, shifted from the pump frequency, ωp, by a vibrational transition of the sample. The spectrum of each continuum pulse is measured by dispersing it onto a multichannel detector. The ratio of the probe spectrum with and without the Raman pump determines the complete Raman gain spectrum from 600–2100 cm−1 in a single shot.
Stimulated Raman can be described by coupled wave equations in which the pump and Stokes fields are coupled parametrically by the polarization response of the sample.8-10 Because the gain of the Stokes field is determined by the imaginary part of the third-order Raman susceptibility, , SRS spectra have real Lorentzian line shapes, free from complicated interference between the real and background parts of χ3.8,10 In a general treatment of nonlinear spectroscopies, Lee and Albrecht11 have shown that the differential scattering cross-section for stimulated Raman is given by:
| (1) |
where F (ωS) is the spectral photon flux (photons cm−2 −1 Hz−1), and N is the number of molecules per unit volume. The spontaneous differential Raman cross-section is derived 11 using the zero-point radiation field intensity instead of the Stokes beam intensity:
| (2) |
From these equations we can calculate the relative efficiency of stimulated to spontaneous Raman as the ratio of the scattering cross-sections:
| (3) |
Equation 3 shows that the relative efficiency of SRS increases with the probe field intensity and as the Stokes frequency shifts to the red, where the zero-point radiation density-of-states decreases. Given our typical probe photon flux of 1012 photons/cm2/s/Hz at the sample, we estimate the relative ratio of SRS to spontaneous Raman to be ∼107. This is a substantial increase in the number of Raman photons detected and, although transient effects that are expected to decrease the SRS efficiency have been neglected,12 should produce much faster acquisition times and less sensitivity to spontaneous emission back-grounds.
In the 1970s, narrow-bandwidth stimulated Raman was championed as a high-resolution spectroscopic tool7 and as a vibrational pumping technique.13 The fluorescence rejection capabilities of SRS have also been effectively used to generate Raman excitation profiles of fluorescent dyes using the inverse Raman effect.14 More recently, the ease of generating broadband pulses with femtosecond lasers and the inherently fast time resolution of FSRS has been exploited to perform femtosecond time-resolved studies of several photochemical and photophysical systems.15-18 For example, we have used time-resolved FSRS to observe the ∼200-fs excited-state vibrational relaxation in β-carotene.15
Here we present an effective optical configuration and method for performing broadband femtosecond stimulated Raman spectroscopy as well as experiments that explore its utility as an analytical vibrational technique. High signal-to-noise Raman spectra of typical solutions and solvents are acquired in seconds, and spectra of highly fluorescent dyes in solution are obtained that are difficult or impossible to obtain using spontaneous Raman techniques. Furthermore, FSRS spectra obtained using a single pump–probe pulse pair demonstrate the feasibility of the real-time observation of chemical reaction dynamics.
MATERIALS AND METHODS
Instrumentation. The femtosecond stimulated Raman spectroscopy laser system shown in Fig. 2 is based on a regeneratively amplified Ti : sapphire laser.15 A Kapteyn–Murnane Ti : sapphire oscillator seeds a regenerative amplifier (BMI Alpha 1000/US) pumped by an intracavity doubled Nd : YLF laser (BMI 621-D). The amplifier produces 45-fs, 800-μJ pulses at a 1-kHz repetition rate with a spectrum centered at 795 nm and a 23-nm full width at half-maximum (FW HM).
Fig. 2.
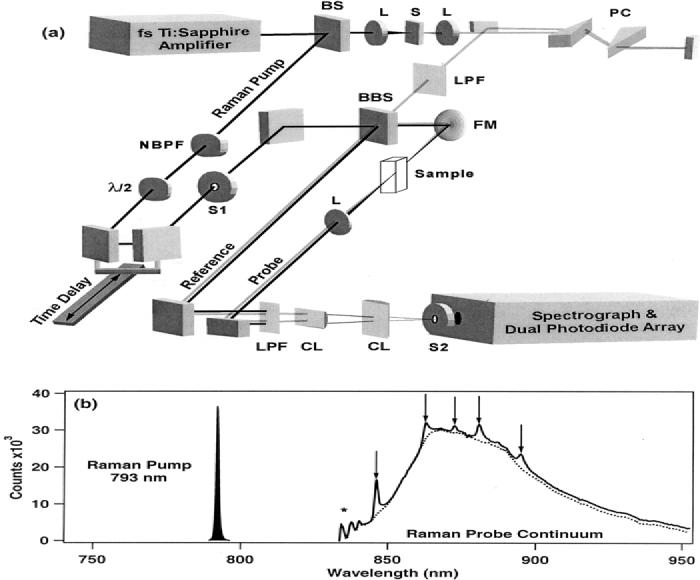
(a) Laser system for femtosecond broadband stimulated Raman spectroscopy (FSRS). The narrow bandwidth Raman pump is produced by spectrally filtering the 795-nm femtosecond amplifier output and the probe is produced by continuum generation in sapphire. When the two pulses are recombined and focussed through the sample, the stimulated Raman process amplifies the continuum at Raman resonances Stokes-shifted from the Raman pump wavelength. Dark line = 793 nm Raman pump beam; gray line = NIR continuum probe beam; BS = 80% reflective beamsplitter; L = lens; S = sapphire plate; PC = fused silica prism compressor; NBPF = narrow band-pass interference filters; BBS = broadband beamsplitter; LPF = 850 nm long-pass filters; FM = focusing mirror; CL = cylindrical lenses; S1/S2 = electronic shutters. (b) The spectra of the Raman pump and probe pulses for a typical experiment on cyclohexane. The pump-off probe spectrum is shown as the dotted line. With the pump-on the Raman gain peaks from the cyclohexane sample are clearly visible in the probe spectrum (solid). The oscillatory intensity in the probe at ∼840 nm (*) produces the crossphase modulation features at Raman frequencies below 770 cm−1.
The probe beam is produced by continuum generation in sapphire (Fig. 2, top). The optimum spectral shape and intensity of the continuum was obtained by aperturing the beam to a 3-mm diameter before focusing with a 10-cm-focal-length lens into the 3-mm sapphire plate and collimating the output with a 5-cm-focal-length lens. Pulse compression was performed with a fused silica prism pair in which a 50-cm separation of the prisms removed the chirp in the near-infrared (NIR) portion of the continuum. The short-wavelength portion of the continuum was removed by a long-pass filter (LPF, Kodak Wratten #87C). The pulse-duration and chirp of the probe pulse was measured at the sample point by optical Kerr effect cross-correlation (OKE-XC) with a portion of the amplifier output pulse.19 The frequency-resolved OKE-XC indicated that the pulse had an 80-fs Gaussian cross-correlation, with <8 fs of chirp from 830–950 nm, corresponding to Raman shifts of 600–2100 cm−1.
The Raman pump beam was produced by spectrally filtering the remaining 795-nm output of the amplifier with two narrow band-pass interference filters (NBPF, CVI Laser). The sequential filtering produced an 800-fs Raman pump pulse centered at 793 nm with a Lorentzian spectral profile and a 1.0-nm (16 cm−1) FWHM.
The Raman pump and probe beams are made collinear at a broadband beam splitter (BBS) that also facilitates splitting the continuum into probe and reference beams. The pump and probe beams were focused into the sample cell by a 150-mm-focal-length mirror. The Raman pump pulse energy was 1.5 μJ/pulse with a ∼150-mm beam diameter at the sample point, and the probe beam was 30 nJ/pulse with a ∼60-mm beam diameter. The spatial and temporal overlap of these beams was adjusted to maximize Raman gain signal from cyclohexane. After the sample, the Raman pump pulse was removed from both the probe and reference beams with a long-pass filter (LPF, Kodak Wratten #87C). The probe and reference pulses were made parallel and vertically displaced from each other before being focused onto the slit of the spectrograph (slit = 200 μm or ∼12 cm−1) by two cylindrical lenses (CL) that separately controlled the vertical displacement and the horizontal width of the two beams at the slit. The two beams were dispersed by the spectrograph (ISA HR320, 600 grooves/mm, 1000 nm blaze) and imaged onto a dual-diode array detector (Roper Scientific, DPDA-1024). Parallel polarized Raman spectra were collected with both beams polarized horizontally, while depolarized or perpendicular Raman spectra were collected by rotating the polarization of the Raman pump 90° relative to the probe with a half-wave plate (λ/2). The polarization-dependent reflectivity of the beam splitter at the Raman pump wavelength was accounted for by multiplying the perpendicular spectra by a scaling factor of 2.14. Absolute Raman shifts were calibrated using the known (parallel) frequencies of several solvents and are accurate to ±2 cm−1.
To minimize the effects of cross-phase modulation (CPM), the aperture and attenuation of the fundamental beam were adjusted before focusing into the sapphire plate so as to produce the smoothest possible continuum spectrum. Also, the long-pass filters were chosen to have a gradual cut-off and were placed at Brewster's angle to prevent etaloning. CPM is caused by the time-dependent intensity of the Raman pump and the solvent's nonlinear index of refraction, which together produce a periodic phase-shift in the field of the probe. This effect generates a small blue shift (<0.2 nm) in the spectrum of the probe in the presence of the intense pump field.20 CPM is decreased when the pump and probe polarizations are perpendicular, causing the perpendicular peak positions to appear up-shifted by ∼2–10 cm−1 relative to the calibrated parallel peaks. Additionally, this blue shift in the pump-on spectrum causes a very slight offset (<0.5%) of the gain spectrum where the continuum is smoothly varying, and where the continuum exhibits sharp features, oscillations appear in the calculated gain ratio (e.g., Δν <770 cm−1, Fig. 2b). The CPM offset was removed by spline fitting and subtracting the spectral baseline. CPM may also be reduced by decreasing the time derivative of the Raman pump intensity envelope, either by decreasing its pulse energy or by increasing its pulse width.
Sample Preparation. All solvents used were spectroscopic grade. Chlorophyll a (Aldrich) was dissolved in ethanol (0.6 mM). Rhodamine 6G (Exciton, 1.3 mM) and DTTCI (3,3′-Diethylthiatricarbocyanine Iodide, Fluka, 2 μM) were dissolved in methanol. Samples were either flowed through a 1-cm-path-length glass flow-cell at a rate sufficient to replenish the illuminated volume between shots or they were contained in a 1-cm-path-length cuvette that was rapidly stirred by a magnetic stir-bar.
Data Collection. The detector exposure was controlled by an electronic shutter (S2, Uniblitz LS6T2) positioned at the entrance slit of the spectrograph. To prevent saturation of the detector, the exposure was limited to 97 ms (97 probe and reference pulses), after which the detector was read out while the shutter was closed for 10 ms. As shown in Fig. 2b, the continuum intensity was ∼30 000 counts per exposure at the peak of the continuum (870 nm) and ∼5000 counts at the minimum (960 nm). During the readout period, the Raman pump beam was shuttered on or off using a second shutter (S1) so that sequential exposures corresponded to either Raman-pump-on or Raman-pump-off conditions. In the 1-cm-path-length pumpon spectra, shown in Fig. 2b, the Raman gain of cyclohexane was clearly visible as peaks on top of the smooth continuum background. The stimulated Raman spectrum is obtained by calculating the gain induced in the probe beam by the Raman pump. Initially, the dark background levels are subtracted from the probe and reference spectra, and then the probe spectrum is normalized for intensity fluctuations in the continuum by dividing by the reference spectrum. Finally, division of the normalized Raman-pump-on probe continuum by the normalized Raman-pump-off continuum produces the gain spectrum:
| (4) |
Although a single spectrum (pump-on and pump-off cycle) could be collected in ∼220 ms, 10 such Raman gain spectra were collected and averaged to improve the signal-to-noise ratio. For the nitrate, sulfate, chlorophyll a, and rhodamine 6G spectra, 50 gain spectra were collected and averaged, increasing the collection time to 11 s. Residual systematic noise caused by the mismatch of the odd and even pixels in the DPDA was decreased with a three-point binomial smoothing applied to the probe and reference spectra.
RESULTS AND DISCUSSION
The spectra presented in Fig. 2 show that the stimulated Raman amplification of the continuum is clearly visible even before calculation of the gain spectrum. Using a 1-cm-path-length cell and a Raman pump energy of 1.5 μJ/pulse, the strong 803 cm−1 cyclohexane peak typically produced a gain of >80%. However, with careful optimization of the beam overlap, similar gains could be generated using a Raman pump energy of only 0.5 μJ/ pulse. Raman gain peaks with amplitudes as low as 0.1% were easily observed after calculating the gain spectrum using Eq. 4. The ability to produce such high Raman gain is due to our use of a sub-picosecond Raman pump pulse with high peak irradiance (11 GW /cm2) while maintaining low average powers (1.5 mW). The bandwidth of the femtosecond probe pulse (∼100 nm) allows the acquisition of a full Raman spectrum with each shot. Since the probe pulse is dispersed before detection, there is no time–energy uncertainty limitation in the resolution of the detection system. Instead, the width of the Raman peaks is approximately determined by the convolution of the Raman pump bandwidth (16 cm−1) with the spectrograph resolution (∼12 cm−1) and the inherent linewidth of the Raman transition. For instance, the 803 cm−1 mode of cyclohexane has a 2.3 cm−1 natural linewidth,21 producing an observed FWHM of 17 cm−1, determined primarily by the Raman pump bandwidth.
Figure 3 presents a comparison of stimulated Raman spectra of several solutions commonly used in Raman spectroscopy. The nitrate and sulfate solution spectra were acquired in 11 s and the solvent spectra were acquired in 2.2 s. The peak frequencies agree with literature values to within the experimental accuracy. The sulfate peak at 982 cm−1 showed a peak gain of 7% for the 1 M Na2SO4 solution. The nitrate peak at 1049 cm−1 showed a peak gain of 6% for the 1 M KNO3 solution. In both of these aqueous solutions, the weakly scattering water bend was easily discernable at 1650 cm−1. The baseline noise in the sulfate and nitrate spectra is ∼2 × 10⁻⁴ and is dominated by systematic detector noise. The shot-noise limit is determined as the square root of the number of photoelectrons measured, which for the continuum intensity of ∼16 000 counts/pixel/exposure and a detector gain of 1300 e/count, corresponds to a noise level of 0.022% per pixel per read. The binomial smoothing reduces this by , to 0.016%. Calculating the gain using four such measurements and then averaging 50 gain spectra produces a theoretical shot-noise limit of 4 × 10⁻⁵, which is ∼5 times lower than the observed noise. The systematic noise in the solute spectra can be eliminated by subtraction of the pure solvent spectrum, which contains the same systematic noise pattern.
Fig. 3.
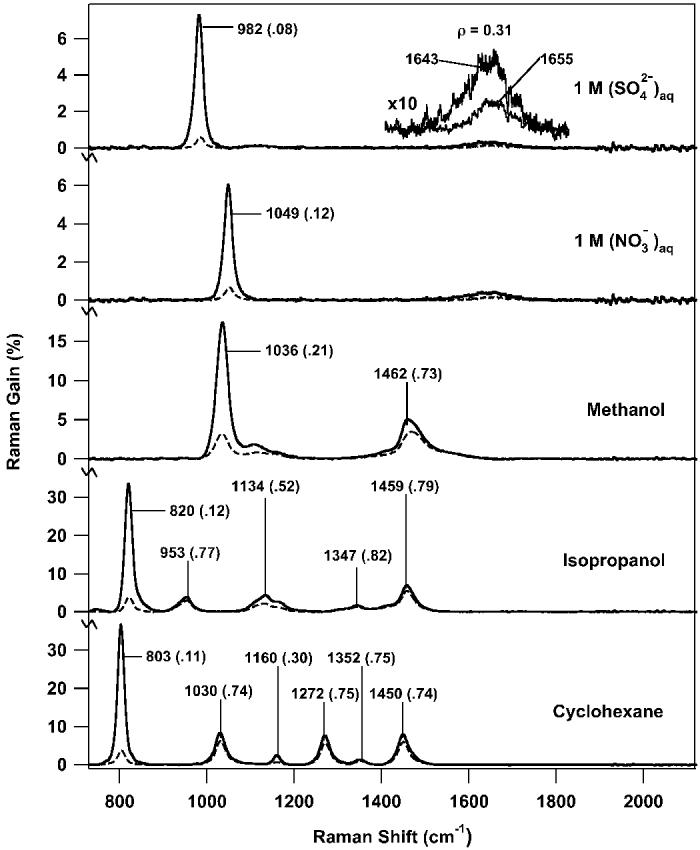
Parallel (solid) and perpendicular (dashed) FSRS spectra of 1.0 M aqueous nitrate and sulfate solutions and several common solvents. The major peak frequencies are noted with the depolarization ratio (ρ = ⊥/∥) in parenthesis. In each spectrum the Raman pump pulse energy was 1.5 μJ/pulse. The aqueous solution spectra are the average of fifty 100-ms Raman gain spectra with a 1-cm-pathlength cell (total acquisition time: 11 s). The methanol and isopropanol spectra are averages of ten 100-ms Raman gain spectra with a 1-cm-pathlength cell (total acquisition time: 2.2 s). The cyclohexane spectrum is an average of ten 100-ms Raman gain spectra with a 3.5-mm-pathlength cell (total acquisition time: 2.2 s). The inset presents a blow up (10×) of the Raman feature due to the water bending mode. The non-coincidence between the parallel and perpendicular water bend frequencies is due to changing degrees of cross-phase modulation.
Figure 3 also illustrates the use of FSRS to obtain Raman spectra of selected solvents with high signal-to-noise ratios (SNR) and short acquisition times. In each case, the observed parallel peak frequencies agree with the established spontaneous frequencies to within the experimental error. The perpendicular peak frequencies are up-shifted because of the cross-phase modulation discussed above. For each solvent spectrum the baseline noise was 2 × 10⁻⁴, a factor of ∼2 times the expected shot-noise limit of 9 × 10⁻⁵. Methanol exhibits two large peaks in the parallel spectrum with SNR > 400: the C–O stretch at 1036 cm−1 with a gain of 18% and the CH3 deformation at 1462 cm−1 with a gain of 8%. The isopropanol SNR varies from 150–1700, with parallel peak amplitudes ranging from 33% for the strongly polarized 820 cm−1 peak to 3% for the unpolarized 1347 cm−1 peak. The cyclohexane spectrum was obtained using a 3.5-mm-path-length flow cell in order to reduce the nonlinearity of the extremely high Raman gain. For this shortened path length, the 803 cm−1 gain was 36% and the smallest peaks at 1160 and 1352 cm−1 had gains of 2.5% and 1% respectively. The cyclohexane SNR was 50–1800.
Classification of Raman peaks as polarized or depolarized can be a useful tool in spectroscopic assignments. In non-resonant Raman, the depolarization ratios (ρ = ⊥/∥) of the depolarized and therefore non-totally symmetric modes are ∼0.75, while the polarized modes, with ρ ≪ 0.75, are necessarily totally symmetric.8,22 Accurate calculations of ρ are difficult for highly polarized bands in spontaneous Raman because the depolarized spectrum is generally weak. However, as shown Fig. 3, both parallel and perpendicular FSRS spectra have high SNR. The large decrease in intensity in the perpendicular spectrum relative to the parallel spectrum is apparent in sulfate at 982 cm−1 (ρ = 0.08), nitrate at 1049 cm−1 (ρ = 0.12), methanol at 1036 cm−1 (ρ = 0.21), isopropanol at 820 cm−1 (ρ = 0.12), and cyclohexane at 803 cm−1 (ρ = 0.11). Quantitatively, however, the strongly polarized peaks all exhibit depolarization ratios that are 0.07–0.14 higher than reported in the literature, most likely due to nonlinearity of the extremely high parallel gains that may begin to saturate the vibrational transition.21,23 Using lower powers and shorter path lengths15 we have shown that the depolarization ratios of the cyclohexane peaks agreed with values reported in the literature.21
In Fig. 4 we present stimulated Raman spectra of cyclohexane obtained by integrating different numbers of pulses on the detector to explore the feasibility of recording real-time spectra. The maximum number of pulses, 100, was determined by the saturation point of the detector. The minimum exposure corresponds to a single ∼1-ps illumination of the sample. The data in Fig. 4 demonstrate that high-quality data are obtained with only a single pump–probe pulse pair. The intensity of the continuum at the detector corresponds to ∼250 counts per pulse at 910 nm. However, even at this exposure level, the SNR of the 803 cm−1 peak is ∼100 and the SNR of the 1444 cm−1 peak is ∼10. As the number of integrated pulses increases, the baseline noise decreases. However, as indicated by the inset plot of the 1444 cm−1 SNR, the noise decrease is not strictly proportional to the square root of the number of pulses, as would be predicted in the shot-noise limit, due to the changing contributions from read-noise and the limiting systematic noise at high exposure levels. The ability of FSRS to produce Raman spectra with a single pump–probe pulse pair that illuminates the sample for <1 ps opens up new possibilities for performing real-time resolved spectroscopy.
Fig. 4.
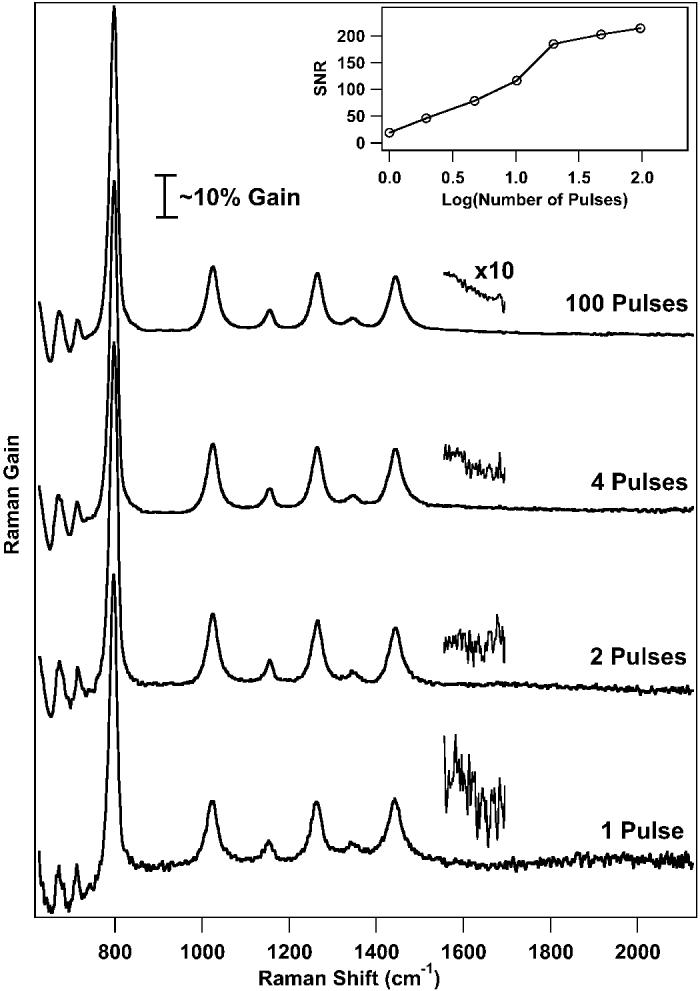
Femtosecond stimulated Raman spectra of cyclohexane obtained with decreasing detector exposure levels. The 1-pulse spectrum is obtained with a single ∼1 ps exposure of the sample to a single picosecond-pump, femtosecond-probe pulse pair. As the exposure level is increased, the decreasing baseline noise is apparent in the blown-up regions. The inset shows the increase of the signal-to-noise ratio for the 1444-cm−1 peak as the number of pulses increases.
Femtosecond stimulated Raman spectroscopy is also valuable for obtaining Raman spectra of fluorescent samples because the Raman signal is captured by the coherent probe beam and passed through an aperture to the spectrograph. The systems chosen for study (Fig. 5) present varying degrees of fluorescence background and resonance enhancement. Rhodamine 6G has an absorption maximum at 530 nm and 95% fluorescence quantum yield in dilute solutions, though at the 1.3 mM concentration used in this study the fluorescence quantum yield decreases to 0.30.24 Chlorophyll a exhibits a broad absorption throughout the visible region with the lowest Qy branch peaking at 670 nm. When purified from photosynthetic proteins, the fluorescence quantum yield increases 10 fold to 0.32.25 DTTCI is a NIR emitting laser dye that exhibits an absorption max at 760 nm and a fluorescence (Φfl = 0.38) peaked at 815 nm and extending throughout our Raman window.26
Fig. 5.
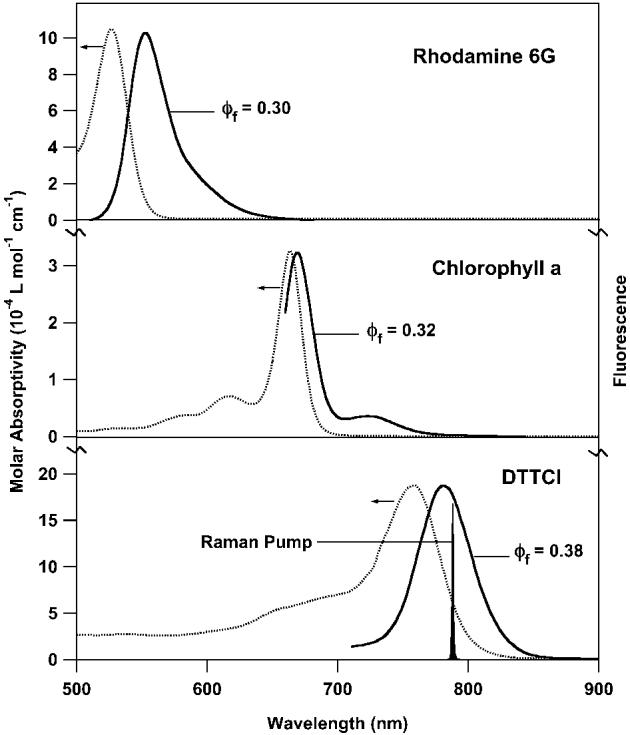
Absorption and fluorescence spectra of DTTCI in methanol, chlorophyll a in ethanol, and rhodamine 6G in methanol with the Raman pump wavelength (793 nm) indicated.
The stimulated Raman spectra of DTTCI, chlorophyll a, and rhodamine 6G are presented in Fig. 6. The DTTCI spectrum was collected in 2.2 s and the chlorophyll a and rhodamine 6G spectra were collected in 11 s. The observed noise levels are within 50% of the shot-noise limit because the systematic noise present in the original spectrum is removed by the subtraction of the pure solvent spectra. The largest peaks have gains of ∼1%, producing SNR values of 50 and 100 for the 2.2-s and 11-s spectra, respectively. The concentrations necessary to produce the observed 1% gain range from 2 μM for DTTCI, to 600 μM for chlorophyll a, to 1300 μM for rhodamine 6G because of decreasing resonance enhancement. The stimulated Raman peak frequencies agree with spontaneous Raman spectra of these species obtained with a variety of difficult fluorescence rejection techniques.27-29
Fig. 6.
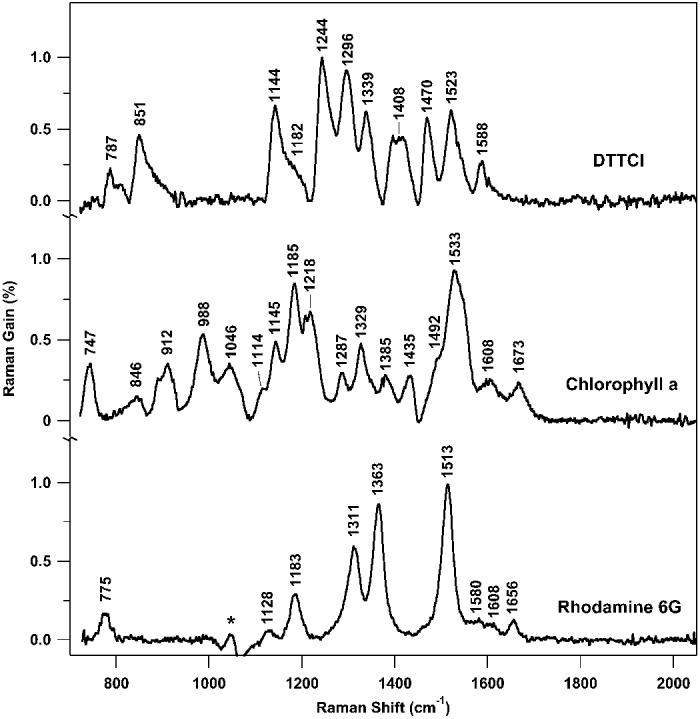
Parallel FSRS Raman spectra of DTTCI (2 μM in methanol), chlorophyll a (0.6 mM in ethanol), and rhodamine 6G (1.3 mM in methanol). In each case the solvent peaks have been subtracted. An artifact of the methanol subtraction (*) remains in the rhodamine 6G spectrum. Experimental conditions: Raman pump pulse energy = 1.5 μJ/pulse; pathlength = 1 cm; data acquisition time = 2.2 s for DTTCI and 11 s for chlorophyll a and rhodamine 6G.
The FSRS detection format dramatically eliminates the spontaneous emission background in fluorescent samples. This allows the observation of the Raman spectrum of DTTCI, which is, to our knowledge, the first Raman spectrum ever taken in resonance with its 760-nm absorption. The DTTCI stimulated emission did produce a smooth gain background across the Raman window of ∼1%. At higher concentrations (>16 μM) this background increased up to ∼30%, though its smooth shape did not interfere with observation of the stimulated Raman spectrum. There was no fluorescent background in the chlorophyll a and rhodamine 6G FSRS spectra, despite the visible yellow fluorescence in the rhodamine 6G solution arising from two-photon excitation by the Raman pump.
For comparison, spontaneous Raman spectra were collected using a continuous wave (CW) Ti : sapphire laser (2 mW of 790-nm excitation) with 90° scattering coupled to a back-illuminated liquid-nitrogen-cooled charge-coupled device (CCD) Raman system (LN-CCD, gain = 5 e/count). Solvent spectra were visible in a single 2.2-s acquisition but had an SNR an order of magnitude smaller than our FSRS spectra. For the rhodamine 6G solution, the Raman spectrum of the solute was visible after 100 s of data acquisition with SNR ∼75. To reach an SNR of 100, equivalent to the FSRS spectrum acquired in 11 s, would require 3 min of data acquisition. The CW Raman spectrum of chlorophyll a and DTTCI could not be observed because of the overwhelming fluorescence signal. The chlorophyll a solution produced ∼3000 cps of fluorescence in the Raman window and DTTCI produced 600 000 cps. Based on the intensity of the solvent Raman peaks, we estimate the intensity of the largest chlorophyll a and DTTCI peaks as 3 cps. For the chlorophyll solution, it would require signal averaging for ∼7 × 10⁵ s, or ∼8 days, to reach the SNR of 100 observed in the 11-s FSRS spectrum. For the DTTCI solution, it would require ∼3 × 10⁷ s, or ∼1 year of signal averaging to acquire a spectrum with the same SNR as the 2.2-s FSRS spectrum.
CONCLUSION AND PROSPECTS
We have demonstrated that broadband femtosecond stimulated Raman spectroscopy can be implemented with a standard femtosecond Ti : sapphire laser and used to collect Raman spectra free from background fluorescence over a broad spectral window. The high peak intensity of the ∼1 ps Raman pump combined with the broad band-width of the femtosecond probe allows the acquisition of high SNR spectra of solutions and solvents with extremely short acquisition times. These characteristics make FSRS uniquely valuable for time-resolved studies. The ability to record a spectrum in a single picosecond shot effectively eliminates the need to signal average using multiple pulses and may allow the real-time observation of chemical reactions. Furthermore, by simply adding a femtosecond actinic pulse we have shown that it is possible to perform time-resolved structural studies of photochemical and photophysical processes with femtosecond time resolution.15
The unique fluorescence rejection, spectral resolution and extent, and rapid data collection attributes of FSRS will make it a broadly applicable technique for high-performance vibrational spectroscopy. Relative to spontaneous Raman, FSRS decreases acquisition times by an order of magnitude for nonresonant dyes and by up to 107 for resonantly enhanced fluorescent dyes. This makes possible Raman studies of fluorescent biomolecules that have been difficult or impossible to study in the past, such as green-fluorescent protein (GFP), photoactive yellow protein,30 phycobiliproteins,31 and photosynthetic reaction centers and antenna complexes.
ACKNOWLEDGMENTS
We thank Mitsuo Tasumi for valuable comments, Michael Tauber and Christina Stuart for assistance in the collection of the CW spectra, and Jl̈rg Zimmerman for assistance with the continuum generation. This work was supported by a grant from the National Science Foundation (CHE-9801651), the Mathies Royalty Fund, and a National Science Foundation graduate research fellowship to DM.
References
- 1.Pelletier MJ. Appl. Spectrosc. 2003;57:20A. doi: 10.1366/000370203321165133. [DOI] [PubMed] [Google Scholar]
- 2.Myers AB, Mathies RA. Biological Applications of Raman Spectrometry. In: Spiro TG, editor. Resonance Raman Spectra of Polyenes and Aromatics. Vol. 12. John Wiley and Sons; New York: 1987. pp. 1–57. [Google Scholar]
- 3.Zhu L, Kim J, Mathies RA. J. Raman Spectrosc. 1999;30:777. [Google Scholar]
- 4.Christy AA, Ozaki Y, Gregoriou VG. Modern Fourier Transform Infrared Spectroscopy. Vol. 35. Elsevier; Amsterdam: 2001. [Google Scholar]
- 5.Hendra PJ, Wilson HMM, Wallen PJ, Wesley IJ, Bentley PA, Arruebarrena-Baez M, Haigh JA, Evans PA, Dyer CD, Lehnert R, Pellow-Jarman MV. Analyst. Vol. 120. Cambridge; U.K.: 1995. p. 985. [Google Scholar]
- 6.Ujj L, Volodin BL, Popp A, Delaney JK, Atkinson GH. Chem. Phys. 1994;182:291. [Google Scholar]
- 7.Owyoung A. IEEE. J. Quantum Electron. 1978;QE-14:192. [Google Scholar]
- 8.Levenson MD, Kano SS. Introduction to Nonlinear Laser Spectroscopy. Academic Press; San Diego: 1988. revised ed. [Google Scholar]
- 9.Shen YR. The Principles of Nonlinear Optics. John Wiley and Sons; New York: 1984. [Google Scholar]
- 10.Shen YR, Bloembergen N. Phys. Rev. 1965;137:A1787. [Google Scholar]
- 11.Lee D, Albrecht AC. In: Advances in Infrared and Raman Spectroscopy. Clark RJH, Hester RE, editors. Vol. 12. Wiley Heyden; London: 1985. pp. 179–213. [Google Scholar]
- 12.Carman RL, Shimizu F, Wang CS, Bloembergen N. Phys. Rev. A. 1970;2:60. [Google Scholar]
- 13.Laubereau A, Kaiser W. Rev. Mod. Phys. 1978;50:607. [Google Scholar]
- 14.Takayanagi M, Hamaguchi H, Tasumi M. J. Chem. Phys. 1988;89:3945. [Google Scholar]
- 15.McCamant DW, Kukura P, Mathies RA. J. Phys. Chem. A. 2003 doi: 10.1021/jp030147n. paper in press. [DOI] [PMC free article] [PubMed] [Google Scholar]
- 16.Yoshizawa M, Kubo M, Kurosawa M. J. Lumin. 2000;87–89:739. [Google Scholar]
- 17.Yoshizawa M, Aoki H, Hashimoto H. Bull. Chem. Soc. Jpn. 2002;75:949. [Google Scholar]
- 18.Rondonuwu FS, Watanabe Y, Zhang JP, Furuichi K, Koyama Y. Chem. Phys. Lett. 2002;357:376. [Google Scholar]
- 19.Yamaguchi S, Hamaguchi H. Appl. Spectrosc. 1995;49:1513. [Google Scholar]
- 20.Hirlimann C. In: Femtosecond Laser Pulses: Principles and Experiments. Rulliere C, editor. Springer-Verlag; Berlin Heidelberg: 1998. pp. 47–48. [Google Scholar]
- 21.Toleutaev BN, Tahara T, Hamaguchi H. Appl. Phys. B. 1994;59:369. [Google Scholar]
- 22.Strommen DP. J. Chem. Ed. 1992;69:803. [Google Scholar]
- 23.Colles MJ, Griffiths JE. J. Chem. Phys. 1972;56:3384. [Google Scholar]
- 24.Bindhu CV, Harilal SS, Nampoori VPN, Vallabhan CPG. Mod. Phys. Lett. B. 1999;13:563. [Google Scholar]
- 25.Latimer P, Bannister TT, Rabinowitch E. Science. Vol. 124. Washington, D.C.: 1956. p. 585. [DOI] [PubMed] [Google Scholar]
- 26.Benson RC, Kues HA. J. Chem. Eng. Data. 1977;22:379. [Google Scholar]
- 27.Hildebrandt P, Stockburger M. J. Phys. Chem. 1984;88:5935. [Google Scholar]
- 28.Zhou C, Diers JR, Bocian DF. J. Phys. Chem. B. 1997;101:9635. [Google Scholar]
- 29.Fujimoto Y, Katayam a N, Ozaki Y, Yasui S, Iriyama K. J. Mol. Struct. 1992;274:183. [Google Scholar]
- 30.Hellingwerf KJ, Hendriks J, Gensch T. J. Phys. Chem. A. 2003;107:1082. [Google Scholar]
- 31.Glazer AN. Ann Rev. Biophys. Biomol. Struct. 1985;14:47. doi: 10.1146/annurev.bb.14.060185.000403. [DOI] [PubMed] [Google Scholar]


