

Abstract
Purpose
To retrospectively assess the main variables that affect the complete magnetic resonance (MR) imaging–guided resection of supratentorial low-grade gliomas.
Materials and Methods
Institutional review board approval was obtained for this retrospective HIPAA-compliant study, with the requirement for informed consent waived. Data from 101 patients (61 men, 40 women; mean age, 39 years; age range, 18–72 years) who had nonenhancing supratentorial mass lesions that were histopathologically diagnosed as low-grade (World Health Organization grade II) gliomas and consecutively underwent surgery with intraoperative MR imaging guidance were analyzed. There were 21 low-grade astrocytomas, 64 oligodendrogliomas, and 16 mixed oligoastrocytomas. Initial and residual tumor volumes were measured on intraoperative T2-weighted MR images and three-dimensional spoiled gradient-echo MR images. The anatomic relationships between the tumor and eloquent cortical and/or subcortical regions and the influence of these relationships on the extent of resection were analyzed on the basis of preoperative MR imaging findings. Summary measures, univariate Fisher exact test and t test, and multivariate logistic regression analyses were performed.
Results
Tumor volume ranged from 2.7–231.0 mL. Univariate analyses revealed the following tumor characteristics to be significant predictive variables of incomplete tumor resection: diffuse tumor margin on T2-weighted MR images, oligodendroglioma or oligoastrocytoma histopathologic type, and large tumor volume (P < .05 for all). Tumor involvement of the following structures was associated with incomplete resection: corpus callosum, corticospinal tract, insular lobe, middle cerebral artery, motor cortex, optic radiation, visual cortex, and basal ganglia (P < .05 for all). Multivariate analyses revealed that incomplete tumor resection was due to tumor involvement of the corticospinal tract (P < .01), large tumor volume (P < .01), and oligodendroglioma histopathologic type (P = .02).
Conclusion
The main variables associated with incomplete tumor resection in 101 patients were identified by using statistical predictive analyses.
Abbreviations: AUC = area under the receiver operating characteristic curve, CST = corticospinal tract, LGA = low-grade astrocytoma, LGG = low-grade glioma, LGO = low-grade oligodendroglioma, SPGR = spoiled gradient echo
In 2004, approximately 10 620 (57%) male individuals and 7880 (43%) female individuals in the United States developed cancer in the brain and other regions of the central nervous system. Approximately 12 760 new brain tumor–related deaths occur in this country each year (in 7280 [57%] male individuals and 5480 [43%] female individuals, http://www.cancer.org) (1).
One of the main causes of death among patients with low-grade glioma (LGG) is progression of the tumor to a malignant form (ie, anaplastic degeneration). Low-grade astrocytomas (LGAs) represent approximately 15% of all gliomas of the cerebral hemisphere in adults and approximately 25% of these tumors in children. The incidence of these tumors is estimated to be about one per 100 000 individuals per year among both children and adults. The peak prevalence of LGA (25%) occurs between the ages of 30 and 40 years, whereas 10% of cases occur at ages younger than 20 years. Histologically, more than 4% of hemispheric gliomas are low-grade oligodendrogliomas (LGOs) (2). The peak prevalence of these gliomas occurs at about 40 years of age, with a smaller peak at about 10 years of age. Epileptic seizure is the most common clinical manifestation at presentation.
At present, there is no generally accepted standard of management for supratentorial LGGs. The role of surgical resection, with the exception of that performed in patients with medically intractable epilepsy and symptomatic mass effect, remains controversial. The outcome of patients harboring supratentorial LGGs may be influenced by multiple variables, such as age, histologic tumor type, preoperative Karnofsky score, presence or absence of epilepsy as a presenting symptom, tumor size, tumor involvement of the contralateral hemisphere, and extent of tumor resection (3,4). A comprehensive review of the English-language literature on this topic published between 1970 and 2000 revealed that, although the evidence was not overwhelming, the data in favor of surgical resection were compelling (5).
Advances in Knowledge
By using univariate analyses, we identified 11 statistically significant variables that correlated with incomplete resection of supratentorial low-grade gliomas.
According to the results of multivariate analyses, three significant variables of incomplete tumor resection were large tumor volume, involvement of the corticospinal tract, and low-grade oligodendroglioma histopathologic type.
Several factors may hinder the goal of achieving total gross tumor resection. One of them is the difficulty in differentiating tumor tissue from the surrounding brain parenchyma at visual inspection alone. Another limitation in achieving maximal LGG resection is uncertainty regarding the tumor’s relationship with eloquent cortical and/or subcortical areas. Keeping the resection within the tumor’s boundaries, as defined on the basis of T1-weighted, T2-weighted, or intermediate-weighted magnetic resonance (MR) imaging findings does not guarantee a satisfactory postoperative neurologic outcome. Finally, the shape of the brain changes (commonly referred to as brain shift)—and, thus, the spatial location of the lesion may change—in response to surgical manipulation and anesthesia. Consequently, the accuracy of preoperatively acquired images in guiding the surgical resection diminishes as the surgery progresses (6,7).
Descriptions of predictive modeling for many clinical applications have been published in the radiologic literature (8–10). Such quantitative analysis may be helpful in refining therapeutic strategies and developing outcome evaluation protocols. Thus, the purpose of our study was to retrospectively assess the main variables that affect the complete intraoperative MR imaging–guided resection of supratentorial LGGs.
Materials and Methods
Patient Population and Diagnoses
The data on all patients who consecutively underwent surgery at our intraoperative MR imaging–guided therapy facility between January 1995 and January 2002 and fulfilled both the radiologic (hyperintense lesion on T2-weighted MR images, iso- or hypointense lesion on T1-weighted images, no contrast enhancement, and no substantial edema) and the histopathologic (as defined by the World Health Organization) (11) criteria for the diagnosis of supratentorial LGG were included in our retrospective analysis. Institutional review board approval for this Health Insurance Portability and Accountability Act–compliant study was obtained from Brigham and Women’s Hospital, Harvard Medical School, and informed consent was waived. Of the 101 patients included, 61 were men and 40 were women; their mean age was 39 years ± 10 (standard deviation) (range, 18–61 years). No pediatric patients (ie, younger than 18 years) were included in this study.
The histopathologic diagnosis of low-grade (World Health Organization grade II) astrocytoma, oligodendroglioma, or mixed oligoastrocytoma in each patient was confirmed by using permanent formalin-fixed sections. Tumors located in the posterior cranial fossa and pilocytic and opticohypothalamic gliomas were not included. Topographically, 56 tumors were confined to one cerebral lobe and 45 involved more than one lobe. The studied tumor series comprised 21 astrocytomas, 64 oligodendrogliomas, and 16 mixed oligoastrocytomas.
Total versus incomplete resection, as determined according to the final intraoperative MR imaging findings (obtained after surgical wound closure), was considered the reference standard. We found the quality of the final intraoperative MR images to be sufficient for determining the residual tumor volume.
Image Acquisition
After the patients were positioned for craniotomy and their heads were fixated by using an MR-compatible carbon fiber Mayfield clamp (Ohio Medical Instruments, Cincinnati, Ohio), they were examined in the following initial imaging protocol with use of a vertically open 0.5-T MR imaging unit (SignaSP; GE Medical Systems, Milwaukee, Wis) and the following parameters: (a) for transverse, sagittal, and coronal T1-weighted fast spin-echo imaging, 700/29 (repetition time msec/echo time msec), a 22-cm field of view, a 256 × 256 matrix, one signal acquired, a 3-mm section thickness, and a 1-mm intersection gap; (b) for transverse T2-weighted fast spin-echo imaging, 5000/99, a 22-cm field of view, a 256 × 256 matrix, two signals acquired, a 3-mm section thickness, and a 1-mm intersection gap; and (c) for transverse three-dimensional spoiled gradient-echo (SPGR) imaging, 15.5/5.2, a 45° flip angle, a 22-cm field of view, a 256 × 256 matrix, one signal acquired, a 2.5-mm section thickness, and a 0-mm intersection gap.
During the surgical intervention, T2-weighted fast spin-echo and three-dimensional SPGR MR image updates were obtained after the dural opening and any time the neurosurgeon believed that a brain shift had occurred or a substantial amount of tumor tissue had been removed. The final imaging protocol, which was performed after the dura mater was closed, included the same sequences that were performed at initial imaging. In addition, gradient-echo sequences involving a repetition time of 600 msec, increasing echo times (9, 40, and 60 msec), and a flip angle of 30° were added to rule out postoperative hemorrhage. The initial and final image data sets were used to determine the initial and residual tumor volumes, respectively.
Tumor Volume Measurements and Functional Correlation
Actual MR images were systematically reviewed (by I.F.T., F.A.J. and R.K., with 14, 34, and 23 years of experience in neuroimaging, respectively). The tumor’s location and relationships with both functionally critical cortical areas, such as the primary sensory-motor region, visual and speech cortices, and insular lobe, and functionally critical subcortical structures, such as the corticospinal tract (CST), optic radiation, arcuate and uncinate fasciculi, corpus callosum, and basal ganglia, were determined by using the initially obtained intraoperative MR image data set (obtained before the skin incision) on the basis of anatomic knowledge and comparisons with structures on standard anatomy atlases. The tumor was considered to involve an eloquent region if it infiltrated or bordered the areas just described. The two categories (infiltration vs displacement by tumor) were considered together because further differentiation between tumor infiltration and displacement, especially of the white matter tracts, on the basis of anatomic MR imaging findings alone may not be totally reliable (12–14).
First, the preoperative T2-weighted and three-dimensional SPGR MR images were rigidly registered. The volumetric three-dimensional SPGR image was used to obtain a better definition of the tumor’s location and anatomic relationships with eloquent cortical and subcortical areas. In the next step, the tumor was manually segmented on the T2-weighted fast spin-echo image since, according to the literature (15–18), abnormalities seen on T2-weighted images appear to reflect the tumor extent more accurately. The tumor volume was then calculated from the segmented area and the voxel size by using the 3D-Slicer software package (www.slicer.org) (19) (Fig 1a–1d).
Figure 1.
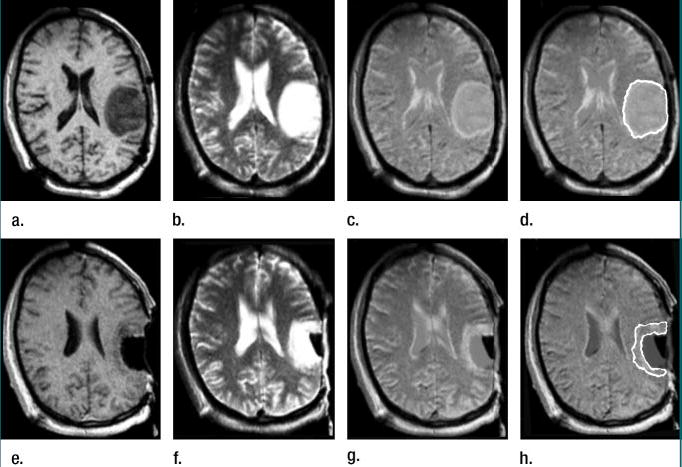
Left frontoparietal astrocytoma involving the pre- and postcentral gyri, as well as the subjacent white matter in 40-year-old man. (a–d) Transverse preoperative (a) three-dimensional SPGR (15.5/5.2, 45° flip angle, 22-cm field of view, 256 × 256 matrix, one signal acquired, 2.5-mm section thickness, 0-mm intersection gap) and (b) T2-weighted fast spin-echo (5000/99, 22-cm field of view, 256 × 256 matrix, two signals acquired, 3.0-mm section thickness, 1-mm intersection gap) MR images and (c, d) composite MR images obtained by rigidly registering the images in a and b. The result of tumor segmentation is shown in d. (e–h) Immediate postoperative (e) three-dimensional SPGR (15.5/5.2, 45° flip angle, 22-cm field of view, 256 × 256 matrix, one signal acquired, 2.5-mm section thickness, 0-mm intersection gap) and (f) T2-weighted fast spin-echo (5000/99, 22-cm field of view, 256 × 256 matrix, two signals acquired, 3.0-mm section thickness, 1-mm intersection gap) MR images (note presence of fluid in the resection cavity) and (g, h) composite MR images obtained by rigidly registering the images in e and f. The segmented residual tumor is shown in h.
To compute the residual tumor volume, the same steps were applied to the final T2-weighted fast spin-echo and three-dimensional SPGR MR images (Fig 1). To avoid the mislabeling of surgically induced changes as residual tumor, postoperative gradient-echo images that were obtained by using a repetition time of 600 msec, increasing echo times (9, 40, and 60 msec), and a flip angle of 30°, as well as preoperative gradient-echo and spin-echo MR images, were used for comparison.
Statistical Analyses
The retrospective database contained data on 101 patients, with 19 variables extracted for outcome analysis. Statistical methods included descriptive summary statistics, univariate analysis, multivariate predictive analysis, and receiver operating characteristic validation methods. Statistical significance was reached when the corresponding P value was less than or equal to .05 on the basis of hypothesis testing. These analyses were performed by using S-Plus, version 6.0 (Insightful, Seattle, Wash) and SAS (SAS Institute, Cary, NC) software packages.
The sample size calculation was based on the correlation between the initial tumor volume and the percentage of tumor resected. We assumed a moderately negative correlation coefficient (r = −0.59), and the results of our subsequent analysis confirmed this assumption. The necessary sample size of retrospectively examined patients per year (n) was calculated as follows: n = [(Zα + Zβ)/C]2 + 3, with a significance level of 10% (ie, Zα = 1.282) and a statistical power of 80% (ie, Zβ = 0.842) and where C = 0.5ln[(1 − r)/(1 + r)] = −0.678 (20), with r being the correlation coefficient. Under these conditions, a sample size of 13 subjects per year is necessary. In this 7-year retrospective study, the data on all patients who consecutively underwent surgery for LGG (n = 101, about 15 patients per year) were included. The statistical analyses were performed by three authors (K.H.Z., L.O., and J.G.B, with 8, 17, and 3 years of experience, respectively).
Univariate analysis
Of the 19 extracted variables, 18 were explanatory variables and one was the outcome variable. The categorical variables included the patient’s sex; the histopathologic diagnosis (ie, astrocytoma, oligodendroglioma, or mixed oligoastrocytoma); the tumor’s location on the dominant or nondominant side; tumor involvement of the primary motor, sensory, visual, or speech cortex (ie, Broca and Wernicke areas), insular lobe, CST, optic radiation, corpus callosum, and/or anterior, middle, and/or posterior cerebral arteries; the presence of a cystic cavity within the tumor boundaries; and the quality (ie, well defined vs diffuse) of the tumor margins on T2-weighted MR images. The choice of these variables was based on the following technical challenges encountered in surgical practice: (a) lesion identification (visualization) and targeting; (b) determination of the relationships between the lesion and the eloquent regions of the brain and between the lesion and vascular structures, which need to be preserved during surgery to avoid postoperative neurologic deficits; and (c) identification of tumor tissue characteristics that may affect the difficulty of surgery.
We first included each categorical variable in the univariate analysis and evaluated it by using two-sided Fisher exact tests to assess differences in the proportions of incomplete tumor resection. Correlation coefficients among categorical variables were not computed.
For the remaining two continuous variables, tumor volume (measured in milliliters) and patient age, we conducted a two-sided Student t test to compare the underlying means as stratified according to total versus incomplete resection.
Multivariate predictive analysis
We considered all 19 variables in the data set in the multivariate stepwise logistic regression analysis to assess the relationships between these variables and the resection outcome. A stepwise approach allowed the significant findings to be included in the regression equations. Both forward and backward selection procedures were employed. On the basis of the logistic regression equations and the most significant variables derived from the described multivariate analysis, a probabilistic prediction rule for dichotomized resection outcome was constructed.
Receiver operating characteristic validation analysis
Parametric receiver operating characteristic analyses were conducted (21). We evaluated and validated the effects of the significant variables derived from multivariate predictive modeling. Specifically, the distribution of volume, stratified according to the binary outcome, was tested by performing a z test of normality. Corresponding receiver operating characteristic curves were constructed under the binormal transformation models, which included a natural logarithm transformation (22). The mean area under the receiver operating characteristic curve (AUC) for the significant variables, along with the standard error of the mean, was computed (23,24). The effect of different thresholds on resection outcome was examined on the receiver operating characteristic curves.
Results
Univariate Analysis
The mean initial tumor volume in this series was 54.5 mL (range, 2.7–231.0 mL). The mean residual tumor volume was 20.2 mL (range, 0–166.2 mL). We improved the data skewness by applying a natural logarithm transformation, but normality was not achieved (P < .001). The median tumor volume was 43.2 mL, with an interquartile range of 16.6–76.3 mL. For the incomplete and total tumor resection groups, median tumor volumes were 55.96 (interquartile range, 31.3–95.6 mL; range, 6.6–312.6 mL) and 10.30 mL (interquartile range, 5.3–18.2 mL; range, 1.1–69.8 mL), respectively. Forty-nine (48%) patients (with 49 tumors) had tumors involving the CST. Only two (4%) of these 49 tumors were completely resected. In both cases, the tumor volume was small (2 mL and 16 mL). Example images are provided in Figures 1 and 2.
Figure 2.
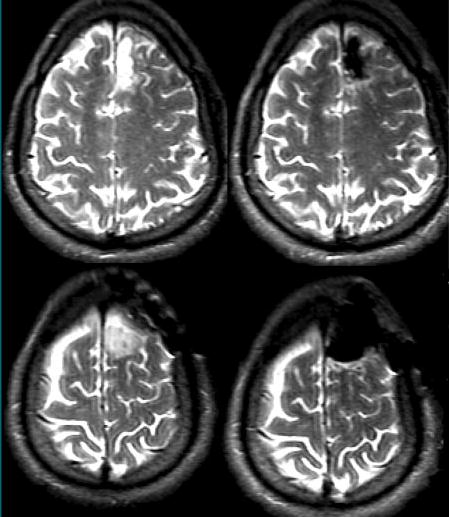
Preoperative (left) and intraoperative (right) transverse T2-weighted fast spin-echo MR images (5000/99, 22-cm field of view, 256 × 256 matrix, two signals acquired, 3.0-mm section thickness, 1-mm intersection gap) show complete tumor resection of a left frontal LGA located in the anterior portion of the superior frontal gyrus.
Of all the variables assessed individually in the univariate analyses, 11 were found to be significantly associated with incomplete tumor resection (Table 1). Among the tumor characteristics, an ill-defined tumor margin on T2-weighted MR images, LGO or low-grade mixed oligoastrocytoma histopathologic tumor type (ie, both types appear to be more difficult to resect than LGA), and large tumor volume were found to be associated with incomplete resection. Furthermore, tumor involvement of the following functionally critical structures led to incomplete resection: corpus callosum, CST, insular lobe, middle cerebral artery, primary motor cortex, optic radiation, visual cortex, and basal ganglia (one-sided P < .05 for all correlations). Other variables were not statistically significant, according to the univariate analysis results.
Table 1.
Significant Univariate Variables for Incomplete Tumor Resection
| Tumor Characteristic | Two-sided P Value* |
|---|---|
| Large tumor volume | <.001 |
| LGO or LGM histopathologic type† | .05 |
| Diffuse margin‡ | .07 |
| Functional areas of tumor involvement | |
| Corpus callosum | <.001 |
| CST | <.001 |
| Insula | <.001 |
| Optic radiation | <.00 |
| Basal ganglia | .001 |
| Middle cerebral artery | .004 |
| Mortor cortex | .01 |
| Visual cortex | .01 |
Note.—Two-sided P values of less than or equal to .10 and one-sided P values of less than or equal to .05 served as the thresholds for statistical significance.
P values for only the statistically significant variables are presented.
LGM = low-grade mixed oligoastrocytoma.
Diffuse margin on T2-weighted MR image.
Multivariate Predictive Analysis
Multivariate stepwise logistic regression analysis, with use of both forward and backward selections, yielded three variables that were significantly associated with incomplete resection: tumor involvement of the CST (P < .01), large tumor volume (P < .01), and LGO histopathologic type (P = .02).
Multivariate Tumor Resection Predictive Equation
The logistic regression analysis yielded the following equation with coefficients estimated from our multivariate analysis:
| (1) |
where PIR is the probability of an outcome of incomplete resection; logit(p) = log[p/(1 −p)]; and CST, LGO, and VOL, are the P values for the significance of tumor involvement of the CST, LGO histopathologic type, and large tumor volume, respectively, as variables leading to incomplete resection. In a similar manner, to compute the probability of incomplete resection, the above regression equation becomes
| (2) |
Receiver Operating Characteristic Validation Analysis
On the basis of tumor volume alone, both nonparametric and parametric estimation methods yielded an overall AUC of 0.90 (Fig 3). The receiver operating characteristic curves stratified according to two additional covariates, CST involvement and histopathologic type, also are presented (Fig 4). The areas under these curves were 0.96 and 0.81, with and without information on CST involvement, respectively; 0.93 for LGA type; and 0.84 for LGO type. The improvement in mean AUCs was statistically significant (P < .001) when, in addition to the main variable large tumor volume, the covariates CST involvement and histopathologic type were considered (Table 2). Thresholds of target resection of 100%, 85.5%, 75.0%, and 50.0% resulted in AUCs of 0.90, 0.85, 0.80, and 0.77, respectively (Fig 5).
Figure 3.
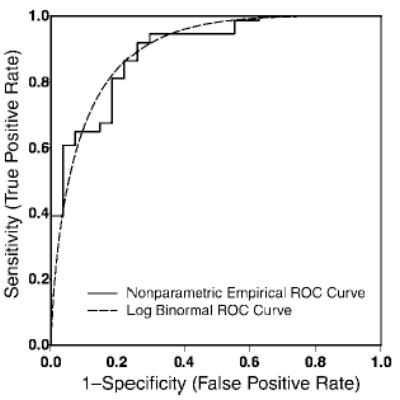
Receiver operating characteristic (ROC) curves for the tumor volume under the non-parametric and binormal models following natural logarithm transformation. On the basis of tumor volume alone, both nonparametric and parametric estimation methods yielded an overall AUC of 0.90.
Figure 4.
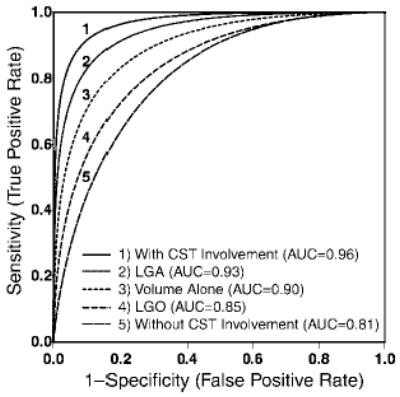
Receiver operating characteristic curves for the statistically significant variables: involvement of CST, LGA histopathologic type, tumor volume alone, LGO histopathologic type, and no CST involvement. These receiver operating characteristic curves stratified according to the two additional covariates, CST involvement and histopathologic type, also are presented. The areas under these curves were 0.96 and 0.81, with and without information on CST involvement, respectively; 0.93 for LGA histopathologic type; and 0.84 for LGO histopathologic type. An improvement in mean AUCs was demonstrated when, in addition to the main variable of large tumor volume, CST involvement and histopathologic type were considered.
Table 2.
AUCs for Significant Variables
| Multivariate Analysis Variable | Mean AUC* |
|---|---|
| Main variable: large tumor volume (without covariates) | 0.90 (0.03) |
| Covariate 1: CST | |
| With CST involvement | 0.96 (0.02) |
| Without CST involvement | 0.81 (0.06) |
| Covariate 2: histopathologic type | |
| LGA | 0.93 (0.06) |
| LGO | 0.84 (0.05) |
Numbers in parentheses are standard errors of the means.
Figure 5.
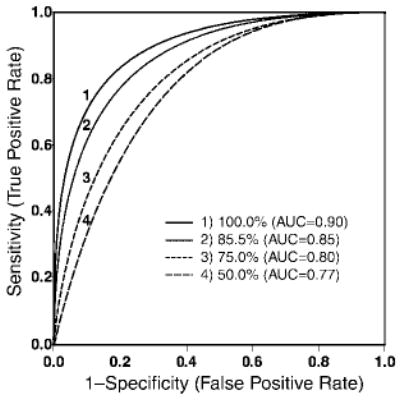
Receiver operating characteristic curves under four thresholds—50.0%, 75.0%, 85.5%, and 100%—for tumor resection as a binary reference standard. For an AUC of 0.85, the corresponding resection threshold was 85.5%. Target resection thresholds of 100%, 85.5%, 75.0%, and 50.0% resulted in AUCs of 0.90, 0.85, 0.80, and 0.77, respectively.
Discussion
With use of computerized image analysis and statistical tools, the main variables associated with incomplete resection of supratentorial LGGs were identified, and on the basis of these results, a statistical predictive model of tumor resectability was developed.
Although the optimal therapeutic approach for LGGs is controversial, most agree that recurrence with anaplastic degeneration is the major cause of mortality in patients with these tumors. Consequently, one of the major aims of any therapy is to prevent or delay anaplastic degeneration. The decision to perform surgery in these patients is based on the presumption that by eliminating a substantial amount of tumor cells, surgical resection may reduce the rates of recurrence and malignant progression and increase the survival time (25). Although this hypothesis has not yet been proved, evidence in favor of surgical resection is accumulating.
Much of the debate regarding the role of surgical resection for the management of LGG is centered around the fact that most of the available related studies have been retrospective and often have been based on a subjective assessment of the extent of resection. There have been occasional reports of tumor volume as it relates to outcome, but there are substantial limitations in the techniques used in these studies. For instance, in the study of Berger and Rostomily (25), computed tomographic (CT) data were included in the assessment. However, the sensitivity of CT in the detection of parenchymal lesions is inferior to that of MR imaging (18,26–28).
The results of some retrospective studies have suggested that among patients undergoing surgical resection, those who undergo total gross removal of LGGs have a longer survival than do those who do not undergo cytoreductive surgery (25,29,30). For example, Janny et al (29) observed 5- and 10-year survival rates of 88% and 68%, respectively, with completely resected LGAs, compared with survival rates of 57% and 31%, respectively, with incomplete or no surgical resection. Berger et al (31) found that the patients who were most at risk for tumor recurrence and malignant progression were those who had larger tumors preoperatively and residual tumor postoperatively. This finding emphasizes the need for objective patient selection tools, to identify patients who would benefit most from surgical resection, and to refer those patients in whom a substantial tumor burden reduction is improbable and the risk of postoperative morbidity is high for other types of treatment. Our results show that the development of such tools is feasible with use of anatomic MR imaging.
The fact that the majority of the patients in this retrospective series (64 of 101) received a diagnosis of LGO may have introduced a bias since, according to some authors (2), oligodendrogliomas represent only about 4% of hemispheric gliomas. However, more recent study results indicate that oligodendrogliomas are often underdiagnosed and may represent more than 30% of cerebral gliomas (32,33). Furthermore, our results show that complete resection of oligodendrogliomas is more difficult to achieve than complete resection of astrocytomas. Thus, although no prior knowledge of the histopathologic type was available in most cases, many oligodendrogliomas may have been judged to be difficult to resect and selected for intraoperative MR imaging–guided resection on the basis of their imaging features.
Our series also included a large number of patients with tumors involving the CST. Since these patients underwent tumor resection with intraoperative MR imaging guidance, which is generally reserved for difficult surgical procedures, this was not surprising.
Another limitation of our retrospective study is the fact that it was based exclusively on the findings on intraoperative anatomic MR images, which were acquired by using a midfield (ie, 0.5-T magnetic field strength) interventional imaging unit. The tumor’s relationship with functionally critical structures was estimated on the basis of anatomic knowledge and comparisons with structures on standard anatomy atlases since anatomic MR imaging does not enable direct visualization of cortical activity or white matter structures. Imaging modalities such as magnetic source imaging and functional MR imaging have enabled visualization of task-dependent cortical activity. Diffusion-tensor MR imaging allows visualization of the location and extent of white matter tracts.
Studies performed to analyze the influence of intraaxial tumors on the surrounding brain parenchyma have revealed that such interactions are complex. Eloquent cortical areas and major white matter tracts may be displaced, infiltrated, or destroyed by tumor. The results of a magnetic source imaging study conducted in a series of 106 patients with brain tumors demonstrated the presence of functional cortex within or at the border of the radiologic abnormality in 24.5% of the patients (34). These results are consistent with those obtained by means of direct intraoperative cortical stimulation (35,36). Diffusion-tensor MR imaging studies have revealed the presence of morphologically preserved white matter fiber tracts in large proportions of low- and high-grade gliomas (12–14,37). Functional and diffusion-tensor MR imaging examinations are increasingly being performed to preoperatively—and even intraoperatively—identify eloquent cortical areas and white matter tracts. However, in this series of retrospectively examined patients, the availability of functional and diffusion-tensor MR imaging was limited at the time of surgery. The inclusion of such multimodal information may increase the accuracy of our predictive model.
Footnotes
Supported by NIH grants R01-LM007861, P41-RR13218, P01CA67165, and P41-RR019703.
From the Departments of Radiology (I.F.T., K.H.Z., L.O., J.G.B., R.K., F.A.J.) and Neurosurgery (P.M.B.), Brigham and Women’s Hospital; Department of Health Care Policy (K.H.Z.); and Division of Health Sciences & Technology (L.O.), Harvard Medical School, 75 Francis Street, Boston, MA 02115.
References
- 1.American Cancer Society. Cancer facts and figures: 2005. Atlanta, Ga: American Cancer Society, 2005; 6.
- 2.Walker DG, Kaye AH. Low grade glial neoplasms. J Clin Neurosci. 2003;10(1):1–13. doi: 10.1016/s0967-5868(02)00261-8. [DOI] [PubMed] [Google Scholar]
- 3.Nicolato A, Gerosa M, Fina P, Iuzzolino P, Giorgiutti F, Bricolo A. Prognostic factors in low-grade supratentorial astrocytomas: a uni-multivariate statistical analysis in 76 surgically treated adult patients. Surg Neurol. 1995;44:208–223. doi: 10.1016/0090-3019(95)00184-0. [DOI] [PubMed] [Google Scholar]
- 4.Pignatti F, van den Bent N, Curan D, et al. Prognostic factors for survival in adult patients with cerebral low-grade glioma. J Clin Oncol. 2002;20(8):2076–2084. doi: 10.1200/JCO.2002.08.121. [DOI] [PubMed] [Google Scholar]
- 5.Keles GE, Lamborn KR, Berger MS. Low-grade hemispheric gliomas in adults: a critical review of extent of resection as a factor influencing outcome. J Neurosurg. 2001;95(5):735–745. doi: 10.3171/jns.2001.95.5.0735. [DOI] [PubMed] [Google Scholar]
- 6.Nabavi A, Black P, Gering DT, et al. Serial intraoperative magnetic resonance imaging of brain shift. Neurosurgery. 2001;48(4):787–798. doi: 10.1097/00006123-200104000-00019. [DOI] [PubMed] [Google Scholar]
- 7.Nimsky C, Ganslandt O, Cerny S, Hastreiter P, Greiner G, Fahlbusch G. Quantification of, visualization of, and compensation for brain shift using intraoperative magnetic resonance imaging. Neurosurgery. 2000;47(5):1070–1080. doi: 10.1097/00006123-200011000-00008. [DOI] [PubMed] [Google Scholar]
- 8.Roth Y, Tichler T, Kostenich G, et al. High-b-value diffusion-weighted MR imaging for pretreatment prediction and early monitoring of tumor response to therapy in mice. Radiology. 2004;232(3):685–692. doi: 10.1148/radiol.2322030778. [DOI] [PubMed] [Google Scholar]
- 9.Liu Y, Karonen JO, Vanninen RL, et al. Acute ischemic stroke: predictive value of 2D phase-contrast MR angiography—serial study with combined diffusion and perfusion MR imaging. Radiology. 2004;231(2):517–527. doi: 10.1148/radiol.2312030565. [DOI] [PubMed] [Google Scholar]
- 10.Kress B, Griesbeck F, Stippich C, Bahren W, Sartor K. Bell palsy: quantitative analysis of MR imaging data as a method of predicting outcome. Radiology. 2004;230(2):504–509. doi: 10.1148/radiol.2302021353. [DOI] [PubMed] [Google Scholar]
- 11.Kleihues P, Burger P, Scheithauer B. The new WHO classification of brain tumours. Brain Pathol. 1993;3:255–268. doi: 10.1111/j.1750-3639.1993.tb00752.x. [DOI] [PubMed] [Google Scholar]
- 12.Mori S, Fredericksen K, van Zijl PC, et al. Brain white matter anatomy of tumor patients evaluated with diffusion tensor imaging. Ann Neurol. 2002;51(3):377–380. doi: 10.1002/ana.10137. [DOI] [PubMed] [Google Scholar]
- 13.Witwer BP, Moftakhar R, Hasan KM, et al. Diffusion-tensor imaging of white matter tracts in patients with cerebral neoplasm. J Neurosurg. 2002;97(3):568–575. doi: 10.3171/jns.2002.97.3.0568. [DOI] [PubMed] [Google Scholar]
- 14.Talos IF, O’Donnell L, Westin CF, et al. Diffusion tensor and functional MRI fusion with anatomical MRI for image-guided neurosurgery. Lect Notes Comput Sci. 2003;2878:407–415. [Google Scholar]
- 15.Nimsky C, Fujita A, Ganslandt O, Von Keller B, Fahlbusch R. Volumetric assessment of glioma removal by intraoperative high-field magnetic resonance imaging. Neurosurgery. 2004;55(2):358–370. doi: 10.1227/01.neu.0000129694.64671.91. [DOI] [PubMed] [Google Scholar]
- 16.Nimsky C, Ganslandt O, Buchfelder M, Fahlbusch R. Glioma surgery evaluated by intraoperative low-field magnetic resonance imaging. Acta Neurochir Suppl. 2003;85:55–63. doi: 10.1007/978-3-7091-6043-5_8. [DOI] [PubMed] [Google Scholar]
- 17.Schneider JP, Schultz T, Schmidt F, et al. Gross-total surgery of supratentorial low-grade gliomas under intraoperative MR guidance. AJNR Am J Neuroradiol. 2001;22(1):89–98. [PMC free article] [PubMed] [Google Scholar]
- 18.Kelly PJ. Computed tomography and histologic limits in glial neoplasms: tumor types and selection for volumetric resection. Surg Neurol. 1993;39(6):458–465. doi: 10.1016/0090-3019(93)90031-u. [DOI] [PubMed] [Google Scholar]
- 19.Gering DT, Nabavi A, Kikinis R, et al. An integrated visualization system for surgical planning and guidance using image fusion and an open MR. J Magn Reson Imaging. 2001;13(6):967–975. doi: 10.1002/jmri.1139. [DOI] [PubMed] [Google Scholar]
- 20.Zou KH, Tuncali K, Silverman SG. Correlation and simple linear regression. Radiology. 2003;227(3):617–622. doi: 10.1148/radiol.2273011499. [DOI] [PubMed] [Google Scholar]
- 21.Obuchowski NA. Receiver operating characteristic curves and their use in radiology. Radiology. 2003;229(1):3–8. doi: 10.1148/radiol.2291010898. [DOI] [PubMed] [Google Scholar]
- 22.Zou KH, Warfield SK, Fielding JR, et al. Statistical validation based on parametric receiver operating characteristic analysis of continuous classification data. Acad Radiol. 2003;10(12):1359–1368. doi: 10.1016/S1076-6332(03)00538-5. [DOI] [PMC free article] [PubMed] [Google Scholar]
- 23.Hanley JA, McNeil BJ. The meaning and use of the area under a receiver operating characteristic (ROC) curve. Radiology. 1982;143(1):29–36. doi: 10.1148/radiology.143.1.7063747. [DOI] [PubMed] [Google Scholar]
- 24.Hanley JA, McNeil BJ. A method of comparing the areas under receiver operating characteristic curves derived from the same cases. Radiology. 1983;148(3):839–843. doi: 10.1148/radiology.148.3.6878708. [DOI] [PubMed] [Google Scholar]
- 25.Berger MS, Rostomily R. Low grade gliomas: functional mapping, resection strategies, extent of resection and outcome. J Neurooncol. 1997;34:85–101. doi: 10.1023/a:1005715405413. [DOI] [PubMed] [Google Scholar]
- 26.Freund M, Hahnel S, Sommer C, et al. CT and MRI findings in gliomatosis cerebri: a neuroradiologic and neuropathologic review of diffuse infiltrating brain neoplasms. Eur Radiol. 2001;11(2):309–316. doi: 10.1007/s003300000653. [DOI] [PubMed] [Google Scholar]
- 27.Whelan HT, Clanton JA, Wilson RE, Tulipan NB. Comparison of CT and MRI brain tumor imaging using a canine glioma model. Pediatr Neurol. 1988;4(5):279–283. doi: 10.1016/0887-8994(88)90066-5. [DOI] [PubMed] [Google Scholar]
- 28.Yokoi K, Kamiya N, Matsuguma H, et al. Detection of brain metastasis in potentially operable non-small cell lung cancer: a comparison of CT and MRI. Chest. 1999;115(3):714–719. doi: 10.1378/chest.115.3.714. [DOI] [PubMed] [Google Scholar]
- 29.Janny P, Cure H, Mohr M, et al. Low grade supratentorial astrocytomas: management and prognostic factors. Cancer. 1994;73(7):1937–1945. doi: 10.1002/1097-0142(19940401)73:7<1937::aid-cncr2820730727>3.0.co;2-g. [DOI] [PubMed] [Google Scholar]
- 30.Piepmeier J, Christopher S, Spencer D, et al. Variations in the natural history and survival of patients with supratentorial low-grade astrocytomas. Neurosurgery. 1996;38(5):872–878. doi: 10.1097/00006123-199605000-00002. [DOI] [PubMed] [Google Scholar]
- 31.Berger MS, Deliganis AV, Dobbins J, Keles GE. The effect of extent of resection on recurrence in patients with low grade cerebral hemisphere gliomas. Cancer. 1994;74(6):1784–1791. doi: 10.1002/1097-0142(19940915)74:6<1784::aid-cncr2820740622>3.0.co;2-d. [DOI] [PubMed] [Google Scholar]
- 32.Daumas-Duport C, Varlet P, Tucker ML, Beuvon F, Cervera P, Chodkiewicz JP. Oligodendrogliomas. I. Patterns of growth, histological diagnosis, clinical and imaging correlations: a study of 153 cases. J Neurooncol. 1997;34(1):37–59. doi: 10.1023/a:1005707203596. [DOI] [PubMed] [Google Scholar]
- 33.Fortin D, Cairncross GJ, Hammond RR. Oligodendroglioma: an appraisal of recent data pertaining to diagnosis and treatment. Neurosurgery. 1999;45(6):1279–1291. doi: 10.1097/00006123-199912000-00001. [DOI] [PubMed] [Google Scholar]
- 34.Schiffbauer H, Ferrari P, Rowley HA, Berger MS, Roberts TP. Functional activity within brain tumors: a magnetic source imaging study. Neurosurgery. 2001;49(6):1313–1321. doi: 10.1097/00006123-200112000-00005. [DOI] [PubMed] [Google Scholar]
- 35.Ojemann JG, Miller JW, Silbergeld DL. Preserved function in brain invaded by tumor. Neurosurgery. 1996;39(2):253–258. doi: 10.1097/00006123-199608000-00003. [DOI] [PubMed] [Google Scholar]
- 36.Skirboll SS, Ojemann GA, Berger MS, Lettich E, Winn HR. Functional cortex and subcortical white matter located within gliomas. Neurosurgery. 1996;38(4):678–684. [PubMed] [Google Scholar]
- 37.Mori S, van Zijl PC. Fiber tracking: principles and strategies—a technical review. NMR Biomed. 2002;15(7–8):468–480. doi: 10.1002/nbm.781. [DOI] [PubMed] [Google Scholar]