

Abstract
The leukocyte integrin αLβ2 mediates cell adhesion and migration during inflammatory and immune responses. Ligand binding of αLβ2 is regulated by or induces conformational changes in the inserted (I) domain. By using a micropipette, we measured the conformational regulation of two-dimensional (2D) binding affinity and the kinetics of cell-bound intercellular adhesion molecule-1 interacting with αLβ2 or isolated I domain expressed on K562 cells. Locking the I domain into open and intermediate conformations with a disulfide bond increased the affinities by ~8000- and ~30-fold, respectively, from the locked closed conformation, which has similar affinity as the wild-type I domain. Most surprisingly, the 2D affinity increases were due mostly to the 2D on-rate increases, as the 2D off-rates only decreased by severalfold. The wild-type αLβ2, but not its I domain in isolation, could be up-regulated by Mn2+ or Mg2+ to have high affinities and on-rates. Locking the I domain in any of the three conformations abolished the ability of divalent cations to regulate 2D affinity. These results indicate that a downward displacement of the I domain C-terminal helix, induced by conformational changes of other domains of the αLβ2, is required for affinity and on-rate up-regulation.
Lymphocyte function-associated antigen-1, or αLβ2 integrin, mediates a variety of leukocyte adhesion and signaling processes, such as firm adhesion to the vascular surface during the initiation of inflammatory reaction or during lymphocyte trafficking, transendothelial migration into inflamed tissues or lymphoid tissues (1), and adhesion to antigen-presenting cells to form the immunological synapse (2). αLβ2 binds to members of the immunoglobin superfamily of cell adhesion molecules, including intercellular adhesion molecule-1 (ICAM-1).3 Ligand binding of inactive αLβ2 is of too low an affinity to be detected by many conventional methods, but high affinity can be induced by cell activation, a process referred to as inside-out signaling. Conformational changes in the αLβ2 molecule, especially in the inserted (I) domain, are required for such affinity up-regulation. Ligand binding to the I domain can also induce conformational changes that propagate from the integrin head to its tail to enable binding of cytoplasmic molecules, a process referred to as outside-in signaling. Thus, conformational changes are crucial to the regulation of integrin functions (3).
Although the crystal structures of several integrin domains have been solved, including the whole extracellular segment of the αvβ3 integrin alone (4) and in complex with an RGD peptide (5), the dynamic process for the conformational regulation of integrin binding affinity and kinetics remains elusive. The ligand-binding site of αLβ2 for ICAM-1 is located at the I domain in the αL subunit, which is so named because its ~200 amino acids are inserted between blades 2 and 3 of the β-propeller domain (6). The I domain is also named αA domain because it assumes a dinucleotide-binding fold with a central β-sheet surrounded by several α helices that is similar to the A domains of von Willebrand factor (7). The C and N termini on one face connect the I domain to the β-propeller domain. A metal ion-dependent adhesion site (MIDAS) is located on the opposite face, which, together with the surrounding residues, forms the ICAM-1-binding site. Crystallographic (8), nuclear magnetic resonance (9, 10), and molecular dynamics simulation (11) studies have provided evidence for conformational changes of the αL I domain among three distinct conformations, named open, intermediate, and closed conformers. It has been proposed that three residues of the β6-α7 loop interact with the α1 helix one at a time to hold the α7 helix in three distinct positions that correspond to these three conformations; each position moves the α7 helix downward by one helical turn (8). The movement of the α7 helix is linked to a repacking of the hydrophobic face of this α helix, which is coupled to the structural rearrangement of the MIDAS and divalent cation coordination (Fig. 1A).
FIGURE 1. Structures and conformational changes of I domain and αLβ2.
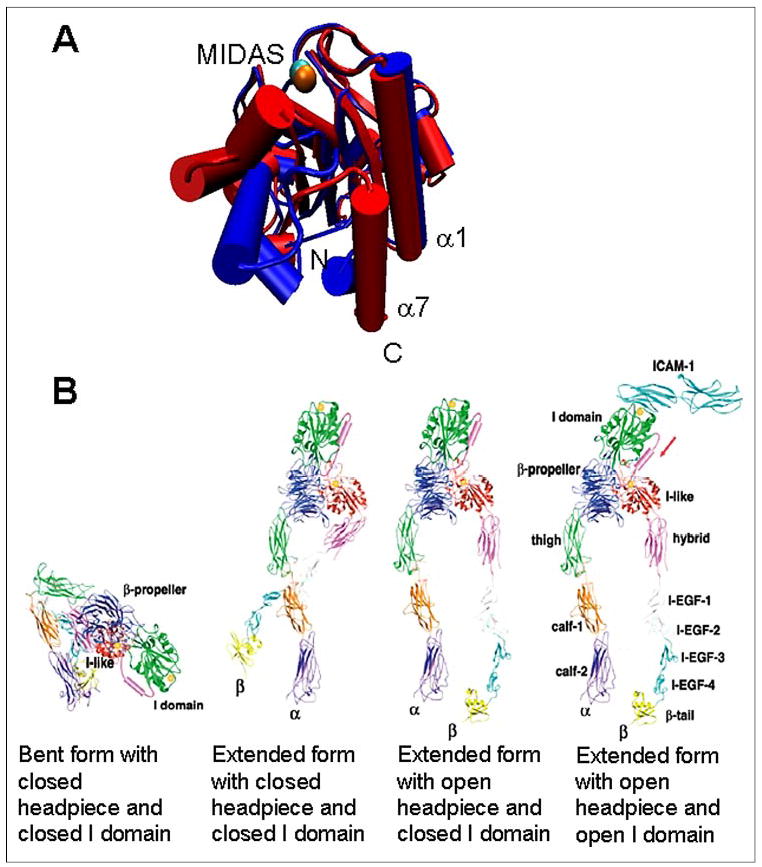
A, overlay of the locked open (blue) and WT closed (red) I domain structures showing the conformational change of the I domain (drawn by Visual Molecular Dynamics using Protein Data Bank codes 1MQ9 and 1MOP, respectively). MIDAS is located on the top of the I domain with a coordinating Mn2+ ion, which is shown in cyan (closed) and orange (open). The N and C termini are located on the bottom (indicated). B, models for conformational states of the extracellular segment of αLβ2. The conformation states are indicated in the figure (adapted from Ref. 56).
The regulation of ligand binding affinity and kinetics of αLβ2 by conformational changes has been examined by using mutants that introduce a pair of cysteines to form a disulfide bond to lock the αL I domain in either the closed, intermediate, or open conformation by altering the α7 helix position (8, 12). The isolated locked I domain mutants exhibited low (6.3 × 10² m−1), intermediate (3.3 × 10⁵ m−1), and high (6.7 × 10⁶ m−1) three-dimensional (3D) affinities for ICAM-1 as measured by surface plasmon resonance (SPR) (8, 13). The increase in on-rate (~50–60-fold) and the decrease in off-rate (~100–250-fold) both contributed to the increase in binding affinity from the locked closed to the locked open I domains. The isolated locked open I domain was sufficient for full adhesive activity, since it had a 3D binding affinity for ICAM-1 (and mediated ICAM-1-dependent cell adhesion) at a level similar to those of fully activated wild-type (WT) αLβ2 (12–14).
Ligand binding in the I domain can be regulated by and can induce a series of intra- and inter-domain conformational changes, which propagate through other domains from the cytoplasmic tail to the I domain (inside-out signaling) or from the I domain to the cytoplasmic tail (outside-in signaling). It has been proposed that, prior to the initiation of inside-out signaling, the inactive integrin assumes a bent conformation. Binding of an intracellular protein (e.g. talin) to the integrin cytoplasmic domain may result in the separation of the α- and β-cytoplasmic/transmembrane domains, thereby destabilizing the extracellular interface between the two subunits. This may lead to a switchblade-like opening of the bent integrin, resulting in an extended conformation. The disruption of the subunit interface may enable the hybrid domain to swing out from the I-like domain in the β subunit, facilitating the downward movement of the I-like domain C-terminal α helix that may be coupled to a rearrangement in the MIDAS of the I-like domain (Fig. 1B) (15–17). An “intrinsic ligand,” a residue in the I domain α7 helix, may bind the activated I-like domain MIDAS (18, 19). This binding may pull down the α7 helix of the I domain and convert it to the activated conformation for high affinity ligand binding (20).
Although various lines of evidence have been obtained in support of the above models for affinity/kinetic regulation by conformational changes, previous measurements were made by SPR with one of the binding partners in the fluid phase, i.e. 3D kinetics and affinity4 (8, 13, 14). By comparison, cell-cell adhesion and cell-substrate adhesion are mediated by binding between receptors and ligands anchored on two apposing surfaces, i.e. two-dimensional (2D) interactions. The binding affinity Ka is the ratio of equilibrium concentration of bonds to those of free receptors and ligands. However, concentration is measured as number of molecules per volume in 3D but number of molecules per area (i.e. surface density) in 2D, resulting in different units for Ka (m−1 in 3D and μm2 in 2D). The kinetic on-rate kon also has different units in different dimensions (m−1 s−1 in 3D and μm2 s−1 in 2D). The 2D kon is the rate of bond formation between unit densities of receptors and ligands that are respectively anchored on two apposing surfaces of unit area. By comparison, the 3D kon is the rate of bond formation between unit concentrations of receptors and ligands in solution of unit volume. There has been increasing recognition that 2D binding parameters cannot be readily converted from their 3D counterparts (21). It is therefore important to directly measure in situ the more physiologically relevant 2D binding affinity and kinetic rates.
Here we quantified the regulation of 2D binding affinity and kinetics of the αLβ2-ICAM-1 interaction by conformational changes using the micropipette adhesion frequency experiment (22). Our results showed that when expressed on the cell surface, isolated locked I domains exhibited binding affinities and kinetics similar to those of whole αLβ2 integrins containing I domains locked in the corresponding conformations. Up-regulation of ligand binding affinity of the αLβ2 was mostly because of the conformational changes in the I domain, which in turn was regulated by other domains by pulling down the I domain C-terminal α7 helix. Our data also revealed a surprising discrepancy between the 2D and 3D off-rate measurements. The 2D off-rates of the locked open and locked closed I domains only differed a few fold, which is in sharp contrast to the 3D results of ~100-fold difference.
EXPERIMENTAL PROCEDURES
Cell Lines, Proteins, and Antibodies
The human erythroleukemia cell line K562 stably transfected with WT, locked open (K287C/K294C), locked intermediate (L161C/F299C), or locked closed (L289C/K294C) αL I domain fused with a platelet-derived growth factor receptor transmembrane domain and the first five amino acids of its cytoplasmic domain or with intact αLβ2 containing the WT or locked I domains have been described previously (8, 13).
Human red blood cells (RBCs) were isolated from whole peripheral blood of healthy donors. Approximately 7 ml of whole blood was collected by venipuncture into sterile Vacutainers (BD Biosciences) containing EDTA. This was carefully layered over 3 ml of Histopaque 1119 (Sigma) and centrifuged (30 min, 2000 × g, room temperature). The supernatant was removed, and the pelleted RBCs were washed once in RBC storage solution (EAS45) (23). RBCs were stored aseptically at 4 °C in EAS45 at 20% hematocrit. Mouse and human glycosylphosphatidylinositol (GPI)-anchored ICAM-1 molecules were purified from Chinese hamster ovary cell transfectants by affinity chromatography5 (24).
Fluorescein isothiocyanate (FITC)-conjugated mouse anti-human αL I domain monoclonal antibody (mAb) MEM-25 (IgG1) (Caltag Laboratories, Burlingame, CA) and a nonbinding FITC-conjugated mouse isotype-matched control antibody were used to determine surface expression of the I domain and αLβ2 on K562 cells by immunofluorescence flow cytometry. FITC-conjugated mouse mAb MEM-111 (Caltag Laboratories) and FITC-conjugated rat mAb YN1/1.7.4 (eBioscience, San Diego) were used to determine the site densities of the reconstituted human and mouse ICAM-1, respectively. The mouse anti-human αL mAb 38 (Ancell, Bayport, MN) was used for antibody-antigen adhesion kinetic measurement. FITC-conjugated rat anti-mouse IgG2a mAb (Fc-specific) (Pharmingen) was used to measure the site density of mAb 38 coated on RBCs. The anti-ICAM-1-capturing mouse mAb CA7 was a generous gift of Dr. Robert Rothlein (Boehringer-Ingelheim Pharmaceuticals, Ridgefield, CT). The integrin-activating mAb CBR LFA1/2 has been described previously (25).
Coupling of ICAM-1 to RBCs
Mouse or human GPI-ICAM-1 was reconstituted in RBC membrane by a 2.5-h incubation with different concentrations to achieve the desired site densities (26). Capture antibody CA7 or anti-human αL I domain mAb 38 was covalently coupled to the membranes of RBCs by the chromium chloride (CrCl3) method described previously (22). CA7-coated RBCs were subsequently washed and incubated with human ICAM-1. Coated RBCs were washed and assayed for coating density by flow cytometry and stored in EAS45 at 4 °C.
Cell Sorting and Site Density Determination
Sorting of K562 cells to express several narrowly distributed densities (with the mean ranging from 10 to 2000 μm−2) of isolated I domains and whole αLβ2 were done using a BD FACSVantage SE flow cytometer (Immunocytometry Systems). Molecular site densities on the cell surface were determined by flow cytometry. For the isolated I domain and αLβ2 site densities, K562 cells were incubated with FITC MEM-25 (or isotype-matched FITC mouse control antibody) for 30 min at room temperature. For mouse and human ICAM-1 site densities, RBCs with and without (for controls) ICAM-1 coupling were incubated with FITC YN1/1.7.4 and FITC MEM-111, respectively. For mAb 38 site density, RBCs with and without (for controls) mAb 38 coupling were incubated with FITC rat anti-mouse IgG2a mAb. Samples were read on a BD LSR flow cytometer (BD Biosciences) using fluorescence-activated cell sorter DiVa 3.1 software. Standard beads (Quantum™ 25 FITC High Level, Bangs Laboratory, Fishers, IN) were prepared for quantification of molecules of equivalent soluble fluorophore (MESF). A calibration curve was generated by plotting the MESF against the mean fluorescence intensities of each of the five bead populations. The MESF for the cells were calculated by comparing the fluorescence intensities of the cells with those of the standard beads. The site densities on the cell surface of the molecule in question were determined by dividing the MESF value by the apparent cell surface area and the fluorophore/protein ratio.
Micropipette Adhesion Frequency Assay
The micropipette adhesion frequency assay has been described previously (22). K562 cells were washed with Hanks’ balanced salt solution without calcium and without magnesium (HBSS−) three times before the experiments and resuspended in HBSS− with or without 2 mm Mn2+ or 2 mm Mg2+ plus 2 mm of EGTA in the presence or absence of 10 mm dithiothreitol (DTT) and 45–55% double distilled H2O to partially swell the RBCs. In some control experiments, K562 cells were washed with HBSS− with 5 mm EDTA and then with HBSS− before being assayed in HBSS− with or without 5 mm EDTA. In other control experiments, the HBSS−/EDTA-washed cells were incubated with 2 mm of Mn2+, Mg2+ (plus 2 mm EGTA), or Ca2+ and then washed with HBSS− before being assayed in HBSS−. By using two micropipettes, a K562 cell and an RBC were aspirated gently and aligned with a small axial gap between them (Fig. 2). One pipette was connected to a computer-controlled piezoelectric actuator that was programmed to move back and forth at a uniform rate of 1 μm/s. Cells were placed in contact for a prescribed duration and then retracted away from each other. Upon retraction, the unaspirated portion of the RBC was either separated freely from the K562 cell and returned to its original spherical shape, indicating no adhesion (scoring 0), or remained bound with an elongated shape, indicating adhesion (scoring 1), until final detachment by further retraction. This test cycle was repeated 100 times using the same pair of cells, keeping the contact duration (t) and the area (Ac, ~3 μm2) constant, and averaging the adhesive scores to calculate an adhesion frequency (Pa). More than 5 pairs of cells were tested per contact time to obtain the mean ± S.E. of Pa at that t. The contact duration was varied from 0.5 to 60 s to obtain a Pa versus t binding curve. For each species of I domain or αLβ2, 2–3 curves were generated using a total of ~100 pairs of cells by varying the site densities of I domain/αLβ2 (mr) or ICAM-1 (ml). The 2D effective binding affinity (AcKa) and off-rate (koff) were calculated by fitting Equation 1 (22)
FIGURE 2. Micropipette adhesion experiment.
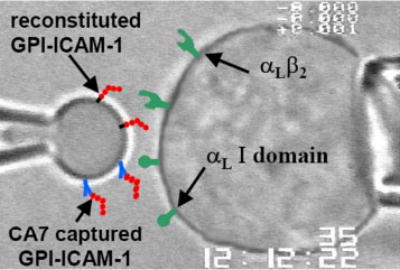
Photomicrograph of an RBC (left) coated with ICAM-1 and a K562 cell (right) expressing αLβ2 molecular construct during a micropipette adhesion experiment is shown. A composite schematic drawing is superimposed on the image to illustrate all the integrin and ICAM-1 molecules used in the present study.
| (Eq. 1) |
to the binding curves by using iteratively reweighted nonlinear regression (27). For some experiments, the adhesion frequency was determined at sufficiently long contact duration without measuring a full binding curve to simply estimate the effective binding affinity (AcKa) from Equation 2,
| (Eq. 2) |
which is derived from the steady-state version (i.e. t → ∞) of Equation 1.
RESULTS
Measuring Specific Integrin-ICAM-1 Binding Affinity and Kinetics
Expressed on the cell surface, both isolated I domains and whole αLβ2 heterodimers mediated sufficient levels of adhesion with ICAM-1 reconstituted on RBC to be measured by the micropipette, which is capable of measuring interactions with affinities too low for many conventional adhesion assays to detect (28). By sorting the K562 cells to express appropriate levels of I domain or whole αLβ2 and reconstituting appropriate levels of ICAM-1 on RBCs, the equilibrium frequencies of adhesion of each pair of interacting molecules were adjusted to midrange levels, i.e. 0.2–0.8. To estimate reliably binding parameters, 2–3 curves were generated for each species by varying the site densities of integrin or ICAM-1 or both (Fig. 3). The detected interactions were mostly specific, as the adhesion frequency between the K562 cells and RBCs without ICAM-1 coupling was <0.06, which was deemed as non-specific binding (Fig. 3 and data not shown). The use of Equations 1 and 2 requires that Pa be a specific adhesion frequency, which can be calculated from the total adhesion frequency (Pt) after removing the nonspecific adhesion frequency (Pn) according to Equation 3 (21, 26).
FIGURE 3. Adhesion frequency versus contact duration binding curves for the locked open αL I domain on K562 cells interacting with mouse ICAM-1 on RBCs.
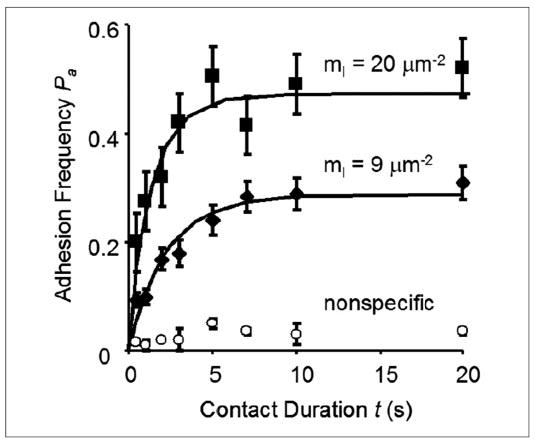
The three sets of adhesion frequency versus contact duration data (points), presented as the mean adhesion frequency ± S.E. of 5 pairs of cells with 100 contacts each, were obtained using two ICAM-1 densities, mr = 20 μm−2 (filled squares) and 9 μm−2 (filled diamonds) or not coated with ICAM-1 (open circles), but the same I domain density (mr = 7 μm−2). After removing the nonspecific adhesion, the Pa versus contact duration t data were fitted by Equation 1 (curves).
| (Eq. 3) |
For all integrin molecules tested, measurement of specific ICAM-1 binding affinity and kinetics requires that the I domain MIDAS be occupied by a divalent cation, as binding was reduced to the nonspecific level when measured in HBSS− with EDTA (Fig. 4A). Washing the cells first with HBSS− containing EDTA and then with HBSS− to remove EDTA and resuspending them in HBSS− for adhesion test also diminished binding to the nonspecific level (Fig. 4B). Thus, after stripping the metal ion off the I domain MIDAS with EDTA, no specific adhesion frequency above the noise level could be calculated from Equation 3, thereby preventing estimates of integrin-ICAM-1 binding affinity and kinetics from Equations 1 and 2. However, washing the cells previously exposed to divalent cations with and then performing micropipette assay in HBSS− without EDTA resulted in sufficiently high specific adhesion signals above noise from Equation 3. This indicates that without using EDTA, the metal ion pre-bound to the I domain MIDAS remained bound for hours in HBSS− to enable specific integrin-ICAM-1 binding.
FIGURE 4. Divalent cation requirement for specific binding.
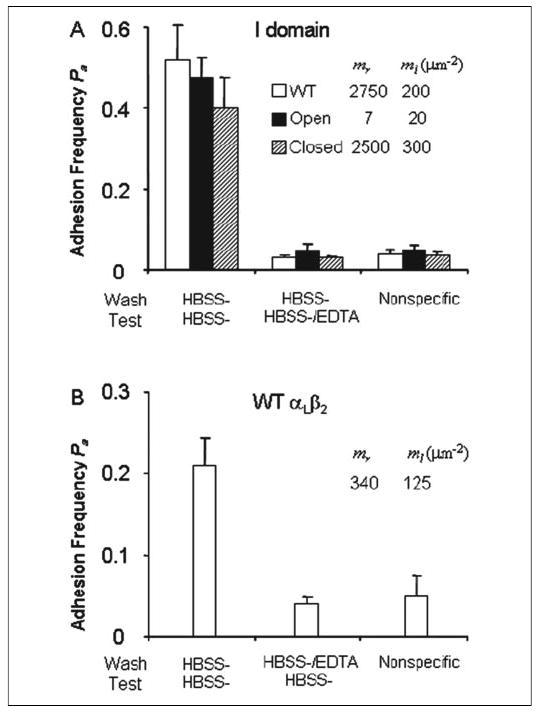
A, K562 cells expressing the indicated isolated WT and mutant I domains pre-bound with divalent cations were washed in HBSS− and assayed in HBSS− or HBSS−/EDTA by micropipette for adhesion to RBC reconstituted with GPI-ICAM-1. B, K562 cells expressing WT αLβ2 pre-bound with divalent cations were washed in HBSS− or HBSS−/EDTA and assayed in HBSS− by micropipette for adhesion to RBC reconstituted with GPI-ICAM-1. To bring the specific adhesion frequencies of different interactions to a comparable, midrange level, different site densities (indicated) of integrin (mr) and ICAM-1 (ml) were used to compensate their different affinities. The nonspecific adhesions were measured using RBC not reconstituted with ICAM-1 (ml = 0) to touch K562 cells expressing the same mr values of the indicated integrins treated and tested under identical conditions. Data are presented as the mean adhesion frequency ± S.E. of 5 pairs of cells, 100 contacts per cell pair, and 5 s per contact.
To study further the regulation of ICAM-1 binding affinities of the different I domains and whole αLβ2 by divalent cations, we chose the base-line experimental condition to be one in which K562 cells were first allowed to bind divalent cations, washed with HBSS−, and then assayed for ICAM-1 binding in HBSS−. Inclusion of 2 mm Mn2+ or 2 mm Mg2+ in the chamber solution where micropipette adhesion assay was performed was chosen to be the activating experimental condition. Note that in both the base-line and activating conditions, it was the specific adhesion mediated by binding of ICAM-1 to the I domain MIDAS pre-bound with a divalent cation that was measured. Specific ICAM-1 binding affinities and kinetics of WT and mutant αL I domain as well as WT and mutant whole αLβ2 in these two conditions were compared in the present study to elucidate their conformational regulation. The EDTA condition was not used because it did not allow specific ICAM-1 binding affinity and kinetics to be measured by our method.
The Locked Open, Intermediate, and Closed I Domains Bind ICAM-1 with High, Intermediate, and Low Affinities
Tested under the base-line condition, locking the I domain into high and intermediate conformations increased the binding affinities by ~8,000- and ~30-fold compared with the locked closed I domain, which was on the same order of magnitude as the affinity of the WT I domain (p > 0.06) (Fig. 5A and TABLE ONE). Therefore, the alternation of the C-terminal α7 helix position was sufficient to regulate the ligand binding affinity of the I domain when expressed on cell surface, in agreement with the 3D SPR measurement (8, 13) and consistent with the cell binding measurement (29). Most surprisingly, differences among the off-rates for the four isolated I domains were modest at best, with the locked open I domain having the smallest off-rate of 0.41 s−1 and the locked closed I domain having the largest off-rate of 0.71 s−1 (Fig. 5B and TABLE ONE), in sharp contract to the 3D SPR measurement (8, 13).
FIGURE 5. Binding parameters for isolated αL I domains.
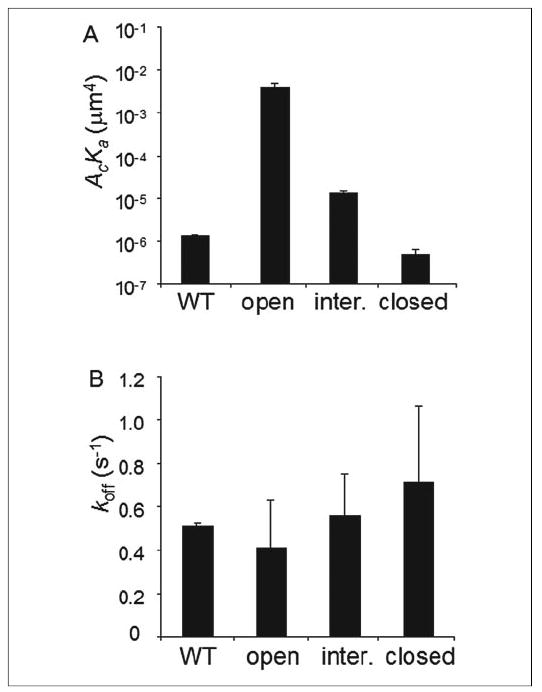
The effective binding affinities (A) and off-rates (B) of the WT, locked open, locked intermediate (inter.), and locked closed I domains for ICAM-1 are shown. Two or three specific binding curves were measured for each I domain species, and Equation 1 was fit to each curve to evaluate an effective binding affinity and an off-rate for that curve. Binding parameters estimated from different curves for the same species were averaged and calculated for standard deviation as presented in the figure. All differences in AcKa values of different I domains are statistically significant (p < 0.02, Student’s t test) except that between the WT and locked closed I domains (p > 0.06). None of the differences in koff values of different I domains are statistically significant (p > 0.16).
TABLE ONE. 2D and 3D binding affinities and off-rates of isolated αL I domain and αLβ2 integrin at different conformational states.
All 2D data are from this study, and the ligand was mouse GPI-ICAM-1. The two sets of 3D data for I domains interacting with human soluble ICAM-1 are from Refs. 12 (left column) and 8 (right column), respectively, and the 3D data for αLβ2 interacting with human soluble ICAM-1 are from Ref. 13. Data are presented as mean ± S.D. Inter. indicates intermediate.
| 2D | 3D | ||||||
|---|---|---|---|---|---|---|---|
| Receptor | AcKa | koff | Ka | koff | |||
| μm4 | s−1 | μm−1 | s−1 | ||||
| I domain | WT | 1.31 (±0.03) × 10−6 | 0.51 ± 0.01 | 5.32 (±0.71) × 10−4 | 6.74 (±0.54) × 10−4 | 5.55 ± 0.65 | 4.6 ± 0.36 |
| Open | 4.05 (±0.96) × 10−3 | 0.41 ± 0.22 | 5.58 ± 2.12 | 8.21 ± 4.27 | 0.0249 ± 0.0026 | 0.014 ± 0.001 | |
| Inter. | 1.32 (±0.18) × 10−5 | 0.56 ± 0.19 | 0.31 ± 0.06 | 0.43 ± 0.07 | |||
| Closed | 5.08 (±1.04) × 10−7 | 0.71 ± 0.25 | 7.43 (±0.11) × 10−4 | 6.39 (±0.75) × 10−4 | 2.84 ± 0.27 | 3.6 ± 0.34 | |
| αLβ2 | WT | 5.46 (±0.52) × 10−6 | 2.01 ± 0.65 | ||||
| WT (Mn2+) | 8.57 (±3.78) × 10−3 | 0.19 ± 0.08 | 3.68 ± 0.69 | 0.0459 (±0.086) | |||
| Open | 3.30 (±0.62) × 10−3 | 0.42 ± 0.19 | |||||
| Inter. | 2.68 (±0.45) × 10−5 | 1.01 ± 0.50 | |||||
| Closed | 9.85 (±1.27) × 10−7 | 2.51 ± 1.02 | |||||
αLβ2 Containing a WT or Locked I Domain Binds ICAM-1 with Affinities Comparable with the Corresponding Isolated I Domain
To compare the 2D binding characteristics of the I domains in isolation and in the whole integrin, the binding affinity and kinetics of αLβ2 containing a WT or locked I domain were measured by micropipette under the baseline condition. Similar to the isolated I domains, the 2D ICAM-1 binding affinity of αLβ2 containing locked open or locked intermediate I domain was ~3000- or ~30-fold higher than that of αLβ2 containing locked closed I domain (Fig. 6A and TABLE ONE). The mutant αLβ2 containing a locked closed I domain had a 2D affinity for ICAM-1 similar to that of the inactive WT αLβ2 (Fig. 6A and TABLE ONE), suggesting that the WT I domain, either in isolation or in the whole integrin, assumes a closed conformation in the absence of activating agents (Figs. 5 and 6 and TABLE ONE). Without activation, the 2D ICAM-1 binding affinities of the intact αLβ2 mutants containing the locked I domains were on the same orders of magnitude as those of the isolated I domains locked at the corresponding conformations, indicating that the I domain has nearly the full ligand binding capacity and confers nearly the same ligand binding affinities without other domains of the integrin (Figs. 5 and 6 and TABLE ONE). This is especially true for the locked open I domain, because expressing the open I domain in the whole αLβ2 did not further increase the binding affinity. The 2D off-rates of the four intact αLβ2 species (Fig. 6B) were more distinct from each other (up to 6-fold differences) than the isolated I domains (<2-fold), revealing modest but clearly observable influences of other domains of the αLβ2 integrin (TABLE ONE). Yet these 2D off-rates differed substantially from the 3D off-rate of ICAM-1 dissociating from activated αLβ2 (13).
FIGURE 6. Binding parameters for αLβ2 integrins.

The effective binding affinities (A) and off-rates (B) of the WT αLβ2 and αLβ2 mutants containing the locked open, locked intermediate (inter.), and locked closed I domains for ICAM-1 are shown. Two or three specific binding curves were measured for each αLβ2 species, and Equation 1 was fit to each curve to evaluate an effective binding affinity and an off-rate for that curve. Binding parameters estimated from different curves for the same species were averaged and calculated for standard deviation as presented in the figure. All differences in AcKa values of different I domains are statistically significant (p < 0.03, Student’s t test) except that between the WT αLβ2 and the αLβ2 mutant containing a locked closed I domain (p > 0.08). Statistically significant differences were found in koff values between the WT αLβ2 and the αLβ2 mutant containing a locked open I domain (p < 0.005), between the αLβ2 mutants containing a locked open and a locked intermediate I domain (p < 0.03), and between the αLβ2 mutants containing a locked open and a locked closed I domain (p < 0.007) but not between other pairs (p > 0.07).
Movements of the α7 Helix Regulate Most of the I Domain Binding Affinity
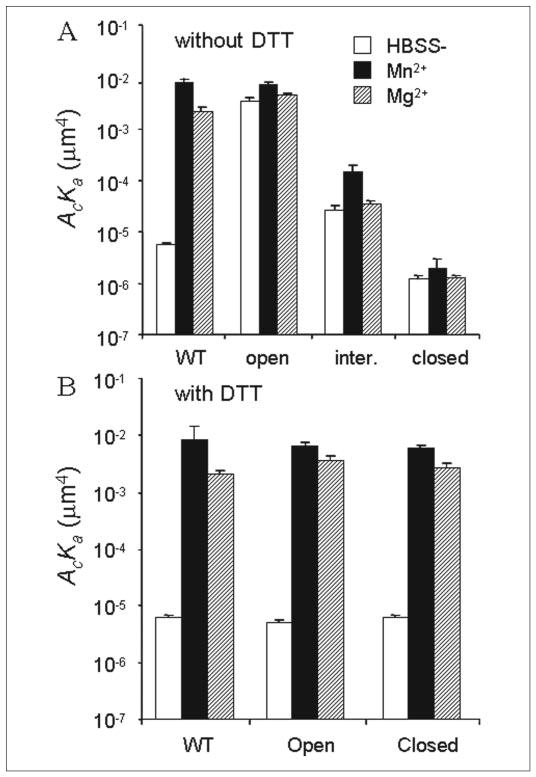
In the next set of experiments we examined the effects of divalent cations on ICAM-1 binding affinity of isolated I domains. Compared with HBSS− (base-line condition), 2 mm Mn2+ or Mg2+ (activating condition) increased the binding affinity of the isolated WT I domain for ICAM-1 by ~2-fold (Fig. 7A). The 2D ICAM-1 binding affinities of isolated I domains locked in closed, intermediate, and open conformations were identical in HBSS− and in 2 mm Mn2+ or Mg2+ (Fig. 7A). To identify the divalent cation pre-bound to the I domain MIDAS, cells were washed with HBSS−/EDTA to strip off any divalent cations pre-bound to the I domain during cell culture, washed with HBSS− to remove EDTA, incubated with Mn2+, Mg2+, or Ca2+ to allow the I domain to bind known metal ion, washed with HBSS− to remove unbound divalent cations in solution, and assayed in HBSS− for adhesion with ICAM-1-coated RBCs. Results from this experiment (Fig. 7B) are nearly identical to those in Fig. 7A. These data suggest that locking the α7 helix in a fixed position by a disulfide bond completely abolished the ability of divalent cations to regulate the I domain binding affinity for ICAM-1, as long as the I domain MIDAS was pre-occupied by a divalent cation regardless of whether it is Ca2+, Mn2+, or Mg2+. To rule out the possibility that the inability of divalent cations to regulate the ICAM-1 binding affinities of the I domain mutants might be caused by other effects of the amino acid substitutions, we used DTT to unlock the disulfide bonds and measured the ability of Mn2+ and Mg2+ to regulate 2D ICAM-1 binding affinity of the isolated I domains. The corresponding ICAM-1 binding affinities of the isolated WT I domain in the base-line and activating conditions were identical with and without DTT treatment (Fig. 7), indicating that DTT had no adverse effects on the I domain-ICAM-1 interaction. In the base-line condition, DTT treatment reduced the ICAM-1 binding affinity of the open I domain 3–4 orders of magnitude to the level of that of the WT I domain but had little effect on the affinity of the closed I domain, which was already similar to that of the WT I domain (Fig. 7), indicating that these I domains returned to (or remained at) the inactive conformation after unlocking the disulfide bonds. In addition, unlocking the disulfide bonds with DTT treatment resumed the ability of Mn2+ and Mg2+ to up-regulate 2D ICAM-1 binding affinity of the I domain mutants to levels comparable with those of the WT I domain (Fig. 7C). Thus, the effects on I domain-ICAM-1 binding affinity of replacing the residues in the α7 helix and β;1-strand by a pair of cysteines are due solely to the fixation of the α7 helix position by a disulfide bond. Taken together, our data indicate that a 3–4-order of magnitude of changes in the ICAM-1 binding affinity of the I domain can be regulated solely by the movement of its α7 helix.
FIGURE 7. Divalent cation regulation of I domain affinity.

Effective binding affinities for ICAM-1 of the WT, locked open, locked intermediate (inter.), and locked closed I domains with or without 2 mm of Mn2+ or Mg2+ in the absence (A) or presence (C) of 10 mm DTT are compared with those (B) measured in HBSS− after the cells were washed in HBSS−/EDTA to strip off any divalent cations pre-bound to the I domain during cell culture, washed with HBSS− to remove EDTA, incubated with 2 mm Mn2+, Mg2+, or Ca2+ to allow divalent cation of known identity to bind the I domain MIDAS, and washed with HBSS− to remove the solution divalent cations. The adhesion frequencies of 5 pairs of cells were measured for a 10-s contact duration, and the effective binding affinities were calculated from Equation 2. Data are presented as mean ± S.E. A, the differences between WT AcKa values measured in HBSS− and in Mn2+ or Mg2+ are statistically significant (p < 0.0006, Student’s t test), but the differences between the mutant AcKa values measured in the absence and presence of Mn2+ or Mg2+ are not statistically significant (p > 0.1) for any of the three locked mutant I domains. B, none of the differences in the mutant AcKa values between different metal ion treatments are statistically significant (p > 0.58, Student’s t test) for any of the three locked I domains. The differences in WT AcKa values between the Mn2+ and Ca2+ and Ca2+ treatments and between the Mg2+ treatments are statistically significant (p < 0.003, analysis of variance) but that between the Mn2+ and Mg2 treatments are not (p = 0.86). C, the differences between AcKa values measured in HBSS− and in Mn2+ or Mg2+ are statistically significant (p < 0.005) for any of the three I domains.
Movements of the I Domain α7 Helix Regulate Most of the αLβ2 Binding Affinity
We then turned to the affinity regulation of the whole αLβ2 integrin. The continuous presence of Mn2+ or Mg2+ in the test chamber increased the 2D binding affinities for ICAM-1 of the αLβ2 mutants containing locked I domains by severalfold from values measured in the base-line condition (Fig. 8A). Thus, when the I domain pre-bound with a divalent cation was locked at the closed, intermediate, or open position, the 2D binding affinities for ICAM-1 were clamped at low, intermediate, or high levels with no range (for isolated I domains; Fig. 7A) or a narrow range (for I domains contained in the whole αLβ2; Fig. 8A) of regulation by Mn2+ or Mg2+. These data are consistent with the cell binding measurement (29). The 2–5-fold of affinity up-regulation by Mn2+ and Mg2+ likely resulted from conformational changes of other integrin domains. Mn2+ and Mg2+ have been shown to induce the switchblade-like conformational change of the whole integrin and stabilize the integrin in an extended conformation, which moves the I domain ~10 nm upward further above the cell membrane (30). Lengthening cell surface receptors has been shown to increase 2D binding affinity by enhancing its accessibility to ligands on the apposing cell surface (31). In sharp contrast to the isolated WT I domain and to the mutant αLβ2 containing locked I domains, the 2D binding affinities of WTαLβ2 for ICAM-1 measured in Mn2+ or Mg2+ were increased ~1500- and ~380-fold, respectively, compared with the value measured in HBSS− (Fig. 8A).
FIGURE 8. Divalent cation regulation of αLβ2 affinity.
Effective binding affinities for ICAM-1 of the WT αLβ2 and αLβ2 containing the locked open, locked intermediate (inter.), or locked closed I domain with or without 2 mm of Mn2+ or Mg2+ in the absence (A) or presence (B) of 10 mm DTT are shown. The adhesion frequencies of 5 pairs of cells were measured for a 10-s contact duration, and the effective binding affinities were calculated from Equation 2. Data are presented as mean ± S.E. Without DTT treatment, the differences between WT AcKa values measured in HBSS− and in Mn2+ or Mg2+ are statistically significant (p < 0.0008, Student’s t test), but the differences between the mutant AcKa values measured in the absence and presence of Mg2+ are not statistically significant (p > 0.25) for any of the three αLβ2 integrins containing locked mutant I domains. Statistically significant differences were found between the AcKa values measured in the absence and presence of Mn2+ for mutant αLβ2 containing a locked intermediate (p < 0.0008) or locked closed (p = 0.05) I domain but not for mutant αLβ2 containing a locked open I domain (p > 0.4). With DTT treatment, the differences between AcKa values measured in HBSS− and in Mn2+ or Mg2+ are statistically significant (p < 0.01) for any of the three αLβ2 integrins.
To exclude the possibility that the mutations in the I domain might have effects on αLβ2-ICAM-1 binding affinity other than preventing the I domain α7 helix movement, we again used DTT to unlock the disulfide bonds. In the base-line condition, DTT treatment again reduced the 2D ICAM-1 binding affinity of the mutant αLβ2 containing an open I domain 3–4 orders of magnitude to the level of that of the WT αLβ2 but had little effect on the affinity of the mutant αLβ2 containing a closed I domain, which was already similar to that of the WT αLβ2 (Fig. 8), indicating that these I domains returned to (or remained at) the inactive conformation after unlocking the disulfide bonds. In addition, DTT again resumed the full 3–4 log range of affinity regulation of the mutant αLβ2 by Mn2+ and Mg2+, yet it had no adverse effects on the binding affinities (and their divalent cation regulation) on the WT αLβ2 (Fig. 8B). Because WT and mutant αLβ2 with and without DTT treatment were able to bind ICAM-1 specifically in HBSS− but not in EDTA, the MIDAS of the I domain in the context of the whole integrin must be occupied by a divalent cation in HBSS−, just as it is in isolation. Affinity up-regulation by several orders of magnitude requires the downward movements of the I domain α7 helix, because the isolated WT I domain and isolated mutant I domains unlocked with DTT were unable to be up-regulated by Mn2+ or Mg2+ to a high affinity state (see above). Thus, our data suggest a coupling between the I domain conformation and the global conformation of the whole integrin, such that changes in the latter results in changes in the former, leading to changes in the α7 helix position. In addition, to induce the global conformational changes, Mn2+ or Mg2+ must bind to metal ion-binding sites on αLβ2 other than the I domain MIDAS under the activating condition, because the I domain MIDAS had already been occupied by a divalent cation. Unlike the I domain MIDAS, these other metal ion-binding sites could not hold on to the divalent cations bound to them when the cells were washed in HBSS−. In other words, divalent cations must dissociate from the metal-binding sites on the whole integrin responsible for inducing the switchblade-like conformational change much more rapidly than from the I domain MIDAS.
The Micropipette Assay Is Capable of Measuring Slow Off-rate
The 2D off-rates of the various αLβ2 integrin constructs dissociating from ICAM-1 observed in this study fell in a narrow range from 0.2 to 2.5 s−1. By comparison, the 3D off-rates of the corresponding I domain species measured by SPR spanned a much wider range, extending the high end by severalfold and the low end by an order of magnitude (TABLE ONE). To demonstrate the ability of the micropipette adhesion frequency assay to analyze kinetic processes of slow off-rates, we measured the 2D binding kinetics between αLβ2 containing the locked open I domain and an anti-αLβ2 adhesion-blocking mAb (clone 38), because antibodies in general dissociate very slowly from their antigens. It is evident from Fig. 9 that the antibody-antigen binding curve represents a kinetic process much slower than that represented by the αLβ2-ICAM-1 binding curve. The adhesion frequency of the αLβ2-ICAM-1 interaction reached a steady state in 5 s, whereas that of the αLβ2-mAb 38 interaction remained in the transient phase even when the contact duration was as long as 60 s. Lengthening the contact duration further is possible but technically challenging because it would drastically prolong the experiment, as the contact cycle with long duration is to be repeated 100 times using the same pair of cells. Because only transient data before reaching steady state were analyzed, the 0.03 s−1 koff value obtained from fitting the incomplete binding curve likely overestimated the true off-rate (TABLE TWO). The ability to measure slow off-rates of the same order of magnitude was also demonstrated in the micropipette experiment by using activating mAbs to activate αLβ2 containing a locked open I domain.6 Thus, the adhesion frequency assay is capable of measuring 2D off-rate on the order of 0.01 s−1, which is as slow as the slowest 3D off-rate (that of the locked open I domain dissociating from ICAM-1) measured in the previous SPR studies (13). Therefore, the fast 2D off-rates of the locked open I domain and αLβ2 containing the locked open I domain (of the order of 0.1 s−1) was not because of the inability of the experimental method to measure them.
FIGURE 9. Slow and fast binding curves.
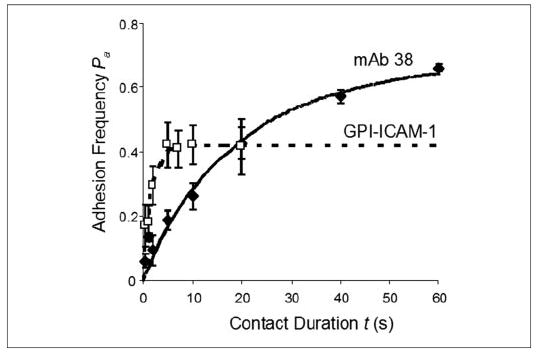
Binding curves of αLβ2 containing the locked open I domain for mAb 38 (♦, solid curve) and for mouse GPI-ICAM-1 (□, dashed curve) are compared. The adhesion frequency of the αLβ2-mAb 38 interaction did not reach equilibrium even at 60 s, which was the longest contact duration for that experiment. By comparison, the adhesion frequency of the αLβ2-ICAM-1 interaction reached equilibrium at 5 s.
TABLE TWO. 2D binding affinities and off-rates of locked open αL I domain and αLβ2 containing a locked open I domain for different ligands.
| Receptor | Ligand | AcKa | koff |
|---|---|---|---|
| μm4 | s−1 | ||
| Open I domain | Reconstituted mouse GPI-ICAM-1 | 4.05 (±0.96) × 10−3 | 0.41 ± 0.22 |
| Open I domain | CA7 captured human GPI-ICAM-1 | 9.94 (±0.19) × 10−4 | 0.37 ± 0.21 |
| Open αLβ2 | Reconstituted mouse GPI-ICAM-1 | 3.30 (±0.62) × 10−3 | 0.42 ± 0.19 |
| Open αLβ2 | Reconstituted human GPI-ICAM-1 | 2.25 (±0.31) × 10−3 | 0.24 ± 0.09 |
| Open αLβ2 | mAb 38 | 1.32 (±0.56) × 10−1 | 0.03 ± 0.02 |
Mouse ICAM-1 and Human ICAM-1 Bind to Human I Domain and αLβ2 with Similar Binding Affinities and Kinetics
Although there are sequence differences between mouse and human ICAM-1, mouse ICAM-1 also binds specifically to human αLβ2 (32). The kinetic parameters shown in Figs. 5 and 6 (summarized in TABLE ONE) were measured using mouse ICAM-1 because of its much higher availability. By comparison, the previous SPR studies used human ICAM-1 (8, 13, 14). We therefore tested whether ICAM-1 from different species dissociated at much different off-rates by measuring the 2D kinetics of human αLβ2 containing the locked open I domain interacting with human ICAM-1. The binding parameters of αLβ2 for mouse and human ICAM-1 were very similar, especially the 2D AcKa (Fig. 10). Although the 2D off-rates differed slightly (<2-fold), they were of the same order of 0.1 s−1 (TABLE TWO), which is still an order of magnitude faster than the 3D off-rate measured in the previous SPR study (8, 13, 14). Thus, the differences in the 2D and 3D off-rates were not caused by the different ICAM-1 species used.
FIGURE 10. Binding curves for mouse and human ICAM-1.

Binding curves of αLβ2 containing the locked open I domain for human GPI-ICAM-1 (♦, solid curve) and mouse GPI-ICAM-1 (□, dashed curve) are compared. The site density of αLβ2 was 8 μm−2 for both curves. Human and mouse ICAM-1 had comparable site densities of 20 and 14 μm−2, respectively. The two curves had similar equilibrium adhesion frequencies and reached equilibrium level at nearly the same contact durations.
ICAM-1 Coupled to RBC via GPI Anchor and via a Capture mAb Have Similar Off-rates
Both the mouse and human ICAM-1 used to measure the kinetic rates shown in Figs. 4–10 were fusion proteins whose transmembrane and cytoplasmic domains were replaced by a GPI anchor for its easy reconstitution into the RBC membrane. To assess the effects of ICAM-1 presentation on the 2D off-rate, we performed kinetic measurement of isolated locked open I domain for ICAM-1 captured by a nonblocking anti-ICAM-1 mAb pre-coated on the RBC surface by using chromium chloride coupling (22). GPI-anchored human ICAM-1 was captured using mAb CA7, which binds to the D5 domain of human ICAM-1. Because of the high affinity of antibody-antigen interaction, only submicrogram/ml concentration was required to capture enough ICAM-1 on the RBC surface. By comparison, submilligram/ml concentration was required for a sufficient number of ICAM-1 to insert their GPI anchors into the RBC membrane. This 1000-fold difference in the required concentrations ensured that pre-coating CA7 was required for RBC to acquire from low concentration incubation a high enough ICAM-1 site density for specific αLβ2 adhesion. Indeed, a control experiment using RBC not pre-coated with CA7 and incubated with submicrogram/ml concentration of ICAM-1 resulted in no more than a background level of adhesion (data not shown). By comparison, incubating RBC pre-coated with CA7 with the same concentration of GPI-ICAM-1 enabled the measurement of a binding curve shown in Fig. 11, which is comparable with that obtained using RBC without CA7 pre-coating but incubated with submilligram/ml concentration of GPI-ICAM-1. Thus, K562 αLβ2 had similar 2D affinities and off-rates for ICAM-1 regardless of the method by which it was coated on RBC (Fig. 11 and TABLE TWO), which is consistent with the knowledge that the binding site for αLβ2 resides on the D1 domain of ICAM-1, which is >20 nm distal to the membrane anchor (33), and that the first two Ig domains (D1-D2) of ICAM-1 are sufficient for I domain binding (8).
FIGURE 11. Binding curves for reconstituted and captured ICAM-1.
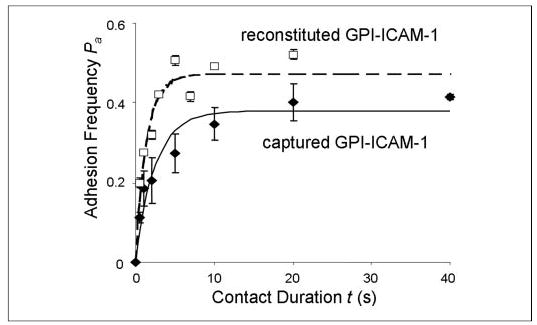
Binding curves of the isolated locked open I domain for human GPI-ICAM-1 captured by CA7 precoated on RBC (♦, solid curve) and for mouse ICAM-1 reconstituted on RBC via GPI anchor (□, dashed curve) are compared. The respective site densities of open I domain and captured GPI-ICAM-1 were 40 and 12 μm−2. The respective site densities of open I domain and reconstituted GPI-ICAM-1 were 8 and 20 μm−2. The difference in the steady-state adhesion frequencies can be accounted for by the different mr × ml products in the two cases, but both curves achieved steady-state at a similar time, indicating similar off-rates for the two interactions.
DISCUSSION
By using the micropipette adhesion frequency assay, we have obtained additional evidence for the model for affinity regulation by conformational changes in integrins (20). Our data confirmed that an isolated αL I domain is capable of supporting ICAM-1 binding with the affinity and kinetics regulated by the position of the C-terminal α7 helix. When expressed on the cell surface without other domains of αLβ2, the isolated WT I domain has a 2D ICAM-1 binding affinity similar to that of the locked closed I domain, suggesting that the closed conformation is the default conformation of the I domain. The 2D binding affinity of the I domain for ICAM-1 was increased by ~8,000- and ~30-fold by locking the α7 helix into the respective open and intermediate conformations. Unlocking the α7 helix position with DTT treatment returned the 2D ICAM-1 binding affinity of the I domain mutant, regardless of into which conformation it is locked, to the level of the WT I domain. In addition, with the I domain MIDAS pre-occupied by a divalent cation, changing the Mn2+ and Mg2+ concentrations in the chamber solution could not regulate the force-free 2D affinities of the I domain mutant, regardless of into which conformation it is locked, and could only regulate the ICAM-1 binding affinities of the WT or unlocked mutant I domains within a narrow range (<2-fold). Thus, the downward movement of the α7 helix is necessary and sufficient for regulating the ligand binding affinity of the I domain, provided that the I domain MIDAS is bound with a divalent cation.
The binding affinities and kinetics of whole αLβ2 integrins containing locked I domains were measured for the first time in this study, although these mutants were studied previously for their ability to mediate cell adhesion (12). The mutant αLβ2 containing a locked I domain, regardless of into which conformation it was locked, had the same orders of magnitude of binding affinity and off-rate as the corresponding values of the isolated I domain, indicating that the I domain has nearly the same ligand binding capacity as the intact αLβ2 heterodimer. When measured in the base-line condition, the WT αLβ2 bound ICAM-1 with a low affinity comparable with the αLβ2 mutant containing a locked closed I domain, similar to WT I domain in isolation. This suggests that, just as WT I domain in isolation, the low affinity conformation is the default conformation for the inactive WT αLβ2. Mn2+ and Mg2+ were able to increase the 2D ICAM-1 binding affinity of WT αLβ2 to a level comparable with that of the mutant αLβ2 containing a locked open I domain. The ability of Mn2+ and Mg2+ to substantially up-regulate the ICAM-1 binding affinity of αLβ2 from the base-line condition was diminished when the position of the I domain α7 helix was locked, regardless of into which position it was locked. In the base-line condition, unlocking the α7 helix position by DTT returned the ICAM-1 binding affinities of the αLβ2 mutants to the level of inactive WT αLβ2. In addition, DTT treatment resumed the full range of affinity regulation of these locked αLβ2 heterodimers by Mn2+ and Mg2+. Therefore, just as in isolation, the position of the α7 helix regulates most of the ligand binding affinity when the I domain is in the context of the whole αLβ2 heterodimer. Unlike in isolation, the presence of the whole αLβ2 context enables the position of the I domain α7 helix to be regulated, provided that it is not locked in fixed conformations. The conformations of other αLβ2 domains have only limited capacities to regulate the ligand binding affinity and kinetics once the I domain is locked, most likely through regulating the distance of the I domain ligand-binding site above the cell membrane. In other words, the regulation of ligand binding affinity and kinetics by other domains of WT αLβ2 is achieved mostly through their effects on the I domain. More specifically, the conformational changes in other domains have to propagate through the α7 helix (most likely resulting in an applied force that pulls the α7 helix downward) in order to regulate ligand binding affinity and kinetics. Mn2+ and Mg2+ must regulate the I domain conformation indirectly through the conformational changes in other domains of αLβ2 rather than directly binding to the I domain MIDAS. Actually, the I domain MIDAS held on to a divalent cation pre-bound to it for hours even in HBSS−. Thus, Mn2+ and Mg2+ must dissociate rapidly from the metal ion-binding sites responsible for inducing conformational changes in other domains. Only if these sites allow rapid binding and dissociating of Mn2+ and Mg2+ would the WT αLβ2 and the unlocked αLβ2 mutants assume the low affinity conformation in the base-line condition and be up-regulated to the high affinity conformation in the activating condition.
Few 2D affinity and on-rate for integrin-ligand interactions have been published previously. Because cell adhesion is governed by these 2D binding parameters rather than the 3D parameters, the measurements reported here contribute to fulfilling the unmet need. The measured 2D binding affinity and kinetic rate constants also provide an opportunity to compare these values with their 3D counterparts measured by SPR for the same molecular interactions (13). Although the different units prevent direct comparison of the absolute values of 2D and 3D binding affinities, we can examine their correlation, or the lack thereof. It is evident from Fig. 12A that positive correlation exists between values measured in the two different dimensions. The fold increase in relative affinity from the locked closed to the locked open I domain measured by our 2D micropipette method (~8,000) agrees well with the previous 3D results obtained using SPR techniques (~10,000). However, the affinities of the locked intermediate I domain relative to those of the locked closed and locked open I domains differ by an order of magnitude; the 2D values are increased ~25-fold from closed to intermediate and increased ~300-fold from intermediate to open, whereas the corresponding 3D values are increased ~500- and ~25-fold.
FIGURE 12. Correlation between 2D and 3D binding parameters.
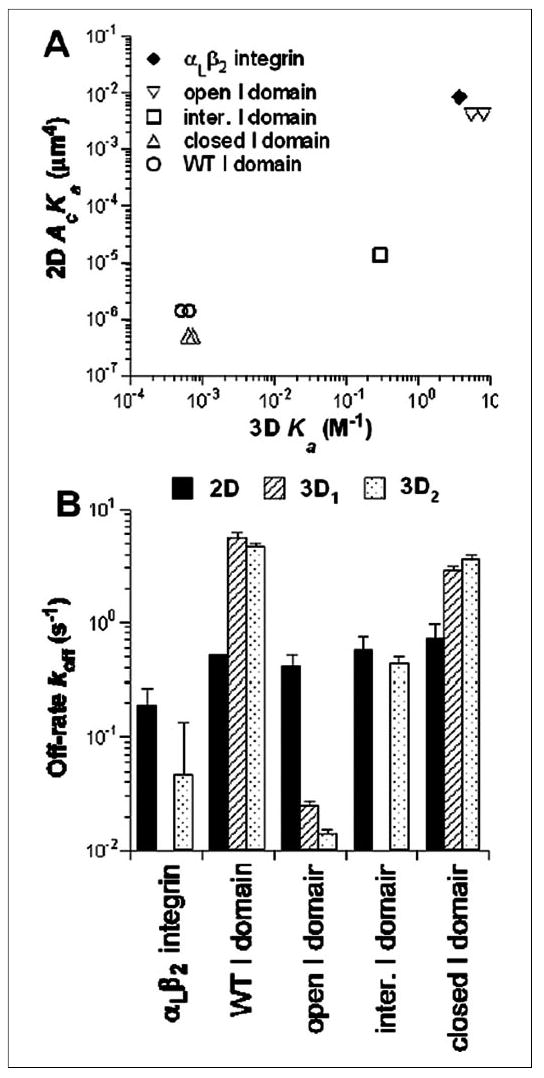
A, 2D effective binding affinities for the indicated K562 integrin constructs for mouse GPI-ICAM-1 measured in this work are plotted against the 3D binding affinities of the same but purified integrin constructs for human soluble ICAM-1 measured in three previous studies (cf. TABLE ONE) (8, 13, 14). B, 2D and 3D off-rates of the same interactions as in A are shown as mean ± S.D. The 3D data for WTαLβ2 in Mn2+ are from Ref. 14. The 3D1 data for the locked open and closed I domains are from Ref. 8. The 3D2 data for the three locked I domains are from Ref. 13. Note that certain bars are missing because data for these conditions are not available. inter., intermediate.
Although the 2D and 3D off-rates agree well in one case (locked intermediate I domain), significant discrepancies between the micropipette and SPR measurements are seen in all other cases (Fig. 12B). Both cases exist for 2D koff ≫ 3D koff (locked open I domain and αLβ2 integrin) and 2D koff ≪ 3D koff (WT and locked closed I domain). It appears that the hundreds of fold of 3D off-rate differences among the different molecular species are greatly compressed into a much narrower 10-fold range of 2D off-rate differences (TABLE ONE). This results in a significant expansion of 2D on-rate differences among the different I domain conformers into a much broader range than that of 3D on-rate differences among the same set of I domain conformers, as the range of affinity differences are similar in 2D and 3D.
It has been well known that removal of divalent cations prevents or rapidly detaches integrin-mediated cell adhesion (34). It has also been observed that isolated WT I domain expressing K562 cells roll on ICAM-1 under flow, but locking the I domain into the open high affinity state results in firm adhesion to ICAM-1 (29). Cell detachment results from diminishing integrin-ligand bonds, which are caused by decreases in affinity, which can be due to either a decrease in on-rate, an increase in off-rate, or a combination thereof. Similarly, stable, continuous rolling requires the balance of bond formation and dissociation to maintain the same number of bonds. Either an increase in on-rate or a decrease in off-rate could result in more bond formation than dissociation, thereby reducing the rolling velocity and transiting rolling to firm adhesion. Our data reveal that it is the tremendous regulation range of the 2D on-rate rather than the small regulation region of the 2D off-rate of the αLβ2-ICAM-1 interaction that underlies the above regulation of adhesion functions.
The discrepancies between the 2D and 3D off-rates are surprising because it has been proposed that the discrepant conversions between the 2D affinity and 3D affinity were because of on-rates, which have different units in 2D (per unit surface density per unit time) and 3D (per unit volumetric concentration per unit time) (21, 26, 31). By comparison, off-rates were believed to have the same values regardless of whether they were measured in 2D or 3D because they have the same unit (per unit time) in either case (25, 31, 35–38). In the present study, however, the off-rates are found drastically different in 2D and 3D, yet the fold increases in binding affinity from the locked closed I domain to the locked open I domain are similar in 2D and 3D.
To examine the possible sources for the discrepancies between the 2D and 3D off-rates, several experiments were performed to rule out potential contributing mechanisms. The ability of the adhesion frequency assay to measure off-rate accurately has been questioned because all published 2D off-rates measured by this method fall in a narrow range (orders between 0.1 and 1 s−1) despite the fact that these off-rates govern dissociation of very different interactions (22, 26–28, 31, 38–41). Micropipette adhesion frequency assay was performed to measure the slow kinetics of an αLβ2 mutant interacting with a blocking antibody (Fig. 9) and of WT αLβ2 interacting with ICAM-1 in the presence of activating mAbs.6 The results confirmed that the micropipette assay is capable of measuring 2D off-rates as slow as the 3D off-rates measured by SPR.
The adhesion frequency assay measures the likelihood of adhesion. For the assay to work well, the cell surface densities of the receptors and ligands have to be adjusted so that the repeated adhesion tests result in a mid-range of probabilities (~0.2–0.8). This limits the dynamic range of the assay as follows: for a 0.2–0.8 probability the range can be spanned by only an ~10-fold difference in affinities between two interactions with the same site densities. To measure the 3–4 orders of magnitude of differences in the ICAM-1 binding affinities of the open and closed αL I domains, K562 cells were sorted to obtain high expression of locked closed I domain (~2000 μm−2) and low expression of locked open I domain (~10 μm−2). Any errors in the site density determination would propagate as errors in the affinity estimates; however, the off-rate estimates should not be affected.
Another potential problem may be transport limitations, which can cause problems in SPR measurements (42). High affinity and fast on-rate interactions may deplete free receptors and ligands before transport brings in a replacement, thereby lowering their local densities. The dissociated receptors/ligands may also rebind upon dissociation, thereby prolonging the apparent lifetime (reciprocal off-rate). However, the former effect would have only impacted the on-rate. The latter effect would have underestimated the off-rate of the locked open I domain, thereby overestimating the “true” differences in the off-rates between the locked-open and locked-closed conformers.
The use of ICAM-1 from different species might be another potential cause for the discrepancies. However, direct comparison between mouse and human ICAM-1 in a back-to-back experiment showed that human αL I domain and αLβ2 bind to ICAM-1 from the two species not only with the same specificity and the same divalent cation dependence but also with very similar binding affinity and kinetics (TABLE TWO). Therefore, the use of mouse ICAM-1 did not cause the observed discrepancies between the 2D and 3D off-rates. Mouse ICAM-1 is a reasonable ligand for characterizing human αLβ2 binding and its regulation by conformational change.
It has been shown that ligand binding kinetics of GPI-anchored receptor could be different from its transmembrane anchor counterpart (39). ICAM-1 is known to exist as a dimer or multimer on the cell surface (43, 44). However, the GPI-ICAM-1 used in the present study likely expresses as a monomer on the cell surface (43). Jun et al. (45) demonstrated that a single ICAM-1 monomer contains a complete binding site for αLβ2. Therefore, the GPI-anchored ICAM-1 is able to bind αLβ2 with full competency. The monomeric nature of the present 2D GPI-ICAM-1 binding should not cause off-rate discrepancies, as the 3D interactions between the purified molecules in the previous SPR studies were also monomeric. It is also possible that GPI-anchored ICAM-1 could be extracted from the RBC membrane, thereby reducing the number of ICAM-1 molecules in the contact area available for αLβ2 binding. But this would have only impacted on-rates but would not have influenced the 2D off-rates (22, 26, 31, 39). In addition, the GPI-anchor receptor may display a different lateral mobility on the cell membrane, which could affect its ligand binding kinetics. To assess this potential effect, we tested whether the GPI anchor of ICAM-1 had affected the binding parameters. We coupled ICAM-1 to RBCs by using a capturing mAb CA7. The binding between capture antibody and ICAM-1 is likely strong and long lasting; therefore, the ml will not decrease in this case. Micropipette measurements using GPI-anchored or antibody-captured ICAM-1 resulted in comparable binding affinities and off-rates, indicating that the use of GPI-ICAM-1 did not affect the binding parameters (TABLE TWO).
The present results are also comparable with recently published 2D off-rates of β2 integrin dissociating from ICAM-1 (41, 46, 47). Lomakina and Waugh (41) reported a 0.7 s−1 2D off-rate of neutrophil integrin interacting with ICAM-1 in the presence of Mg2+ by using the micropipette adhesion frequency assay, which is comparable with our values but different from the 3D values. By using a flow chamber, Vitte et al. (46) measured bond lifetimes of Jurkat cell integrins interacting with ICAM-1 in the absence and presence of Mg2+ or Mn2+. The dissociation curves exhibited at least two phases and hence cannot be interpreted using first-order kinetics. Nevertheless, the apparent off-rates (0.30–0.44 s−1) of the initial phase (0–2 s) are comparable with our 2D values but not to the 3D values (TABLE ONE) (8, 12, 13). Most interestingly, the apparent off-rates (0.032–0.094 s−1) of the later phase (2–10 s), which involves bond strengthening, are comparable with the 3D off-rates of the locked open I domain and of the Mn2+-up-regulated WT αLβ2 dissociating from ICAM-1. Apparent off-rates of the initial (and later) phase exhibited <4-fold (and <10-fold) of divalent cation regulation, which is consistent with our results but not with the 3D results. By using atomic force microscopy, Zhang et al. (47) measured rupture forces over a range of loading rates, which were analyzed by the dynamic force spectroscopy method to estimate 2D off-rates based on the Bell equation that assumes off-rate to increase exponentially with force. The zero-force extrapolations of 2D off-rates of 0.17 and 4 s−1 for high and low affinity αLβ2 estimated from the low loading rates (20–10,000 pN/s) data are consistent with our values but are faster than the 3D off-rates of the high affinity I domain and activated αLβ2. Corresponding values estimated from the high loading rates (10,000–50,000 pN/s) data are even faster (40 and 57 s−1). Taken together, the differing 2D off-rates from their 3D counterparts are unlikely experimental artifacts as the 2D data were determined using three independent techniques by three different laboratories.
Discrepancies between 3D and 2D off-rate have been reported for other molecular systems as well. The off-rates of platelet glycoprotein Ibαdissociating from the von Willebrand factor A1 domain were 0.0038 s−1 measured in 3D by radioimmunoassay (48) but were 3.21 s−1 and 5.66 s−1 measured in 2D by two independent flow chamber experiments (49, 50). Merkel et al. (51) determined 2D off-rates of biotin/(strept)avidin interactions by a biomembrane force probe. The ~1-min 2D zero-force mean lifetime (= 1/koff) is orders of magnitude shorter than the 3D value of 35 h (52). Ludwig and Evans (53) estimated a 2D apparent force-free mean lifetime of 30 s for extracting single diC14 lipids from the surface of a lipid:cholesterol vesicle, which is 50-fold shorter than the 3D counterpart estimated from solution measurement (54).
There are many differences between the 2D and 3D measurements, which could affect estimation of the kinetic parameters. Evans (55) suggested that molecular attractions exterior to a binding site could significantly prolong association in solution yet escape detection in force probe tests because the peripheral interaction might be overwhelmed by small forces (e.g. <1 pN). Likewise, application of force could eliminate pathways available to spontaneous dissociation, which would yield a slower apparent off-rate. It was therefore concluded that there should be no reason to expect the apparent lifetime derived from extrapolation of rupture kinetics to zero force to match the lifetime measured for dissociation in solution (55). In addition, unlike 3D experiments, where the receptors and ligands approach each other and separate by free diffusion, in the micropipette measurement, the molecules are brought together and apart by the movement of the cell membranes. Cell membranes, especially the flexible RBC membrane, undulate under thermal excitations throughout the experiment. The standard deviation of RBC membrane fluctuation is of the order of tens of nanometers,7 which may exert a small force on the molecular bond, especially when there is only one bond linking RBC to the K562 cell, which is likely the case. Membrane undulations could also influence 2D binding in other ways, e.g. making the contact time discontinuous. Anchoring the molecule to the cell membrane places restriction not only on translational but also on rotational diffusion of the molecule, which may also impact 2D binding. Whether, and if so how, these mechanisms contribute to the discrepancies between the 2D and 3D off-rates observed in this work is not known at this point. However, our data prompt renewed interest in theoretical modeling and experiment investigation of the influences of these factors on the 2D binding parameters.
Acknowledgments
We thank Michael Dustin for helpful discussion.
Footnotes
This work was supported in part by National Institutes of Health Grants AI44902 and AI38282 (to C. Z.), AI049400 (to P. S.), and CA31798 (to T. A. S.).
The abbreviations used are: ICAM-1, intercellular adhesion molecule-1; 2D, two-dimensional; 3D, three-dimensional; DTT, dithiothreitol; FITC, fluorescein isothiocyanate; GPI, glycosylphosphatidylinositol; HBSS−, Hanks’ balanced salt solution without calcium and without magnesium; I domain, inserted domain; MIDAS, metal ion-dependent adhesion site; MESF, molecules of equivalent soluble fluorophore; mAb, monoclonal antibody; RBC, red blood cells; SPR, surface plasmon resonance; WT, wild-type.
Strictly speaking, 3D binding requires both binding partners in the fluid phase. However, binding in SPR experiments, like binding of soluble ligands to cell surface receptors, is quite similar to and has the same binding affinity and on-rate units as the true 3D binding.
P. Selvaraj, unpublished data.
F. Zhang, P. Selvaraj, T. Springer, and C. Zhu, unpublished data.
J. Wu, Y. Fang, and C. Zhu, unpublished data.
References
- 1.Springer TA. Cell. 1994;76:301–314. doi: 10.1016/0092-8674(94)90337-9. [DOI] [PubMed] [Google Scholar]
- 2.Grakoui A, Bromley SK, Sumen C, Davis MM, Shaw AS, Allen PM, Dustin ML. Science. 1999;285:221–227. doi: 10.1126/science.285.5425.221. [DOI] [PubMed] [Google Scholar]
- 3.Shimaoka M, Takagi J, Springer TA. Annu Rev Biophys Biomol Struct. 2002;31:485–516. doi: 10.1146/annurev.biophys.31.101101.140922. [DOI] [PubMed] [Google Scholar]
- 4.Xiong JP, Stehle T, Diefenbach B, Zhang R, Dunker R, Scott DL, Joachimiak A, Goodman SL, Arnaout MA. Science. 2001;294:339–345. doi: 10.1126/science.1064535. [DOI] [PMC free article] [PubMed] [Google Scholar]
- 5.Xiong JP, Stehle T, Zhang R, Joachimiak A, Frech M, Goodman SL, Arnaout MA. Science. 2002;296:151–155. doi: 10.1126/science.1069040. [DOI] [PubMed] [Google Scholar]
- 6.Springer TA. Proc Natl Acad Sci U S A. 1997;94:65–72. doi: 10.1073/pnas.94.1.65. [DOI] [PMC free article] [PubMed] [Google Scholar]
- 7.Colombatti A, Bonaldo P. Blood. 1991;77:2305–2315. [PubMed] [Google Scholar]
- 8.Shimaoka M, Xiao T, Liu JH, Yang Y, Dong Y, Jun CD, McCormack A, Zhang R, Joachimiak A, Takagi J, Wang JH, Springer TA. Cell. 2003;112:99–111. doi: 10.1016/s0092-8674(02)01257-6. [DOI] [PMC free article] [PubMed] [Google Scholar]
- 9.Legge GB, Kriwacki RW, Chung J, Hommel U, Ramage P, Case DA, Dyson HJ, Wright PE. J Mol Biol. 2000;295:1251–1264. doi: 10.1006/jmbi.1999.3409. [DOI] [PubMed] [Google Scholar]
- 10.Huth JR, Olejniczak ET, Mendoza R, Liang H, Harris EA, Lupher ML, Jr, Wilson AE, Fesik SW, Staunton DE. Proc Natl Acad Sci U S A. 2000;97:5231–5236. doi: 10.1073/pnas.97.10.5231. [DOI] [PMC free article] [PubMed] [Google Scholar]
- 11.Jin M, Andricioaei I, Springer TA. Structure. 2004;12:2137–2147. doi: 10.1016/j.str.2004.10.005. [DOI] [PubMed] [Google Scholar]
- 12.Lu C, Shimaoka M, Ferzly M, Oxvig C, Takagi J, Springer TA. Proc Natl Acad Sci U S A. 2001;98:2387–2392. doi: 10.1073/pnas.041606398. [DOI] [PMC free article] [PubMed] [Google Scholar]
- 13.Shimaoka M, Lu C, Palframan RT, von Andrian UH, McCormack A, Takagi J, Springer TA. Proc Natl Acad Sci U S A. 2001;98:6009–6014. doi: 10.1073/pnas.101130498. [DOI] [PMC free article] [PubMed] [Google Scholar]
- 14.Labadia ME, Jeanfavre DD, Caviness GO, Morelock MM. J Immunol. 1998;161:836–842. [PubMed] [Google Scholar]
- 15.Luo BH, Strokovich K, Walz T, Springer TA, Junichi T. J Biol Chem. 2004;279:27466–27471. doi: 10.1074/jbc.M404354200. [DOI] [PubMed] [Google Scholar]
- 16.Mould AP, Barton SJ, Askari JA, McEwan PA, Buckley PA, Craig SE, Humphries MJ. J Biol Chem. 2003;278:17028–17035. doi: 10.1074/jbc.M213139200. [DOI] [PubMed] [Google Scholar]
- 17.Xiao T, Takagi J, Coller BS, Wang JH, Springer TA. Nature. 2004;432:59–67. doi: 10.1038/nature02976. [DOI] [PMC free article] [PubMed] [Google Scholar]
- 18.Alonso JL, Essafi M, Xiong JP, Stehle T, Arnaout MA. Curr Biol. 2002;12:R340–R342. doi: 10.1016/s0960-9822(02)00852-7. [DOI] [PubMed] [Google Scholar]
- 19.Yang Y, Jun CD, Liu JH, Zhang R, Joachimiak A, Springer TA, Wang JH. Mol Cell. 2004;14:269–276. doi: 10.1016/s1097-2765(04)00204-7. [DOI] [PubMed] [Google Scholar]
- 20.Takagi J, Springer TA. Immunol Rev. 2002;186:141–163. doi: 10.1034/j.1600-065x.2002.18613.x. [DOI] [PubMed] [Google Scholar]
- 21.Dustin ML, Bromley SK, Davis MM, Zhu C. Annu Rev Cell Dev Biol. 2001;17:133–157. doi: 10.1146/annurev.cellbio.17.1.133. [DOI] [PubMed] [Google Scholar]
- 22.Chesla SE, Selvaraj P, Zhu C. Biophys J. 1998;75:1553–1572. doi: 10.1016/S0006-3495(98)74074-3. [DOI] [PMC free article] [PubMed] [Google Scholar]
- 23.Dumaswala UJ, Wilson MJ, Jose T, Daleke DL. Blood. 1996;88:697–704. [PubMed] [Google Scholar]
- 24.Carpen O, Pallai P, Staunton DE, Springer TA. J Cell Biol. 1992;118:1223–1234. doi: 10.1083/jcb.118.5.1223. [DOI] [PMC free article] [PubMed] [Google Scholar]
- 25.Petruzzelli L, Maduzia L, Springer TA. J Immunol. 1995;155:854–866. [PubMed] [Google Scholar]
- 26.Williams TE, Nagarajan S, Selvaraj P, Zhu C. J Biol Chem. 2001;276:13283–13288. doi: 10.1074/jbc.M010427200. [DOI] [PubMed] [Google Scholar]
- 27.Williams TE, Selvaraj P, Zhu C. Biophys J. 2000;79:1858–1866. doi: 10.1016/S0006-3495(00)76435-6. [DOI] [PMC free article] [PubMed] [Google Scholar]
- 28.Williams TE, Nagarajan S, Selvaraj P, Zhu C. Biophys J. 2000;79:1867–1875. doi: 10.1016/S0006-3495(00)76436-8. [DOI] [PMC free article] [PubMed] [Google Scholar]
- 29.Salas A, Shimaoka M, Chen S, Carman CV, Springer T. J Biol Chem. 2002;277:50255–50262. doi: 10.1074/jbc.M209822200. [DOI] [PubMed] [Google Scholar]
- 30.Takagi J, Petre BM, Walz T, Springer TA. Cell. 2002;110:599–611. doi: 10.1016/s0092-8674(02)00935-2. [DOI] [PubMed] [Google Scholar]
- 31.Huang J, Chen J, Chesla SE, Yago T, Mehta P, McEver RP, Zhu C, Long M. J Biol Chem. 2004;279:44915–44923. doi: 10.1074/jbc.M407039200. [DOI] [PubMed] [Google Scholar]
- 32.Johnston SC, Dustin ML, Hibbs ML, Springer TA. J Immunol. 1990;145:1181–1187. [PubMed] [Google Scholar]
- 33.Staunton DE, Dustin ML, Erickson HP, Springer TA. Cell. 1990;61:243–254. doi: 10.1016/0092-8674(90)90805-o. [DOI] [PubMed] [Google Scholar]
- 34.Smith JW, Piotrowicz RS, Mathis D. J Biol Chem. 1994;269:960–967. [PubMed] [Google Scholar]
- 35.Nicholson MW, Barclay AN, Singer MS, Rosen SD, van der Merwe PA. J Biol Chem. 1998;273:763–770. doi: 10.1074/jbc.273.2.763. [DOI] [PubMed] [Google Scholar]
- 36.Mehta P, Cummings RD, McEver RP. J Biol Chem. 1998;273:32506–32513. doi: 10.1074/jbc.273.49.32506. [DOI] [PubMed] [Google Scholar]
- 37.Wild MK, Huang MC, Schulze-Horsel U, van der Merwe PA, Vestweber D. J Biol Chem. 2001;276:31602–31612. doi: 10.1074/jbc.M104844200. [DOI] [PubMed] [Google Scholar]
- 38.Long M, Zhao H, Huang KS, Zhu C. Ann Biomed Eng. 2001;29:935–946. doi: 10.1114/1.1415529. [DOI] [PubMed] [Google Scholar]
- 39.Chesla SE, Li P, Nagarajan S, Selvaraj P, Zhu C. J Biol Chem. 2000;275:10235–10246. doi: 10.1074/jbc.275.14.10235. [DOI] [PubMed] [Google Scholar]
- 40.Thoumine O, Kocian P, Kottelat A, Meister JJ. Eur Biophys J. 2000;29:398–408. doi: 10.1007/s002490000087. [DOI] [PubMed] [Google Scholar]
- 41.Lomakina EB, Waugh RE. Biophys J. 2004;86:1223–1233. doi: 10.1016/S0006-3495(04)74196-X. [DOI] [PMC free article] [PubMed] [Google Scholar]
- 42.Schuck P. Annu Rev Biophys Biomol Struct. 1997;26:541–566. doi: 10.1146/annurev.biophys.26.1.541. [DOI] [PubMed] [Google Scholar]
- 43.Miller J, Knorr R, Ferrone M, Houdei R, Carron CP, Dustin ML. J Exp Med. 1995;182:1231–1241. doi: 10.1084/jem.182.5.1231. [DOI] [PMC free article] [PubMed] [Google Scholar]
- 44.Reilly PL, Woska JR, Jr, Jeanfavre DD, McNally E, Rothlein R, Bormann BJ. J Immunol. 1995;155:529–532. [PubMed] [Google Scholar]
- 45.Jun CD, Shimaoka M, Carman CV, Takagi J, Springer TA. Proc Natl Acad Sci U S A. 2001;98:6830–6835. doi: 10.1073/pnas.121186998. [DOI] [PMC free article] [PubMed] [Google Scholar]
- 46.Vitte J, Benoliel AM, Eymeric P, Bongrand P, Pierres A. Biophys J. 2004;86:4059–4074. doi: 10.1529/biophysj.103.038778. [DOI] [PMC free article] [PubMed] [Google Scholar]
- 47.Zhang X, Wojcikiewicz E, Moy VT. Biophys J. 2002;83:2270–2279. doi: 10.1016/S0006-3495(02)73987-8. [DOI] [PMC free article] [PubMed] [Google Scholar]
- 48.Miura S, Li CQ, Cao Z, Wang H, Wardell MR, Sadler JE. J Biol Chem. 2000;275:7539–7546. doi: 10.1074/jbc.275.11.7539. [DOI] [PubMed] [Google Scholar]
- 49.Doggett TA, Girdhar G, Lawshe A, Schmidtke DW, Laurenzi IJ, Diamond SL, Diacovo TG. Biophys J. 2002;83:194–205. doi: 10.1016/S0006-3495(02)75161-8. [DOI] [PMC free article] [PubMed] [Google Scholar]
- 50.Kumar RA, Dong JF, Thaggard JA, Cruz MA, Lopez JA, McIntire LV. Biophys J. 2003;85:4099–4109. doi: 10.1016/S0006-3495(03)74822-X. [DOI] [PMC free article] [PubMed] [Google Scholar]
- 51.Merkel R, Nassoy P, Leung A, Ritchie K, Evans E. Nature. 1999;397:50–53. doi: 10.1038/16219. [DOI] [PubMed] [Google Scholar]
- 52.Chilkoti A, Stayton PS. J Am Chem Soc. 1995;117:10622–10628. [Google Scholar]
- 53.Ludwig F, Evans E. J Phys Condens Matter. 2000;12:A315–A320. [Google Scholar]
- 54.Silvius JR, Zuckermann MJ. Biochemistry. 1993;32:3153–3161. doi: 10.1021/bi00063a030. [DOI] [PubMed] [Google Scholar]
- 55.Evans E. Annu Rev Biophys Biomol Struct. 2001;30:105–128. doi: 10.1146/annurev.biophys.30.1.105. [DOI] [PubMed] [Google Scholar]
- 56.Shimaoka M, Salas A, Yang W, Weitz-Schmidt G, Springer TA. Immunity. 2003;19:391–402. doi: 10.1016/s1074-7613(03)00238-3. [DOI] [PubMed] [Google Scholar]