Abstract
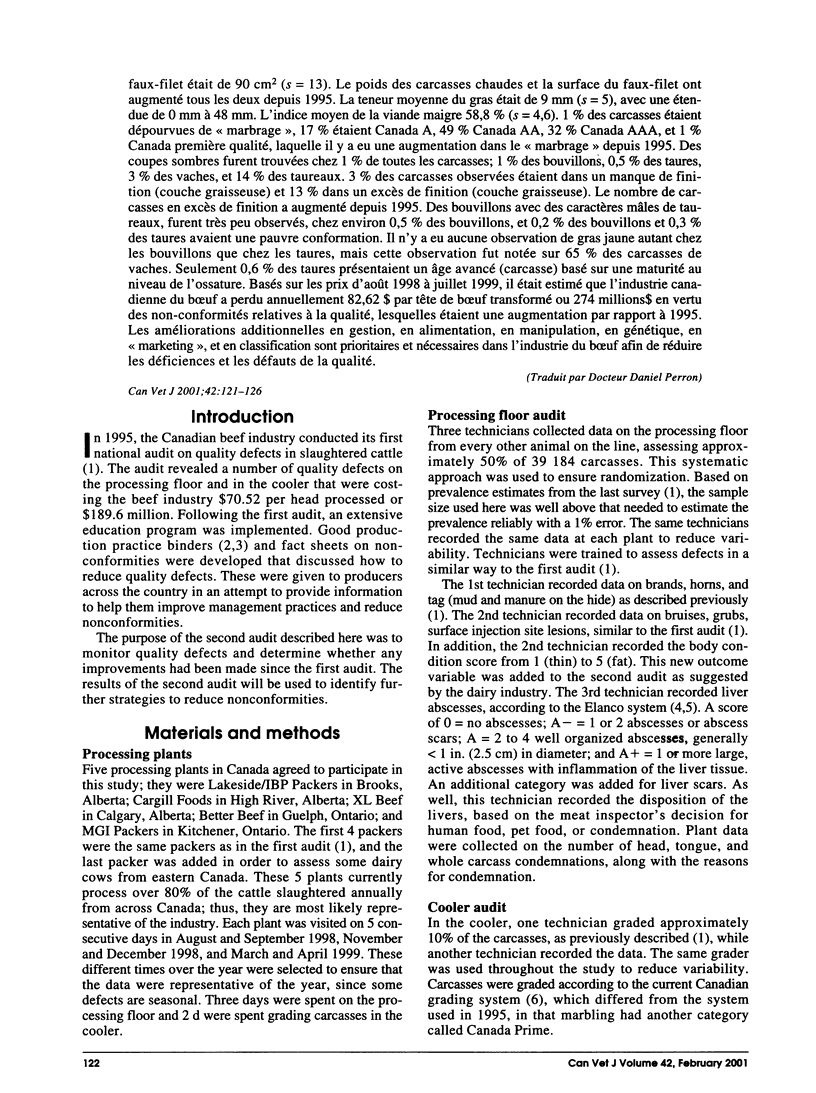
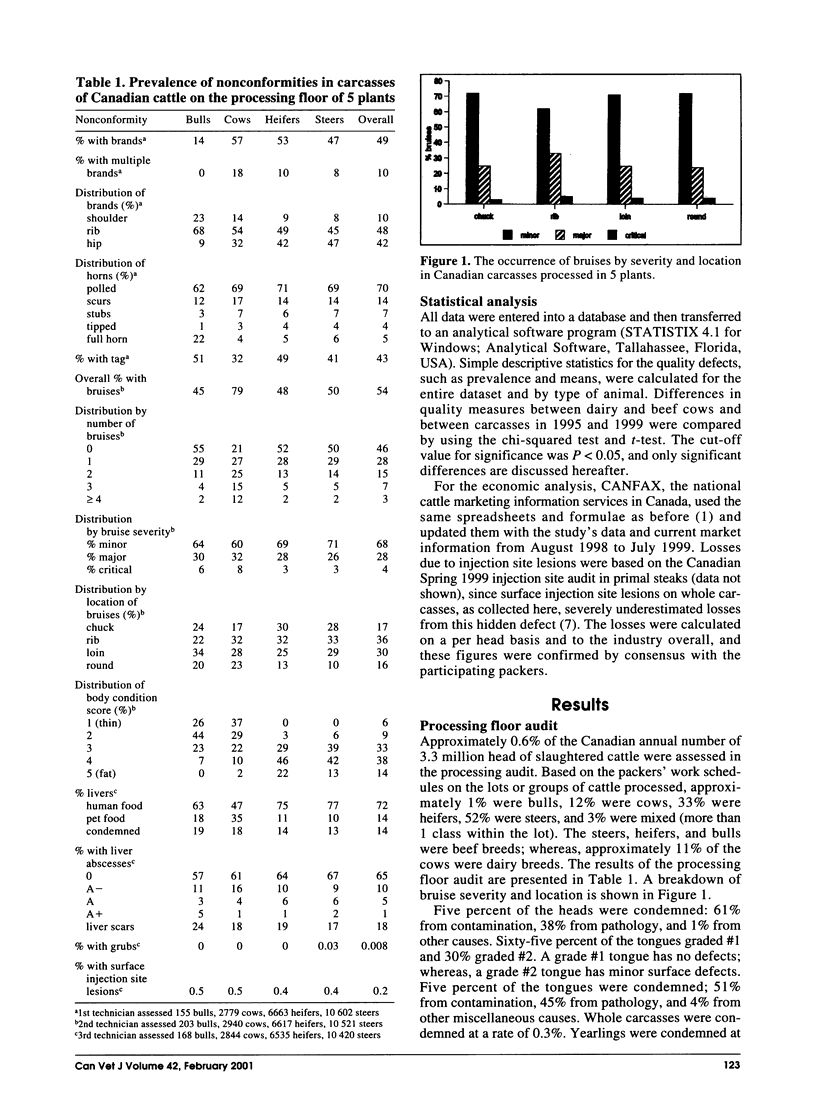
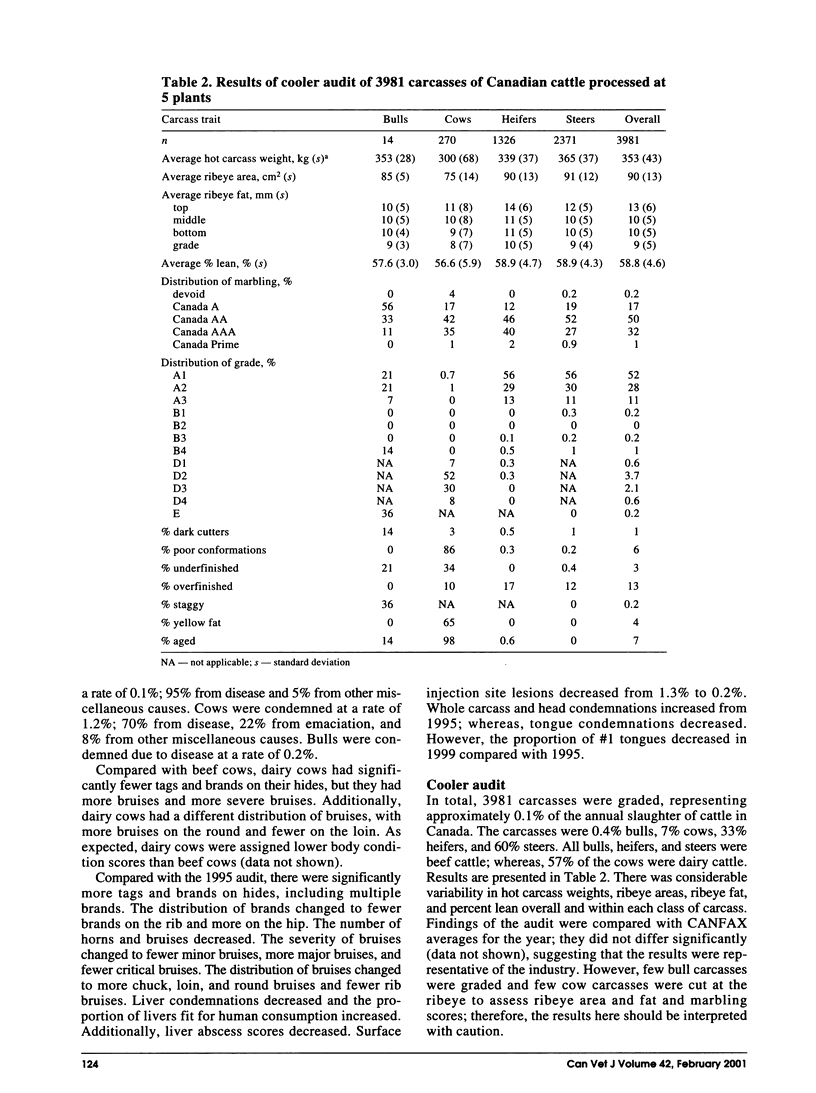
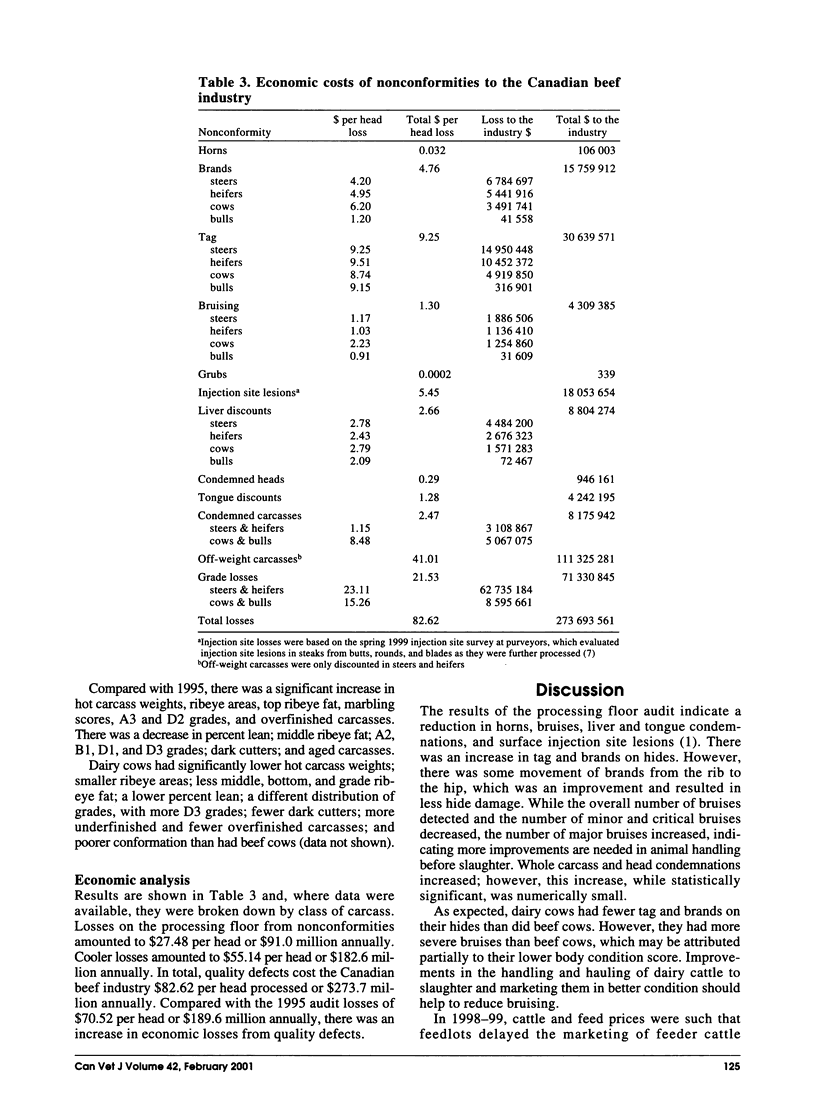
The second beef quality audit was conducted in Canada in 1998-99 to determine the prevalence of quality defects in slaughtered cattle and to monitor changes since the first audit in 1995. Approximately 0.6% of the number of cattle processed annually in Canada were evaluated. Brands were observed on 49% and tag was observed on 43% of the hides. Both brands and tag had increased from 1995. Seventy percent of the cattle were polled and 5% had full horns; thus, the number of horned cattle had decreased from 1995. Bruises were found on 54% of the carcasses, which was a decrease from 78% in 1995. Sixty-eight percent of the bruises were minor, 28% major, and 4% critical in severity. The distribution of bruises on the carcass was 17% on the chuck, 36% on the rib, 30% on the loin, and 16% on the round. Grubs were observed on 0.008% of the carcasses, and surface injection site lesions were observed on 0.2% of the whole carcasses, a decrease from the 1.3% seen in 1995. Seventy-two percent of the livers were passed for human food and 14% for pet food; 14% were condemned. Approximately 64% of the liver losses were due to abscesses. Five percent of the heads and tongues and 0.3% of the whole carcasses were condemned. The hot carcass weight was highly variable in all cattle, averaging 353 kg (s = 43). The average ribeye area was 90 cm2 (s = 13). Both hot carcass weight and ribeye area had increased from 1995. The average grade fat was 9 mm (s = 5), ranging from 0 mm to 48 mm. Lean meat yield averaged 58.8% (s = 4.6). One percent of the carcasses were devoid of marbling, 17% were Canada A, 49% were Canada AA, 32% were Canada AAA, and 1% were Canada Prime, which was an increase in marbling from 1995. Dark cutters were found in 1% of all carcasses; 1% of steers, 0.5% of heifers, 3% of cows, and 14% of bulls. Three percent of the carcasses were underfinished and 13% were overfinished. The number of overfinished carcasses had increased from 1995. Stages, steers with bullish traits, were infrequently observed in 0.5% of the steers, and 0.2% of the steers and 0.3% of the heifers had poor conformation. Yellow fat was not observed in any steers or heifers, but it was found on 65% of the cow carcasses. Only 0.6% of the heifers had an aged carcass, based on skeletal maturity. Based on August 1998 to July 1999 prices, it was estimated that the Canadian beef industry lost $82.62 per head processed, or $274 million annually, from quality nonconformities, which was an increase from 1995. Additional improvements in management, feeding, handling, genetics, marketing, and grading are needed in the beef industry to reduce quality defects.
Full text
PDF
Images in this article
Selected References
These references are in PubMed. This may not be the complete list of references from this article.
- Brink D. R., Lowry S. R., Stock R. A., Parrott J. C. Severity of liver abscesses and efficiency of feed utilization of feedlot cattle. J Anim Sci. 1990 May;68(5):1201–1207. doi: 10.2527/1990.6851201x. [DOI] [PubMed] [Google Scholar]
- Van Donkersgoed J., Dixon S., VanderKop M. Monitoring injection site lesions in Canadian yearling cattle and cull cows and bulls: Spring 1998. Can Vet J. 1999 Aug;40(8):579–580. [PMC free article] [PubMed] [Google Scholar]
- Van Donkersgoed J., Jewison G., Mann M., Cherry B., Altwasser B., Lower R., Wiggins K., Dejonge R., Thorlakson B., Moss E. Canadian beef quality audit. Can Vet J. 1997 Apr;38(4):217–225. [PMC free article] [PubMed] [Google Scholar]


