

Abstract
In obesity and diabetes, the ability of hypothalamic neurons to sense and transduce changes in leptin and insulin levels is compromised. The effects of both hormones require intracellular signalling via the PI3-kinase pathway, which is inhibited by the phosphatase PTEN. We show that leptin-stimulated F-actin depolymerization in mouse hypothalamic cells is inhibited by PTEN, a process involving independent effects of both its lipid and protein phosphatase activities. Potentially mediating this F-actin depolymerization, leptin, but not insulin, stimulated the phosphorylation of PTEN in a CK2 dependent manner, and inhibited its phosphatase activity. Similarly, hyperpolarization of mouse pancreatic β-cells by leptin also requires coincident PtdIns(3,4,5)P3 generation and actin depolymerization, and could be inhibited by mechanisms requiring both the lipid and protein phosphatase activities of PTEN. These results demonstrate a critical role for PTEN in leptin signalling and indicate a mechanism by which leptin and insulin can produce PI3K dependent differential cellular outputs.
Keywords: insulin, leptin, phosphatase, PI3-kinase, PTEN
Introduction
Leptin plays an important role in the long-term regulation of energy balance (Bates and Myers, 2003; Sahu, 2004), and in the maintenance of reproduction (Bajari et al, 2004) and immune responses (Matarese et al, 2005). Variations in circulating leptin levels are sensed by specific groups of hypothalamic neurons, responsible for integrating and transducing neural, hormonal and nutrient signals into functional outputs (e.g. changes in food intake, energy storage). Two groups of arcuate nucleus neurons are implicated in the control of food intake and body weight; melanocortin peptide (mainly αMSH) containing neurons (denoted by its peptide precursor, proopiomelanocortin (POMC)), and neuropeptide Y (NPY) and agouti-related peptide (AgRP) containing neurons, which drive catabolic and anabolic outputs respectively (Schwartz et al, 2000). Leptin alters transcription in these neurons, increasing POMC and decreasing NPY and AgRP mRNA levels. Leptin also changes arcuate neuron excitability acutely, causing depolarization of POMC neurons (Cowley et al, 2001; Choudhury et al, 2005) and hyperpolarization of glucose-responsive (GR) neurons (Spanswick et al, 1997; Mirshamsi et al, 2004), which may be NPY containing (van den Top et al, 2004).
Insulin also acts as a peripheral-derived signal informing the brain about body fat stores, and it shares many of leptin's actions on arcuate neurons, including changes in POMC, NPY and AgRP mRNA levels (Niswender et al, 2004), and hyperpolarization of GR neurons (Spanswick et al, 2000). However, insulin signalling pathway inhibition in the hypothalamus induces a milder obesity phenotype compared to leptin receptor deficits (Niswender et al, 2004). Thus, it is possible that leptin and insulin will display differential actions on hypothalamic arcuate neurons, perhaps through variable signalling pathway processing, resulting in selective neuronal outputs. In support of this idea, it has been demonstrated recently that insulin hyperpolarizes, and leptin depolarizes, POMC neurons (Choudhury et al, 2005). However, in most studies of hypothalamic signal transduction mechanisms, insulin and leptin produce parallel signalling outputs involving the STAT3 pathway, implicated in transcriptional changes, and the phosphatidylinositol 3-kinase (PI3K) pathway, linked with acute membrane effects such as GR neuron hyperpolarization, with both pathways considered as important mediators of food intake and energy balance (Niswender and Schwartz, 2003; Niswender et al, 2004).
In this study, we have focused on the PI3K pathway, as leptin and insulin have been demonstrated to increase PtdIns(3,4,5)P3 (phosphatidylinositol 3,4,5-trisphosphate) levels in certain arcuate neurons and hypothalamic cell lines (Niswender et al, 2003; Mirshamsi et al, 2004; Xu et al, 2005). Furthermore, hyperpolarization of GR neurons by these hormones is PI3K dependent (Spanswick et al, 2000; Mirshamsi et al, 2004) and PI3K inhibition prevents leptin and insulin reduction of food intake (Niswender et al, 2001, 2003). The tumour suppressor protein PTEN (phosphatase and tensin homologue deleted on chromosome 10) antagonizes the cellular PI3K pathway by dephosphorylating the 3-position of the inositol ring of PtdIns(3,4,5)P3. PTEN is a member of the protein tyrosine phosphatase family and displays both protein-phosphatase and lipid phosphatase activity in vitro. It is the lipid phosphatase action of PTEN that is mainly associated with its biological outputs, notably inhibition of cell growth, proliferation and survival (Furnari et al, 1998; Myers et al, 1998). The functional inactivation of PTEN is linked with the development of numerous human tumour types, and has been implicated in several other diseases (Leslie and Downes, 2004).
Leptin hyperpolarizes rat insulin-secreting cells by activation of ATP-sensitive K+ (KATP) channels, which is dependent upon PI3K activity and re-organization of the actin cytoskeleton (Harvey et al, 2000a, 2000b). The PI3K-dependent hyperpolarization of hypothalamic GR neurons by leptin and insulin is also dependent on actin status (Spanswick et al, 2000; Mirshamsi et al, 2004). Consequently, we used two measures of leptin mediated cellular output, F-actin re-organization in hypothalamic cells and KATP activity in mouse pancreatic β-cells, to determine the contribution of PI3K and the role of PTEN in leptin and insulin signalling.
Results
The leptin-sensitive GT1–7 (Mirshamsi et al, 2004) and N29/4 (Belsham et al, 2004) hypothalamic cell lines express PTEN endogenously as shown by Western blot and immunocytochemistry (Figure 1A and B). Unless otherwise stated, replicates of data presented refer to each cell line, with no detectable difference in their responses to the treatments described. Transfection of either hypothalamic cell line with siRNA directed to PTEN (n=6) reduced endogenous PTEN levels whereas scrambled siRNA had no effect (Figure 1C). The siRNA mediated PTEN knockdown increased cellular PtdIns(3,4,5)P3 (Figure 1D, Table I; n=4), as assessed by staining with a monoclonal PtdIns(3,4,5)P3 antibody. This outcome was dependent upon basal PI3K activity as, in the presence of the PI3K inhibitor LY294002, antibody staining was reduced to control levels (Figure 1D, Table I). Using Alexa 488 or 594 conjugated phalloidin to monitor F-actin levels in GT1–7 and N29/4 cells, transfection with wild-type PTEN had no effect (n=5) on F-actin per se but prevented leptin (n=5) from decreasing F-actin levels (Figure 1E; Table II). The leptin-induced reduction of F-actin was prevented by inhibition of PI3K (Figure 1E; Table II), as previously reported (Mirshamsi et al, 2004). Similar data were obtained following transfection of cells with myristoylated PTEN (myrPTEN), indicating that the PTEN-induced block of leptin action is membrane delimited (n=5; data not shown). Knockdown of endogenous PTEN with siRNA resulted in F-actin disruption, in the absence of leptin (Figure 1F; Table II), which was prevented by wortmannin (100 nM, n=6) or LY294002 (10 μM, n=6), indicating dependence on PI3K activity (Figure 1F; Table II). Thus, reduction in PTEN levels per se raises PtdIns(3,4,5)P3, most likely due to the background steady-state activity of PI3K, which then acts to de-polymerize F-actin. This is consistent with leptin disruption of F-actin requiring PI3K activity and increased PtdIns(3,4,5)P3 at the plasma membrane (Harvey et al, 2000a; Mirshamsi et al, 2004; Figure 1G), with endogenous PTEN negatively regulating this process. Consequently it is generally assumed that leptin increases PtdIns(3,4,5)P3 levels primarily by stimulating PI3K activity (Niswender et al, 2001; Zhao et al, 2002). However, analysis of IRS-1, IRS-2 and phosphotyrosine associated PI3K activity demonstrated that leptin did not stimulate PI3K activity in N29/4 cells (Figure 1H). In contrast, insulin stimulation of N29/4 cells increased PI3K activity (Figure 1H) and raised cellular levels of PtdIns(3,4,5)P3 (Table I), but did not reduce F-actin levels (Figure 3A). Thus, increasing PtdIns(3,4,5)P3 levels alone may be necessary but insufficient to drive F-actin de-polymerization in these hypothalamic cells, indicating that leptin produces an additional signal to cause this action. This also left the question open as to the mechanism by which leptin increased PtdIns(3,4,5)P3 in these cells.
Figure 1.
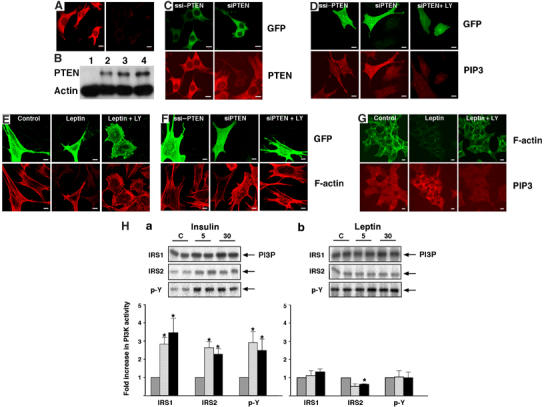
PTEN controls PtdIns(3,4,5)P3, F-actin levels and leptin sensitivity. (A) Immunocytochemical detection of PTEN in N29/4 cells using a Cy3 secondary antibody on cells treated with monoclonal PTEN antibody (left) and secondary antibody control (right). (B) Western blot analysis of PTEN expression in U87MG (lane 1), GT1–7 (lane 2), N29/4 (lane 3) cells and rat brain (lane 4). (C) N29/4 cells were transfected with scrambled PTEN siRNA sequence (ssi-PTEN) or siRNA sequence for PTEN (siPTEN) and identified by GFP co-expression (top panels). Effects on expression of endogenous PTEN determined by immunocytochemical detection (lower panels). (D) PtdIns(3,4,5)P3 levels in N29/4 cells transfected with siPTEN (marked by co-transfected GFP, upper panels) were investigated using a PtdIns(3,4,5)P3 antibody (lower panels) and compared to cells transfected with ssiPTEN, and those also treated with the PI3K inhibitor LY294002. (E) PTEN-GFP was overexpressed in N29/4 cells (upper panels) and F-actin visualized with Alexa 594-phalloidin (lower panels) with and without stimulation with 10 nM leptin. Note that untransfected cells in the leptin treated group are not easily visible in the lower panels due to leptin stimulated F-actin de-polymerization. (F) F-actin levels were visualized (lower panels) in N29/4 cells transfected with siPTEN or control ssiPTEN (visualized by co-transfected GFP, upper panels). The dependence of the RNAi effects on PI3K activity was determined by treatment of cells with 10 μM LY294002 (right panels). (G) Cellular F-actin distribution and PtdIns(3,4,5)P3 levels were visualized using Alexa 488-phalloidin (top panels) and an antibody to PtdIns(3,4,5)P3 (lower panels), respectively, in N29/4 cells in the absence (left panels) or presence of 10 nM leptin (middle panels) and 10 nM leptin+10 μM LY294002 (right panels). (H) Changes in insulin receptor substrate-1 (IRS-1), IRS-2 and phosphotyrosine (p-Y) associated PI3K activity in N29/4 cells stimulated with 10 nM (a) insulin or (b) leptin. Representative phosphor images obtained from the thin-layer chromatography plate showing PI(3)P production (upper panels). Normalized levels of PI(3)P are shown in the lower panels, relative to individual saline control group, following 5 (hatched bars) and 30 (filled bars) minutes exposure to hormone. Values represent the mean±s.e.m. for 3–4 experiments per group (*P<0.05, compared to control levels for each treatment). Scale bars: 10 μm.
Table 1.
PtdIns(3,4,5)P3 levels
| (A) | |||||||||
|---|---|---|---|---|---|---|---|---|---|
| ssiPTEN | siPTEN | siPTEN+LY | LY | PTEN | PTEN C124S | PTEN C124S+LY | PTEN G129E | PTEN G129E+LY | |
| 1.00±0.01 | 2.84±0.14a | 1.00±0.01 | 0.63±0.02a | 0.35±0.01a | 3.33±0.21a | 1.02±0.02 | 3.30±0.20a | 1.01±0.02 | |
| (B) | |||||||||
| Insulin |
Insulin±LY |
Leptin |
Leptin±LY |
D3PTEN |
D3PTEN±LY |
A3PTEN |
A3G129E |
D3G129E |
D3G129E±LY |
| 3.50±0.10a | 1.02±0.02 | 3.24±0.10a | 0.98±0.01 | 3.02±0.09a | 1.02±0.02 | 0.42±0.02a | 2.64±0.11 | 3.12±0.13a | 1.02±0.02 |
| Levels of PtdIns(3,4,5)P3 in N29/4 cells following treatment with PTEN constructs. Data are shown as a ratio of control (untreated) cells. Cells treated with 10 μM LY294002 for 20 min before fixing. | |||||||||
| aP<0.05 compared with control. | |||||||||
Table 2.
F-actin levels
| (A) | ||||||||
|---|---|---|---|---|---|---|---|---|
| ssiPTEN | siPTEN | siPTEN+LY | LY | Leptin | Leptin+LY | PTEN+Leptin | PTENC124S | PTENC124S+LY |
| 0.98±0.02 | 0.27±0.02a | 0.99±0.02 | 1.02±0.01 | 0.32±0.01a | 0.99±0.01 | 0.99±0.02b | 0.36±0.02a | 0.98±0.02 |
| (B) | ||||||||
| PTENG129E |
PTENG129E+Leptin |
A3PTEN |
D3PTEN |
D3PTEN+LY |
D3G129E |
D3G129E+LY |
A3G129E |
A3G129E+Leptin |
| 1.01±0.01 | 0.98±0.02b | 0.99±0.01 | 0.45±0.02a | 0.99±0.01 | 0.49±0.02a | 0.90±0.02 | 0.99±0.01 | 0.99±0.01b |
| Levels of F-actin in N29/4 cells following treatment with PTEN constructs±leptin. Data are shown as a ratio of control (untreated) cells. | ||||||||
| aP<0.05 compared with control. | ||||||||
| bP<0.05 compared with leptin alone. | ||||||||
Figure 3.
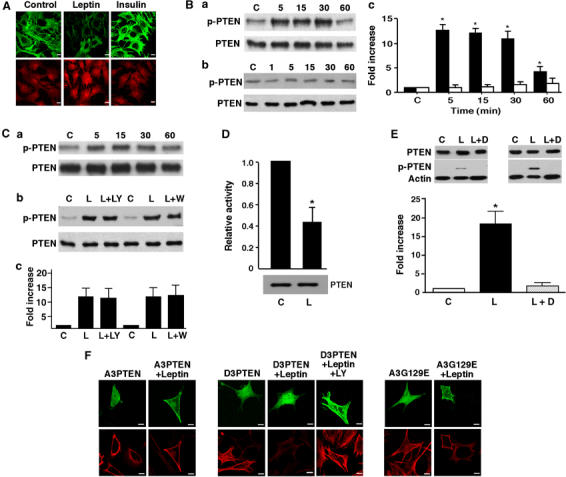
Leptin increases PTEN phosphorylation. (A) N29/4 cells were incubated in the absence and presence of 10 nM leptin or 10 nM insulin for 15–20 min. F-actin (upper panels) and p-PTEN (lower panels) were visualized by Alexa 488-phalloidin and Cy3 staining, respectively. (B) PTEN phosphorylation was determined in N29/4 cells stimulated with 10 nM leptin (a) or 10 nM insulin (b) for the indicated times (minutes). The bar graph (c) shows mean normalized p-PTEN against total PTEN levels for un-treated cells and cells stimulated with leptin (filled bars; n=5) and insulin (open bars; n=5) up to 60 min (*P<0.05, versus control, or insulin). (C) PTEN phosphorylation in N29/4 cells is shown in response to 10 nM leptin for the indicated times after pretreatment with 100 nM jasplakinolide (a) or pretreated with and without 100 nM wortmannin (W) or 10 μM LY294002 (LY) (b) for 20 min before leptin (L) stimulation (5 min). The bar graph (c) shows mean normalized p-PTEN against total PTEN levels for leptin in the absence and presence of LY294002 and wortmannin (n=6 for each). (D) PTEN PtdIns(3,4,5)P3 phosphatase activity assayed from cells with and without leptin treatment (10 nM for 5 min). PTEN immunoprecipitates were assayed in triplicate against PtdIns(3,4,5)P3 containing vesicles and Ins(1,3,4,5)P4 (see Supplementary Figures S3 and S4). Normalized activity (mean activity against PtdIns(3,4,5)P3 divided by mean activity against Ins(1,3,4,5)P4) presented as the mean relative value from two experiments+the range/2. PTEN content of the immunoprecipitate was determined by Western blotting for PTEN (*P<0.05). (E) p-PTEN levels in N29/4 cells (n=6) in response to leptin alone and in the presence of 10 μM DMAT (*P<0.05 versus control or leptin+DMAT). (F) A3PTEN-GFP and A3G129E PTEN-GFP were overexpressed in N29/4 cells (upper panels) with (right) and without (left) leptin stimulation, before F-actin visualization (lower panels). D3PTEN overexpression (upper panels), with leptin (middle) and leptin+LY294002 (right) treatment and F-actin visualization (lower panels). Scale bars: 10 μm.
Phosphatase dead PTEN mutants and F-actin
To explore the contribution of PTEN to leptin signalling, we examined the effects of various PTEN mutants (Figure 2A) on F-actin status in the presence and absence of leptin. The phosphatase dead C124S PTEN mutant (Myers et al, 1998), transfected into N29/4 and GT1–7 cells, increased PtdIns(3,4,5)P3 (n=5; Table I) and decreased F-actin (n=5; Table II) levels, both effects displaying sensitivity to inhibition of PI3K (n=5; Figure 2B and D; Tables I and II). A reduction in F-actin also occurred on transfection of cells with myristoylated C124S PTEN, which was also blocked (n=6) by PI3K inhibition (data not shown). These results are consistent with the C124S mutant acting on endogenous PTEN in a dominant-negative manner so that removal of phosphatase activity mimics the action of leptin on F-actin structure at the plasma membrane, in the presence of active PI3K.
Figure 2.
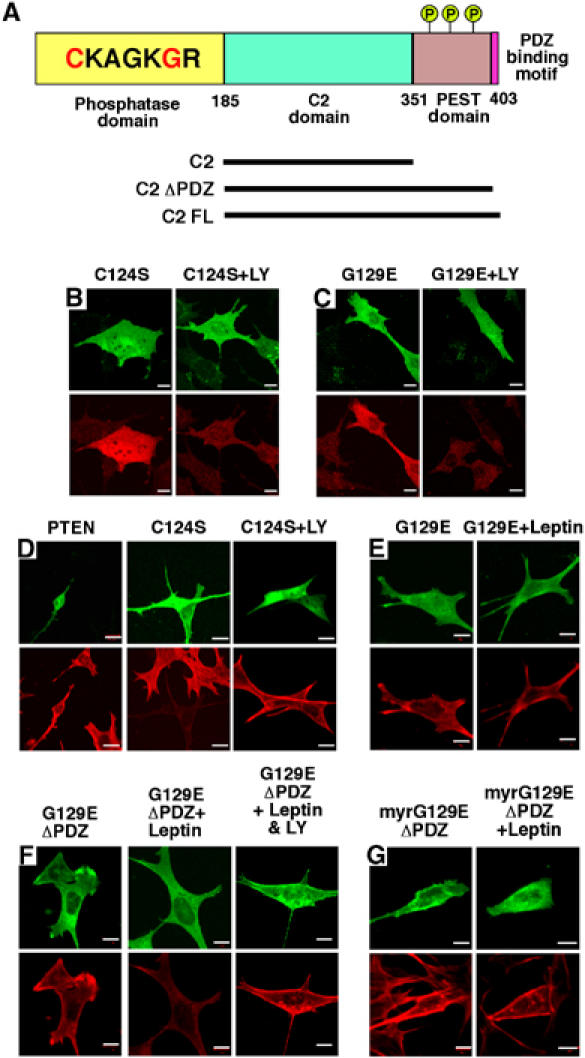
Effects of PTEN mutants on F-actin levels. (A) Schematic of PTEN and constructs used in this study. The N-terminal phosphatase domain (amino acids 1–185) is shown with the catalytic core and the missense mutations highlighted in red: C124S giving a lipid- and protein-phosphatase inactive protein and G129E a lipid-phosphatase inactive, protein-phosphatase active protein. The C2 (186–351) and PEST domains associated with phospholipid binding and protein stability, respectively, and the PDZ binding sequence, important for protein–protein interactions, are shown. Several C2 domain mutants were tested for inhibition of leptin action on F-actin: C2 (182–355), C2ΔPDZ (182–398) and C2FL (182–403). Phosphorylation sites on the C-terminal tail are represented by a circled letter P. The effects of overexpression of C124S PTEN-GFP (B) and G129E PTEN-GFP (C) in N29/4 cells (upper panels) on PtdIns(3,4,5)P3 levels (lower left), are shown, and in the presence of 10 μM LY294002 (lower right). (D) F-actin was visualized (lower panels) in cells overexpressing PTEN-GFP (top left), C124S PTEN-GFP (upper middle and upper right) in the absence (middle) or in the presence (right) of 10 μM LY294002. (E, F) F-actin visualized (lower panels) in N29/4 cells overexpressing G129E PTEN-GFP (E), G129EΔPDZ PTEN-GFP (F) (upper panels) without (left) and with 10 nM leptin (middle) and 10 nM leptin+10 μM LY294002 (right) stimulation. (G) F-actin visualized (lower panels) in cells overexpressing myrG129EΔPDZ PTEN-GFP (upper panels) in the absence (left panels) and presence (right panels) of 10 nM leptin. Scale bars: 10 μm.
To determine whether any of the effects of PTEN expression were attributable to its lipid and/or protein phosphatase activity hypothalamic cells were transfected with G129E PTEN, which is lipid phosphatase dead but fully active as a protein phosphatase (Myers et al, 1998). G129E PTEN did not (n=5), per se, induce actin-rearrangement (Figure 2E; Table II), although cellular PtdIns(3,4,5)P3 was increased (n=5) in a PI3K-dependent manner (Figure 2C; Table I). This further demonstrates that raised PtdIns(3,4,5)P3 alone is insufficient to cause F-actin depolymerization in hypothalamic cells. Furthermore, N29/4 and GT1–7 (n=6) cells transfected with G129E PTEN no longer responded to leptin with a change in F-actin level (Figure 2E; Table II). One interpretation of these results is that for leptin to influence F-actin status in these cells, there is a requirement for increased PtdIns(3,4,5)P3 levels and for the phosphorylation of a currently unidentified protein or proteins, the latter being inhibited by the protein phosphatase activity of PTEN.
PTEN C2 domain does not affect leptin signalling
However, the C2 domain of PTEN (Figure 2A) has recently been demonstrated to display intrinsic biological activity. Expression of the C2 domain in human glioma cells inhibits cell migration, in a manner identical to that observed for the G129E PTEN mutant (Rafatopolou et al, 2004). Thus, if the C2 domain mimics the protein phosphatase dependent effect of PTEN here, overexpression of C2 should antagonize the effect of leptin on F-actin. Various C2-GFP and myristoylated GFP-C2 domain truncations (Figure 2A) were expressed in N29/4 cells and none of the constructs tested (C2 only, C2ΔPDZ, C2FL, myrC2 only, myrC2ΔPDZ and myrC2FL) altered F-actin levels or blocked leptin reduction of F-actin (Supplementary Figure S1; Supplementary Table S1).
Overexpression of the PTEN mutant (ΔPDZ PTEN), which lacks the last 5 C-terminal amino acids and therefore the PDZ binding motif, has intact catalytic and C2 domains and displays lipid and protein phosphatase activities (Leslie et al, 2000, 2001), did not block the actions of leptin (n=4; data not shown). Furthermore, cells in which the G129EΔPDZ PTEN construct was expressed exhibited no change in F-actin under control conditions (n=5), but displayed sensitivity to leptin, with reduction in F-actin levels, which was reversed by LY294002 (n=5; Figure 2F). In contrast, the myristoylated form of this construct (myrG129EΔPDZ PTEN) expressed in N29/4 cells did not affect F-actin (n=6), but did prevent leptin from reducing F-actin levels (n=6; Figure 2G).
Phosphorylation of PTEN
The biological activity of PTEN has been suggested to be controlled by phosphorylation at amino-acid residues clustered between S370 and S385 (Figure 2A), in a highly acidic stretch of the C-terminal region (Leslie and Downes, 2004), and analysis of the effects of PTEN phosphorylation site mutants on PKB/Akt phosphorylation agrees with this conclusion (Supplementary Figure S2). Therefore, we examined PTEN phosphorylation status using an antibody that recognizes phosphorylation at Ser-380, Thr-382 and Thr-383. Leptin (10–50 nM) applied to GT1–7 or N29/4 cells rapidly increased the level of phosphorylated PTEN (p-PTEN), an action sustained for up to 30 min, which then declined, but remained significantly above control after 1 h (Figure 3A and B). LY294002 (n=5) or wortmannin (n=5) did not affect the leptin-driven phosphorylation of PTEN (Figure 3C), suggesting no involvement of a PI3K-dependent feedback control. To substantiate the idea that leptin induces phosphorylation and inhibition of PTEN, we directly monitored cellular PTEN activity against radiolabelled substrates using an immunoprecipitation approach (see Supplementary Methods). In vitro experiments using recombinant PTEN and PTEN C-terminal alanine or aspartate phosphorylation site mutants, A3PTEN and D3PTEN to block or mimic PTEN phosphorylation, respectively, established that phosphorylation greatly reduced the specific activity of PTEN versus PtdIns(3,4,5)P3-containing lipid vesicles compared with its activity against soluble Ins(1,3,4,5)P4, the headgroup of PtdIns(3,4,5)P3 (Supplementary Figures S3 and S4). Using this assay N29/4 cells were stimulated with 10 nM leptin and immunoprecipitated PtdIns(3,4,5)P3 phosphatase activity was reduced by nearly 60% compared to untreated cells (Figure 3D), indicating that the observed increase in PTEN phosphorylation is correlated with a decrease in interfacial lipid phosphatase activity. This is compatible with phosphorylation preventing the interaction of PTEN with membrane surfaces (Das et al, 2003). A number of studies have implicated protein kinase CK2 as the phosphorylating kinase at these sites (Torres and Pulido, 2001; Miller et al, 2002). In support of this, 10 μM 2-dimethyl-amino-4,5,6,7-tetrabromobenzimidazole (DMAT), a CK2 inhibitor (Pagano et al, 2004), prevented leptin from inducing PTEN phosphorylation (n=6; Figure 3E).
We also examined the effects of the phosphorylation mutants, A3PTEN, D3PTEN and A3G129E PTEN and D3G129E PTEN on F-actin and PtdIns(3,4,5)P3 levels and leptin sensitivity following transfection into N29/4 cells. Overexpression of A3PTEN, which displays enhanced PtdIns(3,4,5)P3 phosphatase activity (Supplementary Figure S3) reduced PtdIns(3,4,5)P3 levels (Table I) did not affect F-actin (Table II) and inhibited leptin-induced F-actin reduction (Figure 3F). D3PTEN, which displays reduced PtdIns(3,4,5)P3 phosphatase activity (Supplementary Figure S3), increased PtdIns(3,4,5)P3 (Table I) and reduced F-actin in the absence of leptin (Figure 3F, Table II). However, overexpression of A3G129E PTEN increased PtdIns(3,4,5)P3 (Table I) with no F-actin change in control or with leptin (Figure 3F, Table II), whereas D3G129E PTEN raised PtdIns(3,4,5)P3 and initiated reduction in F-actin levels, both dependent on PI3K, in the absence of leptin (Tables I and II). Thus overexpression of A3G129E PTEN, compared to D3G129E PTEN, did not reduce F-actin and inhibited the ability of leptin to reduce F-actin, in face of raised PtdIns(3,4,5)P3 levels suggesting that phosphorylation of the S380/T382/T383 site is required to limit PTEN protein phosphatase activity and permit subsequent F-actin depolymerization.
Leptin raises PtdIns(3,4,5)P3 via PTEN phosphatase inhibition
Stimulation of N29/4 cells with insulin, like leptin, increased PtdIns(3,4,5)P3 levels (Table I) and stimulated downstream signalling (as indicated by increased levels of p-PKB and p-GSK3 (unpublished data)). However, insulin did not decrease F-actin staining in N29/4 cells (Figure 3A), which could be due to a lack of action on PTEN phosphorylation and activity. Consistent with this hypothesis, insulin (1–10 nM) had no effect (n=18) on p-PTEN levels of N29/4 cells for exposure times up to 1 h (Figure 3A and B). The alteration in F-actin status by leptin, but not insulin, does not explain this difference, as F-actin stabilization by 100 nM jasplakinolide, which prevents leptin induced F-actin depletion in hypothalamic neurons (Mirshamsi et al, 2004), had no effect (n=3) on the leptin driven increase in p-PTEN (Figure 3C). To demonstrate that PTEN phosphorylation by leptin was driven by activation of the main signalling form of the leptin receptor, LRb (Bates and Myers, 2003), we used the U87MG PTEN-null (see Figure 1A) glioblastoma cell line, which is also devoid of leptin receptors (data not shown). Wild-type PTEN protein was expressed in U87MG cells by viral infection. This resulted in a steady-state level of p-PTEN in un-stimulated cells, which was unaltered by leptin (Figure 4A). In contrast, using U87MG cells, stably transfected with LRb (LRbU87 cells), and expressing PTEN by viral infection, leptin, but not insulin, increased p-PTEN levels (Figure 4B–D). The LRbU87 cell line allowed us to clarify the role of PTEN in leptin signalling by distinguishing between dominant effects of the PTEN mutants on PtdIns(3,4,5)P3 and F-actin levels and leptin manipulation of PTEN activity itself. Thus, in LRbU87 cells, insulin (10 nM) increased PtdIns(3,4,5)P3 levels, in the absence of PTEN, whereas leptin (10 nM) had no effect (Figure 4E). In contrast, LRbU87 cells infected with PTEN, which displayed a similar increase in PtdIns(3,4,5)P3 to insulin, also demonstrated a significant increase in PtdIns(3,4,5)P3 in response to leptin (Figure 4E). These data establish that leptin does not raise PtdIns(3,4,5)P3 levels in the absence of PTEN, validating the PI3K activity result. Thus, we suggest that inhibition of PTEN by leptin is required to elicit increased PtdIns(3,4,5)P3 levels in hypothalamic cells. To demonstrate this, N29/4 cells were stimulated with insulin (10 nM) to increase PI3K activity and raise PtdIns(3,4,5)P3, and subsequently cells were either washed in saline containing LY294002 alone or LY294002 and leptin (10 nM). The rate of decline of PtdIns(3,4,5)P3 was then followed with time (Figure 4F). The presence of leptin significantly slowed the decline in PtdIns(3,4,5)P3 levels in the cells, consistent with inhibition of PTEN phosphatase activity.
Figure 4.
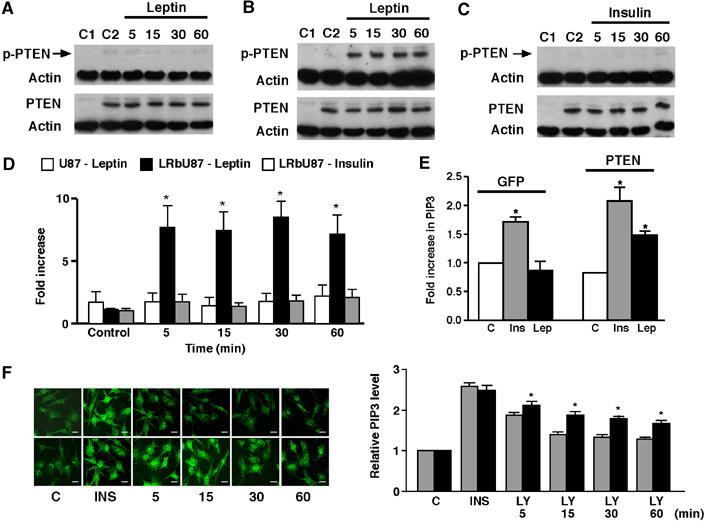
ObRb is necessary for phosphorylation of PTEN by leptin. (A) U87MG cells were infected with virus encoding PTEN for 24 h before stimulation with 10 nM leptin for 5, 15, 30 and 60 min. LRbU87 cells were infected and stimulated with 10 nM leptin (B) and 10 nM insulin (C). Cells were lysed and p-PTEN levels assessed, the blot stripped and re-probed with antibody raised against PTEN with actin expression used as a loading control. C1 and C2 denote control U87MG (A) and LRbU87 (B, C) cells in the absence (C1) and presence (C2) of PTEN infection. (D) Bar graph showing mean normalized p-PTEN against total PTEN levels for U87 cells (n=3) and LRbU87 cells (n=4), infected with PTEN, stimulated by leptin (n=4) and by insulin (n=4) for up to 60 min. (*P<0.05, compared to U87MG cells stimulated with leptin or LRbU87 cells stimulated with insulin). (E) PtdIns(3,4,5)P3 levels in response to leptin and insulin. LRbU87 cells, metabolically labelled and infected with viruses expressing either GFP (left) or PTEN (right), were stimulated with 10 nM leptin or 500 nM insulin for 10 min, and cellular PtdIns(3,4,5)P3 determined. Data are presented as mean PtdIns(3,4,5)P3 measurement relative to unstimulated control GFP expressing cells, from three samples±s.d. The data point for unstimulated GFP expressing cells corresponds to 1107 dpm in the PtdIns(3,4,5)P3 peak, or 0.034% of PtdIns. (F) N29/4 cells were stimulated with insulin (10 nM) for 5 min, cells washed with LY294002 (100 μM) alone (upper panels) or LY and leptin (10 nM; lower panels), and the levels of PtdIns(3,4,5)P3 followed with time by immunocytochemical staining for PtdIns(3,4,5)P3. Normalized PtdIns(3,4,5)P3 levels are presented with respect to untreated control cells (n=8). (*P<0.05, compared to LY alone). Scale bars: 10 μm.
PTEN phosphatase activity and KATP channel activation
From these results we predicted that leptin stimulated cytoskeletal-regulated cellular outputs such as activation of KATP channels would be inhibited by overexpression of G129E PTEN and mimicked by C124S PTEN. We assessed this by examining the actions of these PTEN mutants on the excitability of mouse primary cultured pancreatic β cells in the presence and absence of leptin. In 10 mM glucose, the mean resting membrane potential of β-cells was −42.8±5.3 mV (n=5). Application of leptin (10 nM) resulted, after a delay of 10–15 min, in hyperpolarization of β-cells to −71.2±3.0 mV (n=5; Figure 5A), which was reversibly inhibited (n=3) by the sulphonylurea tolbutamide (100 μM), indicating that the conductance increase is due to KATP activation (Harvey et al, 1997; Keiffer et al, 1997). In contrast, 10 nM insulin applied to mouse pancreatic β-cells had no effect on the membrane potential (n=3: data not shown). The presence, 10–15 min prior to challenge with leptin, of wortmannin (100 nM; n=3) or jasplakinolide (100 nM; n=3), had no effect on membrane potential (−38.3±4.4 and −39.0±2.1 mV, respectively). Subsequent addition of leptin resulted in membrane potentials of −41.3±7.5 and −36.0±3.5 mV (n=3; P>0.05 compared to controls), respectively, which are significantly different (P<0.05) from the control leptin response. These data confirm the PI3K and F-actin status dependence of KATP channel activation by leptin in the CRI-G1 insulin-secreting cell line (Harvey et al, 2000a, 2000b). Following treatment of β-cells with adenovirus expressing either PTEN or G129E PTEN, leptin did not alter the resting membrane potential, with values of −36.0±4.0 mV (n=5) and −39.7±3.0 mV (n=7) in the absence, and −35.4±6.2 and −38.6±2.8 mV in the presence, of leptin, respectively (P<0.05 for both). These β-cells were responsive to the directly acting KATP activator, diazoxide (200 μM; Figure 5D and E), with subsequent inhibition by tolbutamide (not shown). In contrast, infection of β-cells with C124S PTEN resulted in cells with a stable hyperpolarized membrane potential of −69.2±4.2 mV (n=5; P<0.05 compared to control) in the absence of leptin, and which were depolarized by tolbutamide (−31.6±4.2 mV; P<0.05), indicating that active KATP channels were driving the hyperpolarized potential (Figure 5F).
Figure 5.
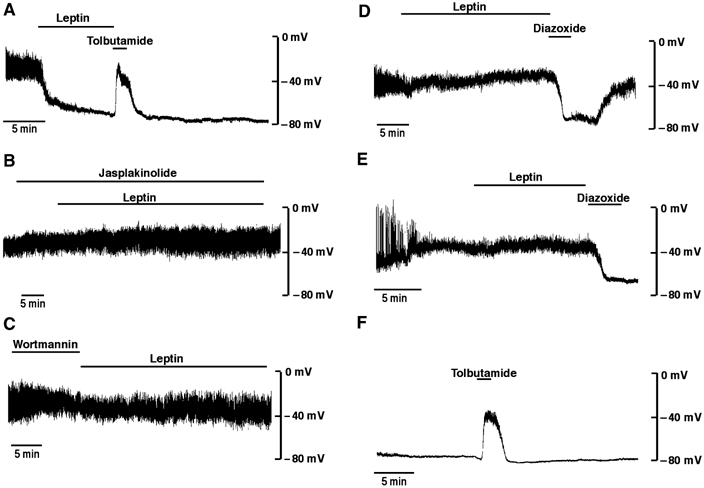
Leptin activation of KATP channels is dependent on PI3K activity, actin re-arrangement and PTEN phosphatase activity. (A) Representative whole-cell current clamp recording from a mouse cultured pancreatic β-cell dialysed with an electrode solution containing 3 mM ATP. In this and subsequent panels, the trace begins approximately 2 min after obtaining the recording configuration. Leptin (10 nM) was applied for the time indicated on each trace (A–E). The action of leptin on β-cell membrane potential was determined in the presence of (A) 100 μM tolbutamide, (B) 100 nM jasplakinolide and (C) 100 nM wortmannin. Following infection of β-cells with PTEN (D) or G129EPTEN (E), the actions of 10 nM leptin and 200 μM diazoxide were determined. (F) Infection of β-cells with C124SPTEN in the absence of leptin, and with short application of 100 μM tolbutamide.
Discussion
Leptin inhibition of food intake is dependent upon PI3K activity in the hypothalamus (Niswender et al, 2001; Zhao et al, 2002). At the cellular level, leptin inhibits certain hypothalamic neurons and pancreatic β-cells by hyperpolarization via activation of KATP channels (Harvey et al, 1997; Keiffer et al, 1997; Spanswick et al, 1997). The leptin mediated increase of KATP activity in hypothalamic neurons and pancreatic β-cells is PI3K-dependent and requires cortical actin filament re-structuring (Harvey et al, 2000a, 2000b; Mirshamsi et al, 2004). Our results demonstrate that for leptin to reduce F-actin in hypothalamic cells and to hyperpolarize pancreatic β-cells by activation of KATP channels, two signalling events must take place concurrently. We propose that leptin inhibits PTEN lipid and protein phosphatase activity, which in conjunction with increased PtdIns(3,4,5)P3 levels results in F-actin depletion and KATP activation. Some previous studies have shown that leptin can increase PI3K activity in the hypothalamus (Niswender et al, 2001; Zhao et al, 2002), indicating hormonal control of the enzyme as a source of increased PtdIns(3,4,5)P3. However, we can find no evidence that leptin stimulates PI3K either by PI3K assay in N29/4 cells or by direct PtdIns(3,4,5)P3 assay in LRbU87 cells. Instead, our data suggest that leptin inhibits PTEN phosphatase activity to raise PtsIns(3,4,5)P3 levels, as normal cells exhibit a low steady-state activity of PI3K. Evidence to support this derives from the ability of the PTEN lipid and protein phosphatase null mutant, C124S PTEN to mimic the effects of leptin on F-actin levels in hypothalamic cells and on the membrane potential of pancreatic β-cells. In addition, direct assay demonstrated that leptin treatment significantly reduced the lipid phosphatase activity of PTEN. Thus, the simplest model is one in which leptin increases PTEN phosphorylation, inhibiting both its lipid and protein phosphatase activities, resulting in altered functional output, in this case F-actin depolymerization and KATP opening, in the presence of active PI3K. This hypothesis is supported by the PTEN phosphorylation mutant data, where tri-aspartate substituted PTEN and G129E PTEN directly reduced F-actin in a PI3K dependent manner, whereas the tri-alanine substituted G129E PTEN had no effect on F-actin, in the face of increased PtdIns(3,4,5)P3. This is the first clear example of regulated phosphorylation of PTEN being linked with an important biological function and indicates that endogenous PTEN has two separable mechanisms by which it mediates the effects of leptin on F-actin. The identity of the protein kinase (or protein phosphatase), sensitive to leptin receptor activation, which results in PTEN phosphorylation is presently unclear, although CK2 appears to play a role. However, it is unlikely that PTEN phosphorylation involves a PI3K dependent kinase or a PI3K-inhibited phosphatase, as PI3K inhibitors had no effect on leptin mediated p-PTEN levels.
Not all of the actions of PTEN are due to its lipid phosphatase activity, and thus regulation of PtdIns(3,4,5)P3 dependent signalling. The PTEN mutant, G129E, which demonstrates a selective loss of inositide phosphatase activity also inhibits cell motility (Tamura et al, 1998; Rafatopolou et al, 2004) in PTEN null glioblastoma cells. This inhibition of cell migration could be replicated by the C2 domain of PTEN and required PTEN protein phosphatase activity apparently through auto-dephosphorylation of the inhibitory C-terminal phosphorylation sites, notably T383 (Rafatopolou et al, 2004). It is unlikely that this component of PTEN regulatory function contributes to the leptin signalling process observed here as the C2 domain of PTEN, with or without the C-terminal phosphorylation sites and the PDZ binding motif, does not prevent leptin from inducing cytoskeletal rearrangement. Moreover, leptin increases PTEN phosphorylation in the C-terminal domain in hypothalamic cells, consistent with the observed lipid phosphatase inhibition and which would be expected to inactivate any biological activity of the C2 domain. Thus, we can find no evidence that the C2 domain of PTEN plays any role in the transmission of the leptin signal associated with cell plasma membrane F-actin dynamics, and hence control of KATP activity.
In contrast, the PDZ binding motif of PTEN is clearly required to enable PTEN to function correctly with respect to leptin signalling in hypothalamic cells. The ΔPDZ PTEN mutant, which retains catalytic activity in vitro and regulates PKB and PtdIns(3,4,5)P3 levels (Leslie et al, 2001), was not an effective inhibitor of leptin action on F-actin levels in the hypothalamic cells, in contrast to the inhibitory action of overexpressed PTEN. Similarly, the G129EΔPDZ PTEN mutant did not mimic the inhibitory effect of the full-length mutant on leptin regulation of F-actin, although N-terminal myristoylation recovered this action. Our results indicate that the effectiveness of PTEN overexpression and the dominant-negative action of the G129E mutation on leptin-mediated F-actin de-polymerization are only displayed if the protein is targeted to the plasma membrane either via myristoylation or its PDZ binding motif. Therefore, we suggest that the leptin signalling complex, controlling actin structure and KATP channel activity, is only accessible to modification by PTEN if the latter protein is directed to the plasma membrane. Thus, PTEN is likely targeted to a signalling protein complex at the plasma membrane by interaction with PDZ domain containing proteins, and for overexpression of PTEN and G129E PTEN to induce inhibition of the leptin output, there must be unoccupied PDZ domain binding sites at the plasma membrane in the hypothalamic cells and in pancreatic β-cells. The phosphorylation of PTEN may also contribute to its functional localization, as it has been reported that C-terminal tail phosphorylation inhibits its recruitment into PDZ domain scaffolds (Vasquez et al, 2001). Previous studies on the inhibition of cell spreading and membrane ruffling have also demonstrated that PDZ targeting of PTEN is required for functional outputs (Leslie et al, 2001). Thus, the requirement for a plasma membrane targeting sequence indicates that movement of PTEN from the membrane by leptin-receptor mediated phosphorylation could account for its effects on leptin signalling. However, the downstream substrate target for PTEN protein phosphatase in this pathway is unknown at present.
Insulin, although stimulating PI3K, had no effect on PTEN phosphorylation or F-actin status in hypothalamic cells or on pancreatic β-cell membrane potential. As insulin receptor stimulation increases PtdIns(3,4,5)P3 in hypothalamic cells and in insulin-secreting cells (Harvey et al, 2000a), these data indicate that the generation of dual signals and coincidence detection are required to induce the leptin-driven outputs described here. Thus, although leptin and insulin are capable of increasing PtdIns(3,4,5)P3 in cells, differential outputs are possible, if leptin and not insulin is capable of inhibiting PTEN activity. Indeed, leptin depolarizes and insulin hyperpolarizes POMC neurons (Cowley et al, 2001; Choudhury et al, 2005), and RIPCre neurons are depolarized by insulin, but appear insensitive to leptin (Choudhury et al, 2005) despite expressing leptin receptors (Cui et al, 2004).
In conclusion, we have demonstrated that although leptin, like insulin, acts to increase levels of PtdIns(3,4,5)P3 in cells, the mechanism by which they do so differs. Leptin does not increase PI3K activity, but inhibits the lipid and protein phosphatase activity of PTEN, the former action resulting in increased levels of PtdIns(3,4,5)P3 in the presence of active PI3K. Reduction in F-actin in hypothalamic cells and consequent opening of KATP channels in pancreatic β-cells by leptin relies upon increased PtdIns(3,4,5)P3 and inhibition of PTEN protein phosphatase activity. It will be important to determine whether leptin mediated control of PTEN activity is a factor in the development of leptin resistance and the obese state in animals and humans.
Materials and methods
Cell culture, staining and actin analysis
The mouse hypothalamic cell lines, GT1–7 and N29/4 and the glioblastoma PTEN null U87MG cell line, were grown as described previously (Mirshamsi et al, 2004). Leptin receptor stable U87MG (LRbU87) cells were made by Lipofectamine (Invitrogen) transfection of the full-length human receptor (LRb) in pcDNA3 into U87MG cells. Cells were treated with LY294002, wortmannin or jasplakinolide (all Sigma) in normal saline (in mM) 135 NaCl, 5 KCl, 1 MgCl2, 1 CaCl2, 10 HEPES and 0.2% BSA (pH 7.4) for 10 min, prior to challenge with leptin, insulin or saline, in the continuous presence of inhibitor, for 5–60 min before fixing as described (Mirshamsi et al, 2004). Cells were washed in phosphate-buffered saline (PBS), permeabilized in PBS/0.5% Triton X-100 for 10 min, rinsed, blocked with 20% goat serum (Sigma) and incubated with rhodamine conjugated phalloidin, or 2 μg ml−1 Alexa 594-DNaseI or 2U ml−1 Alexa 488-phalloidin (all Molecular Probes) for 90–120 min and mounted on coverslips. Immunocytochemical staining was performed as described previously (Mirshamsi et al, 2004), using a monoclonal antibody against PTEN (Chemicon) or PtdIns(3,4,5)P3 (Molecular Probes). The secondary antibodies were Cy3 or FITC-conjugated anti-mouse IgG (Jackson ImmunoResearch). Fluorescence-labelled proteins or lipids in cells were observed with a × 63 oil objective and images acquired by confocal microscopy (Zeiss LSM 510). For quantitative analysis of F-actin and PtdIns(3,4,5)P3 levels, Aida/2D densitometry was used to measure pixel intensity of defined areas of transfected, treated and control cells. After subtraction of background, intensity values for treated cells were expressed as a ratio of control cell intensity.
Western blotting
GT1–7 and N29/4 cells, grown in six-well plates, were exposed to leptin, insulin or saline in the presence and absence of wortmannin, LY294002 or jasplakinolide for the required time (inhibitors added 20 min prior to challenge). Protein isolation, and content, immunoblotting and analysis procedures were as described (Mirshamsi et al, 2004). PTEN and phospho- (Ser-380/Thr-382/Thr-383) PTEN (p-PTEN) antibodies, used at 1:1000, were obtained from Abcam and Cell Signalling, respectively. Protein bands on gels were quantified by densitometry, where total density was determined with respect to constant area, background subtracted and average relative band density calculated.
PTEN siRNA expression vectors
Expression vectors that direct the synthesis of siRNAs corresponding to nucleotides 235–253 of PTEN mRNA or a scrambled PTEN target sequence, coupled to GFP, were used for immunocytochemistry as described (Ning et al, 2004). N29/4 cells were plated in six-well plates at 40% confluence 24 h before transfection. In total, 8 μl of Trans Pass R1 siRNA transfection reagent (NEB#2551S, New England Biolab) was mixed with 100 μl serum-free OPTI-medium, and incubated at room temperature for 15 min, 2 μl of siRNA mix was added, mixed gently, incubated for 20 min at room temperature to form the transfection complexes and diluted with 500 μl of culture medium. The mixture was applied to the cells, the plates returned to the incubator, left overnight and then replaced with culture medium and incubated for 48 h before assaying target gene inhibition.
PTEN mutants and adenoviral constructs
In experiments, where mutant GFP-PTEN constructs were expressed, F-actin or PtdIns(3,4,5)P3 levels were determined from 54 and 48 cells, respectively, from a total of four experiments (comparing transfected cells, as determined by GFP expression or PTEN antibody staining, with control cells). For adenoviral constructs, PTEN, G129E PTEN and C124S PTEN were cloned into pShuttle-CMV vector. Linearized DNA was treated with alkaline phosphatase for 30 min at 37°C and purified using agarose gel electrophoresis. Linearized DNA was transformed into BJ5183-AD-1 cells by electroporation and incubated at 37°C for 1 h while shaking at 250 r.p.m. The recovered cells were plated on LB-kanamycin agar plates and colonies picked into 3 ml LB-kanamycin broth and incubated overnight at 37°C. Miniprep DNA was prepared, 10 μl cut with Pac I and run on a 0.8% agarose TAE gel, yielding fragments of 30 and 4.5 kb. The 30 kb fragment was transformed into XL 10-Gold Ultracompetent cells for amplifying recombinant Ad plasmids. AD-293 cells were prepared (8 × 10⁵ cells per 60-mm tissue culture dish) 24 h prior to transfection. Linearized Ad plasmids were transfected into AD-293 cells by CaCl2 precipitation and supernatants collected after 3–5 days. Amplification of virus stocks was achieved by infection of AD-293 cultures with a low passage virus stock. The virus was stored at −20°C for immediate use or at −80°C. For infection experiments, the same amounts of virus were added to cells in culture medium for 3–5 h and replaced by medium for 48–72 h for protein measurements or assays. The same titers of β-Gal virus infections were used as controls.
Determination of cellular PtdIns(3,4,5)P3 levels
PTEN null LRbU87 glioblastoma cells grown in six-well plates in culture medium lacking unlabelled inositol were incubated for 48 h with 10 μCi/ml [3H]inositol. For the final 24 h cells were infected with baculoviruses encoding either PTEN or GFP. PtdIns(3,4,5)P3 levels in these cells were determined as previously described (Batty and Downes, 1996) by deacylation, HPLC analysis and scintillation counting.
Determination of PI3K activity
Cell lysates were made as described above and following immunoprecipitation, PI3K activity was determined. Briefly, frozen samples were thawed before centrifugation to remove precipitated material. In total, 10 μl Protein-G-Sepharose beads pre-coupled to 3 μg anti-IRS2 antibody, anti-IRS1 or anti-phosphotyrosine antibody (Upstate Biotechnology) were used to immunoprecipitate PI3K activity from ∼0.5 mg cell lysate. Immunoprecipitated material was washed with ice cold lysis buffer and three times with ice cold assay buffer, which were freshly supplemented with protease inhibitors, reducing agent and sodium vanadate. Washed beads were re-suspended in 40 μl assay buffer supplemented with 1 μM unlabelled ATP, 25 μCi/assay radiolabelled ATP and phosphatidylinositol/phosphatidylethanolamine vesicles (final concentration of each lipid 100 μM). Samples were incubated at 37°C for 30 min, and the reaction stopped by addition of 0.6 ml methanol/chloroform/12 M HCl (80:40:1, v/v), 0.2 ml chloroform and 0.32 ml 0.1 M HCl. Samples were processed and PtdIns(3)P separated from contaminating materials by thin layer chromatography (TLC). Bands corresponding to [32P]PtdIns(3)P were located using a phosphorimager (Fuji FLA 5000) and analysed with AIDA software.
Mouse pancreatic β-cell isolation and culture
Pancreatic islets were isolated from Swiss mice under sterile conditions. Cannulation of the bile duct allowed inflation of the pancreas with 1.5–2 ml Liberase RI (2.5 mg ml−1). The pancreas was removed and shaken vigorously at 37°C for 10 s in 10 ml quenching buffer (HBSS with 10% fetal calf serum and 1% penicillin/streptomycin). Digestion was terminated by addition of ice-cold quenching buffer, and the suspension centrifuged at 1000 r.p.m. for 1 min to remove the Liberase. Islets were purified from the majority of exocrine cells using a sucrose gradient and purified further by individual ‘picking' in HBSS solution containing 25 mM HEPES. Following transfer into Ca- and Mg-free HBSS (with 25 mM HEPES, 1% penicillin/streptomycin), islets were triturated to produce single cells. Cells were plated onto poly-L-lysine coated coverslips and cultured in DMEM (with 10% FCS and 1% penicillin/streptomycin) at 37°C for up to 10 days.
Electrophysiology
Mouse cultured β-cells were super-fused at room temperature (22–25°C) with normal saline. Whole-cell current-clamp recordings were used to monitor membrane potential using an Axopatch 200B amplifier. Current clamp data were recorded and stored onto digital audio tapes and replayed for analysis and illustration on a Gould TA 240 chart recorder. Recording electrodes were pulled from borosilicate glass and had resistances of 5–10 MΩ when filled with pipette solution, which comprised (mM) 140 KCl, 5 MgCl2, 8.7 CaCl2, 3 Mg-ATP, 10 EGTA, 10 HEPES, pH 7.2 (free [Ca2+] of 1 μM). Application of drugs was made via the bath perfusion system.
Statistical analysis
Data are presented as means±s.e.m., unless otherwise stated. All statistical analyses were performed using ANOVA, Student's paired or unpaired t-tests. P<0.05 was considered significant.
Supplementary Material
Supplemental Methods
Supplementary Table 1
Supplementary Figure S1
Supplementary Figure S2
Supplementary Figure S3
Supplementary Figure S4
Acknowledgments
This work was supported by Wellcome Trust grant 068692 (to MLJA), Tenovus Scotland, Medical Research Council Grant 49403619 (to CPD) and a Biotechnology and Biological Sciences Research Council Studentship (LCM).
References
- Bajari TM, Nimpf J, Schneider WJ (2004) Role of leptin in reproduction. Curr Opin Lipidol 15: 315–319 [DOI] [PubMed] [Google Scholar]
- Bates SH, Myers MG (2003) The role of leptin receptor signalling in feeding and neuroendocrine function. Trends Endocrinol Metab 14: 447–452 [DOI] [PubMed] [Google Scholar]
- Batty IH, Downes CP (1996) Thrombin receptors modulate insulin-stimulated phosphatidylinositol 3,4,5-trisphosphate accumulation in 1321N1 astrocytoma cells. Biochem J 317: 347–351 [DOI] [PMC free article] [PubMed] [Google Scholar]
- Belsham DD, Cai F, Cui H, Smukler SR, Salapatek AF, Shkreta L (2004) Generation of a phenotypic array of hypothalamic neuronal cell models to study complex neuroendocrine disorders. Endocrinology 145: 393–400 [DOI] [PubMed] [Google Scholar]
- Cowley MA, Smart JL, Rubinstein M, Cerdán MG, Diano S, Horvath TL, Cone RD, Low MJ (2001) Leptin activates anorexigenic POMC neurons through a neural network in the arcuate nucleus. Nature 411: 480–484 [DOI] [PubMed] [Google Scholar]
- Choudhury AI, Heffron H, Smith MA, Al-Qassab H, Xu AW, Selman C, Simmgen M, Clements M, Claret M, MacColl G, Bedford DC, Hisadome K, Diakonov I, Moosajee V, Bell JD, Speakman JR, Batterham RL, Barsh GS, Ashford MLJ, Withers DJ (2005) The role of insulin receptor substrate 2 in hypothalamic and β cell function. J Clin Invest 115: 940–950 [DOI] [PMC free article] [PubMed] [Google Scholar]
- Cui Y, Huang L, Elefteriou F, Yang G, Shelton JM, Giles JE, Oz OK, Pourbahrami T, Lu CYH, Richardson JA, Karsenty G, Li C (2004) Essential role of STAT3 in body weight and glucose homeostasis. Mol Cell Biol 24: 258–269 [DOI] [PMC free article] [PubMed] [Google Scholar]
- Das S, Dixon JE, Cho W (2003) Membrane binding and activation mechanisms of PTEN. Proc Natl Acad Sci USA 100: 7491–7496 [DOI] [PMC free article] [PubMed] [Google Scholar]
- Furnari FB, Huang HJ, Cavenee WK (1998) The phosphoinositol phosphatase activity of PTEN mediates a serum-sensitive G1 growth arrest in glioma cells. Cancer Res 58: 5002–5008 [PubMed] [Google Scholar]
- Harvey J, Hardy SC, Irving AI, Ashford MLJ (2000b) Leptin activation of ATP-sensitive K+ (KATP) channels in rat CRI-G1 insulinoma cells involves disruption of the actin cytoskeleton. J Physiol 527: 95–107 [DOI] [PMC free article] [PubMed] [Google Scholar]
- Harvey J, McKay NG, Walker KS, Van der Kaay J, Downes CP, Ashford MLJ (2000a) Essential role of phosphoinositide 3-kinase in leptin-induced KATP channel activity in the rat CRI-G1 insulinoma cell line. J Biol Chem 275: 4660–4669 [DOI] [PubMed] [Google Scholar]
- Harvey J, McKenna F, Herson PS, Spanswick D, Ashford MLJ (1997) Leptin activates ATP-sensitive potassium channels in the rat insulin-secreting cell line, CRI-G1. J Physiol 504: 527–535 [DOI] [PMC free article] [PubMed] [Google Scholar]
- Keiffer TJ, Heller RS, Leech CA, Holz GG, Habener JF (1997) Leptin suppression of insulin secretion by the activation of ATP-sensitive K+ channels in pancreatic beta-cells. Diabetes 46: 1087–1093 [DOI] [PMC free article] [PubMed] [Google Scholar]
- Leslie NR, Bennett D, Gray A, Pass I, Hoang-Xuan K, Downes CP (2001) Targeting mutants of PTEN reveal distinct subsets of tumour suppressor functions. Biochem J 357: 427–435 [DOI] [PMC free article] [PubMed] [Google Scholar]
- Leslie NR, Downes CP (2004) PTEN function: how normal cells control it and tumour cells lose it. Biochem J 382: 1–11 [DOI] [PMC free article] [PubMed] [Google Scholar]
- Leslie NR, Gray A, Pass I, Orchiston EA, Downes CP (2000) Analysis of the cellular functions of PTEN using catalytic domain and C-terminal mutations: differential effects of C-terminal deletion on signalling pathways downstream of phosphoinositide 3-kinase. Biochem J 346: 827–833 [PMC free article] [PubMed] [Google Scholar]
- Matarese G, Moschos S, Mantzoros CS (2005) Leptin in immunology. J Immunol 173: 3137–3142 [DOI] [PubMed] [Google Scholar]
- Miller SJ, Lou DY, Seldin DC, Lane WS, Neel BG (2002) Direct identification of PTEN phosphorylation sites. Febs Lett 528: 145–153 [DOI] [PubMed] [Google Scholar]
- Mirshamsi S, Laidlaw HA, Ning K, Anderson E, Burgess LA, Gray A, Sutherland C, Ashford MLJ (2004) Leptin and insulin stimulation of signalling pathways in arcuate nucleus neurones: PI 3-kinase dependent actin reorganization and KATP channel activation. BMC Neurosci 5: 54. [DOI] [PMC free article] [PubMed] [Google Scholar]
- Myers MP, Pass I, Batty IH, Van der Kaay J, Stolarov JP, Hemmings BA, Wigler MH, Downes CP, Tonks NK (1998) The lipid phosphatase activity of PTEN is critical for its tumor suppressor function. Proc Natl Acad Sci USA 95: 13513–13518 [DOI] [PMC free article] [PubMed] [Google Scholar]
- Ning K, Pei L, Liao M, Liu B, Zhang Y, Jiang W, Mielke JG, Li L, Chen Y, El-Hayek YH, Fehlings MG, Zhang X, Liu F, Eubanks J, Wan Q (2004) Dual neuroprotective signalling mediated by downregulating two distinct phosphatase activities of PTEN. J Neurosci 24: 4052–4060 [DOI] [PMC free article] [PubMed] [Google Scholar]
- Niswender KD, Baskin DG, Schwartz MW (2004) Insulin and its evolving partnership with leptin in the hypothalamic control of energy homeostasis. Trends Endocrinol Metab 15: 362–369 [DOI] [PubMed] [Google Scholar]
- Niswender KD, Morton GJ, Stearns WH, Rhodes CJ, Myers MG Jr, Schwartz MW (2001) Intracellular signaling. Key enzyme in leptin-induced anorexia. Nature 413: 794–795 [DOI] [PubMed] [Google Scholar]
- Niswender KD, Morrison CD, Clegg DJ, Olson R, Baskin DG, Myers MG Jr, Seeley RJ, Schwartz MW (2003) Insulin activation of phosphatidylinositol 3-kinase in the hypothalamic arcuate nucleus: a key mediator of insulin-induced anorexia. Diabetes 52: 227–231 [DOI] [PubMed] [Google Scholar]
- Niswender KD, Schwartz MW (2003) Insulin and leptin revisited: adiposity signals with overlapping physiological and intracellular signalling capabilities. Front Neuroendocrinol 24: 1–10 [DOI] [PubMed] [Google Scholar]
- Pagano MA, Meggio F, Ruzzene M, Andrzejewska M, Kazimierczuk Z, Pinna LA (2004) 2-dimethylamino-4,5,6,7-tetrabromo-1H-benzimidazole: a novel powerful and selective inhibitor of protein kinase CK2. Biochem Biophys Res Commun 321: 1040–1044 [DOI] [PubMed] [Google Scholar]
- Rafatopolou M, Etienne-Manneville S, Self A, Nicholls S, Hall A (2004) Regulation of cell migration by the C2 domain of the tumor suppressor PTEN. Science 303: 1179–1181 [DOI] [PubMed] [Google Scholar]
- Sahu A (2004) Leptin signalling in the hypothalamus: emphasis on energy homeostasis and leptin resistance. Front Neuroendocrinol 24: 225–253 [DOI] [PubMed] [Google Scholar]
- Schwartz MW, Woods SC, Porte D Jr, Seeley RJ, Baskin DG (2000) Central nervous system control of food intake. Nature 404: 661–671 [DOI] [PubMed] [Google Scholar]
- Spanswick D, Smith MA, Groppi VE, Logan SD, Ashford MLJ (1997) Leptin inhibits hypothalamic neurons by activation of ATP-sensitive potassium channels. Nature 390: 521–525 [DOI] [PubMed] [Google Scholar]
- Spanswick D, Smith MA, Mirshamsi S, Routh VH, Ashford MLJ (2000) Insulin activates ATP-sensitive K+ channels in hypothalamic neurons of lean, but not obese rats. Nat Neurosci 3: 757–758 [DOI] [PubMed] [Google Scholar]
- Tamura M, Gu J, Matsumoto K, Aota S, Parsons R, Yamada KM (1998) Inhibition of cell migration, spreading, and focal adhesions by tumor suppressor PTEN. Science 280: 1614–1617 [DOI] [PubMed] [Google Scholar]
- Torres J, Pulido R (2001) The tumor suppressor PTEN is phosphorylated by the protein kinase CK2 at its C terminus. Implications for PTEN stability to proteosome-mediated degradation. J Biol Chem 276: 993–998 [DOI] [PubMed] [Google Scholar]
- Van Den Top M, Lee K, Whyment AD, Blanks AM, Spanswick D (2004) Orexigen-sensitive NPY/AgRP pacemaker neuons in the hypothalamic arcuate nucleus. Nat Neurosci 7: 493–494 [DOI] [PubMed] [Google Scholar]
- Vasquez F, Grossman SR, Takahashi Y, Rokas MV, Nakamura N, Sellars WR (2001) Phosphorylation of the PTEN tail acts as an inhibitory switch by preventing its recruitment into a protein complex. J Biol Chem 276: 48627–48630 [DOI] [PubMed] [Google Scholar]
- Xu AW, Kaelin CB, Takeda K, Akira S, Schwartz MW, Barsh GS (2005) PI 3-kinase integrates the action of insulin and leptin on hypothalamic neurons. J Clin Invest 115: 951–958 [DOI] [PMC free article] [PubMed] [Google Scholar]
- Zhao AZ, Huan JN, Gupta S, Pal R, Sahu A (2002) A phosphatidylinositol 3-kinase phosphodiesterase 3B-cyclic AMP pathway in hypothalamic action of leptin on feeding. Nat Neurosci 5: 727–728 [DOI] [PubMed] [Google Scholar]
Associated Data
This section collects any data citations, data availability statements, or supplementary materials included in this article.
Supplementary Materials
Supplemental Methods
Supplementary Table 1
Supplementary Figure S1
Supplementary Figure S2
Supplementary Figure S3
Supplementary Figure S4