INTRODUCTION
The recent development of techniques for visualizing structures and processes in the living cell has paved the way for studies of the functional organization of the cell nucleus in vivo. Live cell studies generate complex data, which require computational approaches for time-resolved analysis and visual interpretation of dynamic processes (Marshall et al., 1997; Misteli and Spector, 1997). Here we review recently developed concepts for quantification and visual display of time- and space-resolved processes, in particular the dynamics of pre-mRNA splicing factors in the nucleus of mammalian cells.
Until recently, most studies on nuclear architecture were carried out in fixed cells (for a comprehensive review, see Lamond and Earnshaw, 1998). In situ hybridization methods have revealed that chromosomes occupy distinct territories, whereby actively transcribing genes are preferentially positioned at their periphery (Eils et al., 1996; Kurz et al., 1996). The machinery for pre-mRNA processing is localized in a distinct pattern of 20–40 nuclear speckles, which typically do not coincide with sites of active splicing (Spector, 1993). Hence, the highest concentration of pre-mRNA splicing factors is found at sites where no or very little splicing seems to occur. The mechanisms of how transcription and pre-mRNA splicing are coordinated in space and time in vivo are poorly characterized. Even less is known about the mechanisms and forces involved in the assembly and dynamics of functional subnuclear compartments in response to metabolic requirements. To analyze how the various steps of gene expression are related to the structure of the nucleus, it is crucial to reveal the spatial and temporal interplay of transcription, pre-mRNA splicing and 3′ processing.
Live cell analysis using fusion proteins of the green fluorescent protein (GFP) linked to splicing factors has recently shown that nuclear speckles are highly dynamic (Misteli et al., 1997). Movements and morphological alterations of nuclear speckles under various experimental conditions have been investigated by visual inspection. It has been observed that dynamics of nuclear speckles depend on RNA polymerase II activity, because inhibition of RNA polymerase II by drugs such as α-amanitin clearly reduces dynamics. High structural dynamics are often correlated with the budding of small structures from speckles. These budding structures might be interpreted as splicing factor aggregates transported to sites of transcribed genes. Experiments with triggered transcriptional gene activation have provided clues that transcriptional activation leads to subnuclear redistribution of splicing factors. This supports a model of nuclear speckles as transient storage and/or assembly sites for pre-mRNA splicing factors that are delivered to sites of active transcription (Misteli et al., 1998; Misteli and Spector, 1998). The targeting mechanism from storage and/or assembly sites to the actual site of transcription involves the serine phosphorylation of SR protein splicing factors and subsequent binding to the C-terminal domain of the large subunit of RNA polymerase II (Misteli and Spector, 1999).
These studies were based on purely qualitative studies of time-lapse movies in living cells. Such an evaluation is very time consuming and also limited by the perception of the manual inspector. Because the total light exposure during in vivo observation must be minimized to avoid disruptions of nuclear processes, the signal-to-noise ratio and more importantly the number of sequential images taken in a particular experiment is considerably reduced, leading to a loss in spatiotemporal resolution.
Displaying time series as movies is a widely used method for visual interpretation. However, this approach does not improve temporal resolution, because additional information about the continuous development of the processes between imaged time steps is not obtained. More importantly, quantitative information is not revealed by such a visual approach. A quantitative analysis requires the isolation and tracking of fluorescent structures in the time series. In many studies in fixed cells fully automated isolation of fluorescent structures was achieved by background subtraction followed by thresholding. In live cell studies with typically low signal-to-noise-ratio an approach based on gray value maxima only often fails. We recently developed a fully automated system for time-resolved analysis of dynamic processes in living cells (Tvaruskóet al., 1999), which is based on the assumption that structures of interest can be characterized by regions of locally homogeneous gray value distribution rather than by absolutely maximal intensity. By image reconstruction in time and space, it has been shown that it is possible to partially regain both temporal and spatial resolution.
Here we discuss a recently developed quantitative approach to the study of the dynamics of pre-mRNA splicing factors in living cells. This approach is widely applicable and will be generally useful in the analysis of biological time-lapse microscopy data.
RESULTS
Live Cell Imaging of Nuclear Speckles
GFP was fused in-frame to the amino terminus of the essential splicing factor 2/alternative splicing factor (SF2/ASF) and was visualized by in vivo time-lapse microscopy in baby hamster kidney cells as previously described (Misteli et al., 1997). Transfected cells were observed on the microscope stage in an FCS2 live cell microscopy chamber (Bioptechs, Butler, PA). Image series were acquired with a Photometrics (Tucson, AZ) Nu200 cooled charge-coupled device camera using Oncor Image 2.0.5 software (Oncor, Gaithersburg, MD).
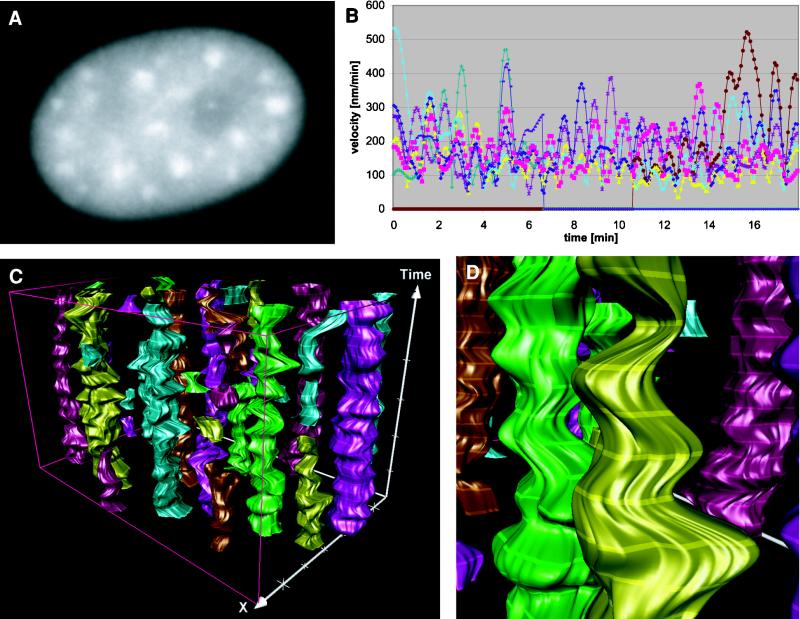
For image sequence analysis, we used a highly sensitive image analysis system for time-resolved analysis of dynamic processes (Tvaruskóet al., 1999). This system comprises three modules, namely object detection, object tracking over time, and time–space visualization of tracked objects. For detection of speckles at each time step an edge-oriented approach was used to trace object outlines based on a concept of local orientation and gradient (Figure 1, A and B). The time information comes into play in the second module, in which segmented nuclear speckles are tracked in time and space with a fuzzy logic–based system (Qian et al., 1991; Nauck et al., 1997). This approach allows combination of object features such as size, shape, total intensity, and texture with dynamic image information such as direction and velocity of movement in a “fuzzy” way to find the best match for each object in consecutive images. The user interface for visual display of the dynamic image analysis result is provided within the third module. A continuous reconstruction of speckles in time and space is obtained by interpolation between consecutive time sections. This time–space surface is rendered online, allowing the user to view the reconstructed speckles from various directions and in various modes. These visualization modes include time–space animation, texturing, and coloring of speckles (Figure 1C).
Figure 1.
Automated analysis and time–space reconstruction of image sequences from dynamic processes in live cells. (A) Single frame from a live cell video sequence of GFP-labeled SF2/ASF shows diffuse nuclear distribution and speckle structures. (B) Speckles detected by contour-based segmentation algorithms are displayed by color outlines. (C) Continuous shape reconstruction in time and space. Time is represented by the third spatial coordinate. Speckle outlines at 24 distinct time frames are displayed as highlighted rings. For visualization purposes, time–space-reconstructed speckles are displayed in different false colors.
Notably, the visualization module is not restricted to a pure display of data but also allows the computation of dynamic parameters such as path length, velocity, acceleration, mean squared distances, and diffusion coefficients in a fully automated way. An interface to standard statistic software facilitates further evaluation and display of parameters. Here, mean surface velocities and accelerations were used to describe the dynamics of speckles. These mean parameters are obtained by averaging the respective values for all points on the object outline. These three modules for automated time–space reconstruction and visualization as well as quantitative analysis are integrated into the TILL visTRAC system (TILL Photonics, Eugene, OR).
Quantification and Visualization of Surface Dynamics of Nuclear Speckles
Dynamic image series from in vivo time-lapse microscopy of GFP-SF2/ASF–labeled nuclear speckles were analyzed in transcriptionally active cells. Nuclear speckles were segmented in single time sections using the highly sensitive object detection module (Video 1). In two nuclei with a particularly high degree of background noise, an automated partitioning of the images into homogeneous regions was followed by computer-assisted interactive selection of speckles as clusters of neighboring regions. Continuous surface representations of speckles in time and space were computed after dynamic tracking of speckles as described above. Transitional movement of the whole nucleus was eliminated by image segmentation of the whole nucleus and alignment of the image stack according to the gravity center of the nucleus. In addition, rotational movement was corrected for by aligning the axes of inertia for segmented nuclei in consecutive images.
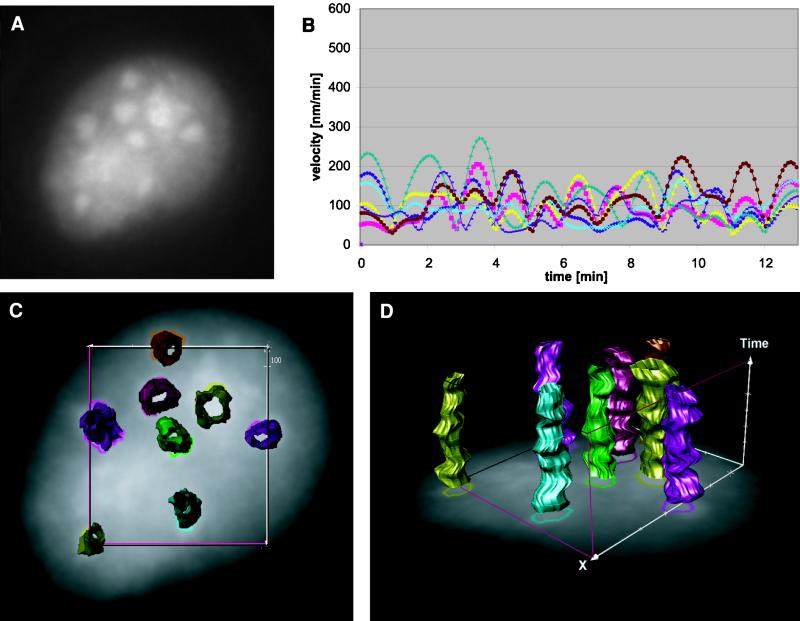
Based on contours from segmented individual speckles at distinct time sections, a continuous time–space reconstruction was computed. The reconstruction shows that speckles are highly dynamic structures (Figure 2, C and D, and Video 2). The morphology of single speckle outlines dynamically changes between consecutive time sections. Surface dynamics were calculated from corresponding boundary points of speckle outlines from adjacent time sections. The surface dynamics of a speckle was defined as the average velocity or acceleration, respectively, of all boundary points in all time steps. The surface velocities for six representative speckles shown in Figure 2B indicate a high surface dynamics with an average of 235 nm/min.
Figure 2.
Quantification and visualization of surface dynamics for speckles in transcriptionally active cells. (A) A single frame from the video sequence (Video 1) shows highly variable morphology of nuclear speckles. (B) Quantification of surface velocities. For display reasons velocities for eight representative of a total of 45 speckles for this cell are shown. For each speckle surface velocities are calculated from the average velocity of corresponding boundary points in adjacent time sections. Note that b-spline interpolation, which does not tend to oscillations even for a large number of sample points, was chosen for time-space reconstruction of speckles. (C) Spatiotemporal reconstruction of speckles (Video 2). (D) Detail from C.
Speckle Dynamics in Transcriptionally Inactive Cells
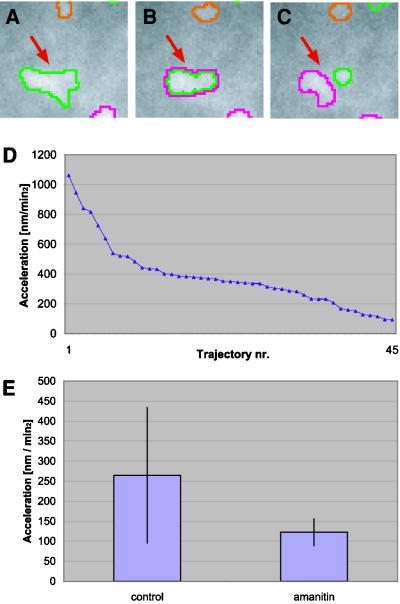
Speckles were imaged after addition of α-amanitin, a specific inhibitor of RNA polymerase II. After minimization of transitional and rotational movement of the whole cell nucleus, speckles were detected as described above (Video 3) followed by continuous time–space reconstruction. Visualization of time–space-reconstructed speckles shows that the morphology of speckles is much more uniform and rounded up (Video 4 and Figure 3, C and D) than of speckles in transcriptionally active cells. Quantification of dynamics revealed a much lower surface velocity of 100 nm/min compared with untreated cells (Figure 3B). A quantitative comparison of 269 speckles in transcriptionally active and 10 speckles in transcriptionally inactive cells showed a more than twofold difference in surface dynamics as reflected by acceleration of corresponding surface points (Figure 4E). These findings represent quantitative evidence consistent with the view that nuclear speckles serve as transient storage and assembly sites for pre-mRNA splicing factors that are delivered to sites of active transcription.
Figure 3.
Quantification and visualization of surface dynamics for speckles in transcriptionally inactive cells. (A) Single frame from an image sequence taken from a cell treated with α-amanitin (Video 3). The speckles appear to be more uniform than in normal cells (compare Figure 2). (B) Surface velocities for a total of eight speckles for this cell are shown. Surface velocities are computed as described in Figure 2B. Note that surface velocities are very much reduced in comparison with normal cells (compare Figure 2B). (C) Projection of time-space reconstruction to the spatial x–y plane (Video 4). (D) Reduced speckle dynamics visualized in continuous time and space.
Figure 4.
Comparison of surface dynamics for speckles in transcriptionally active and inactive cells. Budding of small structures from speckles were only observed in transcriptionally active cells. (A–C) Subregion of the nucleus in three consecutive time frames (Video 5). Note that in C a small structure buds from a larger speckle (arrow). (D) Average surface accelerations calculated for all speckles from an untreated control cell. Surface accelerations are computed as described for velocities in Figure 2B. Note that five of the six speckles with an average surface acceleration >600 nm/min2 correspond to budding events. (E) Comparison of mean accelerations for all speckles in transcriptionally active and inactive cells shows a pronounced larger surface dynamics for transcriptionally active (264 nm/min2) than for inactive cells (122 nm/min2).
Budding Events Are Frequently Observed in Transcriptionally Active but Not in Inactive Cells
During the imaging experiments, small globular structures were frequently seen to bud off from larger speckles. To investigate the role of these buds, the surface dynamics of speckles involved in such budding events was analyzed (Figure 4 and Video 5). Figure 4, A–C, demonstrates that high structural dynamics often correlate with the budding of small structures from speckles. In 25 of 269 speckles budding structures were observed. Notably, the speckles with highest surface dynamics correspond to speckles involved in budding events (Figure 4D). Furthermore, we did not observe any budding structures in transcriptionally inactive cells. These findings support the notation that budding structures correspond to splicing factors being transported to sites of transcription.
Recruitment of Splicing Factors from Nuclear Speckles by Triggered Gene Transcription
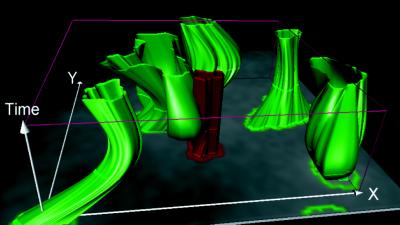
Jimenez-Garcia and Spector had first proposed that speckles might represent nuclear storage and assembly sites from where splicing factors are recruited to active sites of transcription (Jiménez-García and Spector, 1993). This model was confirmed in qualitative time-lapse microscopy experiments, which demonstrated that upon activation of viral genes by cAMP, splicing factors were rapidly recruited from speckles to the site of viral gene transcription. Similar observations have been made in various other experimental systems (Misteli and Spector, unpublished observations). However, these studies could not address the more detailed timing of this recruitment process because of microscopy conditions. To further characterize the kinetics of the recruitment process, BKT-1B cells were transfected with GFP-SF2/ASF. BK virus early gene transcription was triggered by cAMP supplement as previously described (Misteli et al., 1997), followed by time-lapse microscopic imaging. By automated image analysis, outlines of speckles and BK-induced RNA and continuous time–space reconstruction were computed (Figure 5). The highly dynamic restructuring of speckles can be studied with subpixel resolution (Video 6) by interpolating speckle contours in intermediate time steps. The computed exact time of contact between the gene and a neighboring speckle can be readily identified at an intermediate time section. Even though the studies on direct interaction between speckles and transcriptionally triggered genes require a more thorough statistical analysis, it clearly shows the potential of the quantitative imaging approach for motility studies of speckles delivering splicing factors to sites of activated gene transcription.
Figure 5.
Recruitment of splicing factors to sites of activated gene transcription. The time–space reconstruction shows five speckles in the direct neighborhood of the site of triggered transcription (Video 6). Discrete time sections are displayed as highlighted rings. One of the speckles extends toward the BK virus gene and intersects the gene signal. Because of the continuous time–space reconstruction, the time of contact between speckle and gene can be accurately determined at an intermediate time step.
CONCLUSION
The advent of improved microscopy technology and the development of vital stains has led to a dramatic increase in the use of time-lapse microscopy in recent years. Although most investigators apply these methods qualitatively, the richest source of biological information is hidden in the quantitative analysis of multidimensional experimental data. The lack of user-friendly but yet sensitive image analysis software has prevented the routine use of quantitative time-lapse microscopy. The system described here, which is integrated into the TILL visTRAC system, is a flexible system that can be easily adapted for use in a particular biological application. The combination of quantitative time–space analysis with a multidimensional visualization module has been shown to be particularly helpful for the analysis of complex dynamic data as typically obtained in live cell studies.
We have reviewed here the accurate quantitative analysis and visualization of dynamic processes inside the nucleus of living cells. These methods confirm and significantly extend previously described qualitative data (Misteli et al., 1997). These recently developed computational methods underline the importance of spatiotemporal interactions of dynamic subnuclear compartments for efficient gene transcription. Automated tracking of positions of speckles demonstrated that the majority of speckles are stationary within the cell nucleus over time. On the other hand, measurement of the surface velocities of the speckles showed that each speckle is a highly dynamic structure. In fact, statistical analysis of untreated control cells compared with cells in which RNA polymerase II has been inhibited shows that dynamic movements of speckle surfaces is RNA polymerase II activity dependent. In addition, our analysis has correlated the appearance of globular buds from the surface of speckles with speckles of high surface dynamics. Further experimental analysis will have to clarify the significance of this correlation. Finally, our animated time–space reconstruction of speckles in a cell with triggered gene transcription extends and confirms the previously proposed notion that speckles deliver splicing factors to sites of activated gene transcription.
The dynamic image analysis software has been shown to be a reliable tool for a quantitative analysis of complex data obtained from in vivo studies with GFP-labeled nuclear marker proteins. The method can easily be applied to biological analysis of completely different dynamic cellular events. We have successfully applied this system to a wide variety of applications, including the analysis of membrane traffic (Tvaruskóet al. 1999) and GFP-tagged centromeres (Sullivan and Eils, unpublished data), as well as root growth in botanical samples by tracking fluorescently labeled beeds attached to root tips (Schurr and Eils, unpublished data). With this method at hand, it is now possible to study the functional dynamics of living cells at high resolution in time and space.
Supplementary Material
ACKNOWLEDGMENTS
We are particularly grateful to W. Jäger for the continuous support of the bioinformatics group at the Interdisciplinary Center of Scientific Computing (IWR). The bioinformatics group acknowledges the support by the Federal Ministry of Education, Science, Research and Technology (BMBF) through BioFuture grant AZ 11880. Part of this work was performed in collaboration with TILL Photonics. This work was further supported by BMBF grant 01 KW 9621 and Deutsche Forschungsgemeinschaft grant Ja 395/6-2. D.L.S. is supported by National Institute of General Medical Sciences grant 42694; D.G. supported by the Graduiertenkolleg “Neurobiology”; W.T. is supported by the Graduiertenkolleg at the IWR; and T.M. is supported by the Roche research foundation.
Footnotes
REFERENCES
- Eils R, Dietzel S, Bertin E, Schröck E, Speicher MR, Ried T, Robert-Nicoud M, Cremer C, Cremer T. Three-dimensional reconstruction of painted human interphase chromosomes: active and inactive X-chromosome territories have similar volumes but differ in shape and surface structure. J Cell Biol. 1996;135:1427–1440. doi: 10.1083/jcb.135.6.1427. [DOI] [PMC free article] [PubMed] [Google Scholar]
- Jiménez-Garíca LF, Spector DL. In vivo evidence that transcription and splicing are coordinated by a recruiting mechanism. Cell. 1993;73:47–59. doi: 10.1016/0092-8674(93)90159-n. [DOI] [PubMed] [Google Scholar]
- Kurz A, Lampel S, Nickolenko JE, Bradl J, Benner A, Zirbel RM, Cremer T, Lichter P. Active and inactive genes localize preferentially in the periphery of chromosome territories. J Cell Biol. 1996;135:1195–1205. doi: 10.1083/jcb.135.5.1195. [DOI] [PMC free article] [PubMed] [Google Scholar]
- Lamond AI, Earnshaw WC. Structure and function in the nucleus. Science. 1998;280:547–553. doi: 10.1126/science.280.5363.547. [DOI] [PubMed] [Google Scholar]
- Marshall WF, Straight A, Marko JF, Swedlow J, Dernburg A, Belmont A, Murray AW, Agard DA, Sedat JW. Interphase chromosomes undergo constrained diffusional motion in living cells. Curr Biol. 1997;7:930–939. doi: 10.1016/s0960-9822(06)00412-x. [DOI] [PubMed] [Google Scholar]
- Misteli T, Cáceres JF, Clement J, Krainer AR, Wilkinson M, Spector DL. Serine phosphorylation of SR proteins is required for their recruitment to active sites of transcription in vivo. J Cell Biol. 1998;143:297–307. doi: 10.1083/jcb.143.2.297. [DOI] [PMC free article] [PubMed] [Google Scholar]
- Misteli T, Cáceres JF, Spector DL. The dynamics of a pre-mRNA splicing factor in living cells. Nature. 1997;387:523–527. doi: 10.1038/387523a0. [DOI] [PubMed] [Google Scholar]
- Misteli T, Spector DL. Applications of the green fluorescent protein in cell biology and biotechnology. Nature Biotechnol. 1997;15:961–964. doi: 10.1038/nbt1097-961. [DOI] [PubMed] [Google Scholar]
- Misteli T, Spector DL. The cellular organization of gene expression. Curr Opin Cell Biol. 1998;10:323–331. doi: 10.1016/s0955-0674(98)80007-0. [DOI] [PubMed] [Google Scholar]
- Misteli T, Spector DL. RNA polymerase II targets pre-mRNA splicing factors to transcription sites in vivo. Mol Cell. 1999;3:697–705. doi: 10.1016/s1097-2765(01)80002-2. [DOI] [PubMed] [Google Scholar]
- Nauck D, Klawonn F, Cruse R. Foundations of Neuro-Fuzzy Systems. New York: Wiley; 1997. [Google Scholar]
- Qian H, Sheetz MP, Elson EL. Single particle tracking. Biophys J. 1991;60:910–921. doi: 10.1016/S0006-3495(91)82125-7. [DOI] [PMC free article] [PubMed] [Google Scholar]
- Spector DL. Macromolecular domains within the cell nucleus. Annu Rev Cell Biol. 1993;9:265–315. doi: 10.1146/annurev.cb.09.110193.001405. [DOI] [PubMed] [Google Scholar]
- Tvaruskó W, Bentele M, Misteli T, Rudolf R, Kaether C, Spector DL, Gerdes HH, Eils R. Time-resolved analysis and visualization of dynamic processes in living cells. Proc Natl Acad Sci USA. 1999;96:7950–7955. doi: 10.1073/pnas.96.14.7950. [DOI] [PMC free article] [PubMed] [Google Scholar]
Associated Data
This section collects any data citations, data availability statements, or supplementary materials included in this article.


