

Abstract
The amyloid precursor protein (APP) in brain is processed either by an amyloidogenic pathway by β-secretase and γ-secretase to yield Aβ (β-amyloid 4 kDa) peptide or by α-secretase within the β-amyloid domain to yield non-amyloidogenic products. We have studied blood platelet levels of a 22-kDa fragment containing the Aβ (β-amyloid 4 kDa) peptide, β-secretase (BACE1), α-secretase (ADAM10), and APP isoform ratios of the 120–130 kDa to 110 kDa peptides from 31 Alzheimer's disease (AD) patients and 10 age-matched healthy control subjects. We found increased levels of Aβ4, increased activation of β-secretase (BACE1), decreased activation of α-secretase (ADAM10) and decreased APP ratios in AD patients compared to normal control subjects. These observations indicate that the blood platelet APP is processed by the same amyloidogenic and non-amyloidogenic pathways as utilized in brain and that APP processing in AD patients is altered compared to control subjects and may be a useful bio-marker for the diagnosis of AD, the progression of disease and for monitoring drug responses in clinical trials.
Keywords: Alzheimer's disease, Platelets, β-Amyloid, β-Secretase, α-Secretase, APP
1. Introduction
Aβ, processed from APP by β-and γ-secretases, accumulates in the brain of Alzheimer's disease patients as amyloid-containing plaques and as oligomers in the cytoplasm of neurons [1-3]. In platelets, APP is processed also by β- and γ-secretases to produce Aβ [4,5]. Alternatively, APP in brain or platelets can be cleaved by α-secretase within the β-amyloid domain [1,2]. β-Secretase enzyme 1 (BACE1) present in neurons, liver, muscle, and blood platelets is endoproteolysized within its catalytic domain in the process of producing Aβ [3,6]. The membrane-bound disintegrin metalloproteinases (ADAMs) are capable of cleaving APP at the α-secretase site and ADAM10 is one of the known candidates [7].
Platelet APP isoform ratios of the 120–130 kDa to the 110kDa peptides are significantly reduced in AD compared to control subjects, decrease in a linear manner with the degree of dementia and can be normalized by cholesterol lowering agents. [8-11].
Aβ levels, α-secretase (ADAM10) and β-secretase (BACE1) activities and APP isoform ratios can be measured in platelets and offer the possibility they may be used as bio-markers to diagnosis AD, and follow the patient's clinical course [4,5,8-12]. We report here a study with 31 AD patients and 10 age-matched healthy control individuals of their Aβ levels, β- and α-secretase activities and APP isoform ratios to determine if platelet APP processing conforms to brain APP processing, is abnormal in AD patients, and correlates with disease severity in AD patients.
2. Subjects and methods
2.1. Subjects
Thirty-one patients (age, year, Mean±S.D., 76.0±8.72) with probable AD and 10 healthy control subjects with similar age (age, year, 76.3±4.47) were included in this study. Patients met criteria for a probable AD by using standardized evaluations and National Institute of Neurological Communicative Disorders and Stroke/Alzheimer's Disease and Related Disorders Association Work Group criteria in our Alzheimer's disease Center. Mini-Mental State Examination (MMSE) was performed on the day when blood was drawn. For further analysis, patients were subdivided by MMSE scores into mild (MMSE 22–26, n = 18) and severe (MMSE 11–16, n = 13) cases. Human whole neuroglioma cell lysates (Santa Cruz Biotechnology, Santa Cruz, CA) and frozen cerebrum tissue from a 77-year-old male, healthy subject were used as positive controls.
2.2. Cerebrum tissue homogenization
−72 °C frozen cerebrum tissue mixed in 1:5 with 1×phosphate-buffered saline (PBS) buffer in a clean non-contaminated manual-homogenizer, proteinase inhibitors (10 mg/L aprotinin, 10 mg/L leupeptin, 0.1 mmol/L phenylmethyl-sulfony fluoride (PMSF)) and 1% Triton X-100 were added in the mixture. The tissue was homogenized on ice for 45 s. Then the homogenized tissue was sonicated for 5 min for 4 times on ice. The supernatant was centrifuged at 5000×g at −20 °C for 10 min.
2.3. Platelet isolation and cell lysates Western blot analysis
Platelets were prepared following the previously described protocol [8,10,11]. Lysates of platelets and positive controls of human whole neuroglioma cells and human cerebrum were fractionated on 10% polyacrylamide mini-gels, along with molecular markers of Kaleidoscope Prestained Standard and Precision plus Protein Standard (Bio-Rad, Hercules, CA). Proteins were transferred to filters (Immobilon P, Millipore Corp., Bedford, MA), blocked with non-fat milk, and allowed to bind to a 1:8000 dilution of monoclonal antibody m22c11 (Chemicon, Temecula, CA), which recognizes the N-terminal domain of APP isoforms of 110 and 120–130 kDa in human platelets [11,16]. After 3 h of incubation, blots were incubated for 1 h with HRP-Goat Anti-mouse IgG (H + L) Conjugate (Zymed, San Francisco, CA), diluted 1:8000, and then subjected to enhanced chemoluminescence (Amersham Inc., Arlington Heights, IL), followed by autoradiography for 5 to 60 s. Autoradiographs were digitally scanned (ScanJet4C, Hewlett-Packard Co., Palo Alto, CA), and the integrated densities (less background) of the visualized 110 kDa and 120 to 130 kDa bands were quantitated using Scion Image software based on NIH-Image (Scion Corp., Frederick, MD). Only band densities in the previously established linear range (10 to 200 mean absorption units) were used [8,10,11]. APP ratios of the optical densities (OD) of upper band (120–130 kDa) to lower band (110 kDa) were averaged from six analyses. Polyclonal antibody (pAb) β-amyloid (H-43) (Santa Cruz Biotechnology, Santa Cruz, CA), diluted 1:5000, pAb BACE1 (Affinity Bio, Golden, CO), diluted 1:1000, and pAb ADAM10 (Chemicon, Temecula, CA), diluted 1:3000, were used to recognize a 22-kDa β-A4-containing carboxyl-terminal fragment [12,13], BACE1 [6,14] and ADAM10 [7,15] successively. HRP-Goat Anti-rabbit IgG (H + L) Conjugate (Zymed, San Francisco, CA), diluted 1:8000, was used to conjugate to the blots. Quantitative analysis of WB was performed and pAb β-actin (Novus-biologicals, Littleton, CO) of a dilution 1:5000 was used as the internal standard. Autoradiographs were scanned and the OD of each specific band of 22-kDa fragment containing β-A4, β-secretase (BACE1) and α-secretase (ADAM10) were measured.
2.4. Statistical methods
The ratios of β-A4/β-actin, BACE1 (37 kDa/57 kDa), ADAM10/β-actin and APP in mild, severe and control groups were found to be non-normally distributed and had significantly different group variances for the measures β-A4/β-actin, β-secretase (37 kDa/57 kDa), α-secretase/β-actin and APP ratio. Comparisons between groups for these measures were conducted using the Kruskal–Wallis test. When significant, post hoc tests were performed using the Dunn nonparametric multiple comparisons test. Medians and interquartile (IQ) ranges are provided for each variable. Additional assumptions for each statistical test were checked for violations. Significance level for all tests was set at p < 0.05 and analyses were performed using SPSS V13.0.
3. Results
Previously published papers [13-16] have convincingly demonstrated the specificity and the sensitivity for antibodies of pAb β-amyloid (H-43), pAb BACE1, pAb ADAM10 (α-secretase), and mAb m22C11 by protein sequencing analysis. To address the specificity of each antibody applied in platelet lysates, we used human cerebral tissue and neuroglioma cell lysates as positive controls. The same molecular weight products are identified in our positive control samples as in the platelet lysates with each antibody (Fig. 1A-D).
Fig. 1.
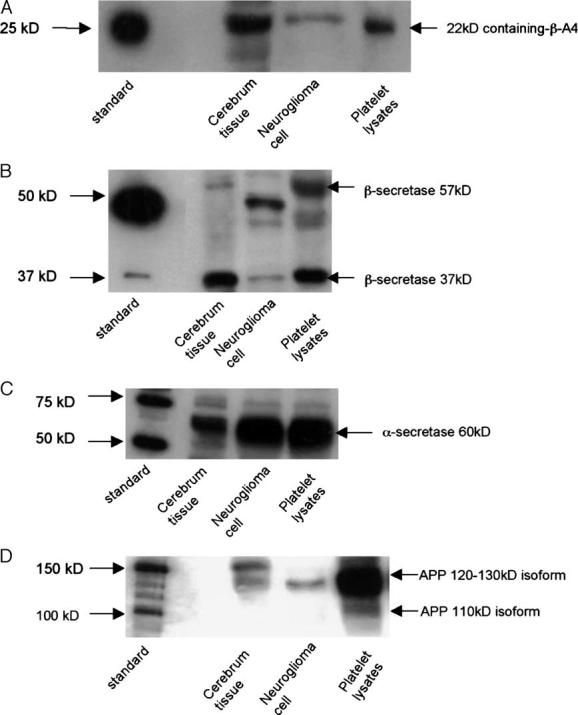
(A) Positive control samples and platelet lysates detected with pAb β-amyloid. (B) Positive control samples and platelet lysates detected with pAb BACE1. (C) Positive control samples and platelet lysates detected with pAb ADAM10. (D) Positive control samples and platelet lysates detected with mAb m22c11.
The 31 AD patients were divided into mild AD (AD-m) and severe AD (AD-s) groups based on MMSE scores. The rank order of the 3 groups for β-myloid, β-secretase, β-secretase, and APP ratio is shown in Table 1.
Table 1.
Kruskal–Wallis test and Dunn multiple comparisons post hoc test
| Ratios | Controls |
AD-mild |
AD-severe |
Kruskal – Wallis test |
||||||
|---|---|---|---|---|---|---|---|---|---|---|
| N | Median | IQ range | N | Median | IQ range | N | Median | IQ range | p-value | |
| β-AmyA4/actin | 10 | 0.97 | 0.32 | 13 | 2.18 | 1.13 | 10 | 2.23 | 1.7 | 0.0023** |
| β-Secretase (37 kDa)/(57 kDa) | 10 | 1.95 | 5.67 | 18 | 0.46 | 0.18 | 13 | 0.46 | 0.76 | 0.0005* |
| α-Secretase/actin | 10 | 1.34 | 0.35 | 18 | 0.53 | 0.41 | 13 | 0.30 | 0.41 | 0.0014* |
| APP ratio | 10 | 7.32 | 2.25 | 18 | 6.28 | 0.73 | 13 | 5.66 | 0.94 | 0.0003* |
Dunn multiple comparisons post hoc test
Control>AD-m, p<0.05; Control>AD-s, p<0.05.
Control<AD-m, p<0.05; Control<AD-s, p<0.05.
Aβ: One distinct 22-kDa band present as a C-terminal fragment of β-amyloid 4 kDa [12,13] was detected (Fig. 3A). β-Actin (40 kDa) was used as an internal standard. The rank order of OD of 22-kDa band including Aβ/β-actin was found to be significant (p = 0.0023) (Table 1). The rank order for both AD-m and AD-s groups compared to the control group was found to be significantly higher (both p < 0.05) (Figs. 2A and 3A). β-Secretase: Fig. 3B shows two specific C-terminal fragments of β-secretase (BACE1), 37 kDa and 57 kDa. The reduced endoproteolytic component of β-secretase (37 kDa) represents the increased activity of β-secretase and the 57-kDa band represents a full-length form of β-secretase [6,14]. The rank order of the ratio (OD) for these two fragments (37 kDa/57 kDa) was found to be significant (p = 0.0005) (Table 1). There was significant lower rank order of ratio of β-secretase (37 kDa)/β-secretase (57 kDa) for both AD-m and AD-s groups compared to the control group (both p < 0.05) (Figs. 2B and 3B). We used β-actin as an internal standard to evaluate the two forms of β-secretase separately. The rank order of the ratio of OD of β-secretase (37 kDa)/β-actin was found to be significant (p = 0.0009). There was significant lower rank order of OD of β-secretase (37 kDa)/β-actin for both AD-m and AD-s groups compared to the control group (both p < 0.05) (Figs. 2B and 3B). The rank order of the ratio of OD of β-secretase (57 kDa)/β-actin was not found to be different across groups (p = 0.4041).
Fig. 3.
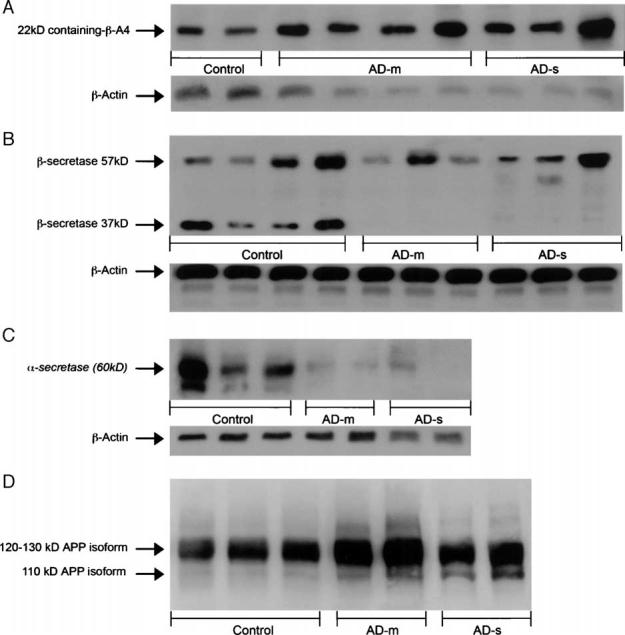
(A) β-Amyloid 4 kDa containing fragment 22 kDa with β-actin in Western blot. (B) β-Secretase (BACE1) 37 kDa (lower band), 57 kDa (upper band), with β-actin in Western blot. (C) Western blot of α-secretase (ADAM10) 60 kDa with β-actin in control, AD-m and AD-s groups. (D) Western blot of APP isoforms in control, AD-m and AD-s groups.
Fig. 2.


(A) β-Amyloid 4 kDa containing fragment 22 kDa/β-actin in control, AD-m and AD-s groups. (B) β-Secretase (37 kDa)/(57 kDa) by groups. Two points in control group (20.12, 26.69) and one point in AD-m (8.15) are not shown in this chart. (C) α-Secretase (60 kDa)/β-actin for control, AD-m and AD-s groups. (D) APP ratio of (120–130 kDa) in control, AD-m, and AD-s groups.
α-Secretase: The 60-kDa band of α-secretase [7,15] is shown in Fig. 3C. The rank order for the ratio of OD of α-secretase/β-actin found to be significant (p = 0.0014) (Table 1). The rank order in both mild AD-m and AD-s groups compared to the control group was found to be significantly lower (both p < 0.05) (Figs. 2C and 3C).
APP Ratio: The rank order of the 3 groups for the APP ratio of the OD of the upper band (120–130 kDa) [11,16] to the lower band (110 kDa) (Fig. 3D) was significant, p = 0.0003 (Table 1). The rank order of the APP ratio for the AD-m and AD-s groups was found significant lower than the control group (both p < 0.05) (Figs. 2D and 3D).
While all ratios (β-amyA4/actin, β-secretase 37 kDa/57 kDa, α-secretase/actin, APP ratio) were found to have significant rank order differences for the 3 groups, post hoc comparisons between AD-s and AD-m for all ratios were nonsignificant. Examining the medians (as well as the mean rank order) for the APP ratio, the AD-s and AD-m groups appear to have more separation in the groups (Dunn p-value is approximately 0.12) than the other ratios. While the Dunn multiple comparisons test is conservative, larger sample sizes in future studies may help to examine the differences between the mild and severe AD groups for all of these ratios.
4. Discussion
The specificity and the sensitivity of the antibodies of pAb β-amyloid (H-43), pAb BACE1, pAb ADAM10 (α-secretase), and mAb m22C11 have been convincingly demonstrated by protein sequencing analysis [13-16]. The specific antibody used in the present studies for β-amyloid, BACE1, ADAM10 (α-secretase) and APP isoforms identified products with the same molecular weights in positive controls (human cerebral tissue and neuroglioma cell lysates) and in platelet lysates (Fig. 1A-D). The findings in the present study and previously published papers [13 - 16] identifying the specific products for each antibody provide strong supporting evidence that platelet lysate products are indeed the 22-kDa band present as a C-terminal fragment of β-amyloid 4 kDa, BACE1, ADAM10 (α-secretase) and APP isoforms.
Platelet APP processing has been suggested as a bio-marker for AD based on the linear decline in the 120–130 kDa/110 kDa APP isoform ratio with the degree of dementia in AD patients [8-11]. Further, decreased α-secretase and increased β-secretase activities in platelets of AD patients compared to controls has been reported [4,5]. We extend these observations that platelet APP processing in AD patients is altered compared to control subjects by showing: (1) increased levels of Aβ are produced by platelets from AD patients compared to normal control subjects due to increased β-secretase and decreased α-secretase activities (Figs. 2A-C and 3A-C); (2) the APP isoform ratios decrease in AD patients compared to normal control subjects (Figs. 2D and 3D). The decreased α-secretase activity in AD patient platelets has been previously reported [4]. The decrease of the platelet 37 kDa β-secretase levels seen in our AD patient gels represents increased enzyme activity resulting from endoproteolysis of β-secretase [5]. The finding of increased Aβ levels in our AD platelet samples compared to normal controls is important and supports amyloidogenic pathway activation in AD platelets. Reduced α-secretase and increased β-secretase activities in AD platelets result in increased Aβ levels.
Platelet APP processing in AD patients is altered compared to normal control subjects and may serve as a useful bio-marker for the diagnosis of AD. We have shown that the APP isoform ratio declines in a linear manner with the severity of dementia over several years [10], and amplify this finding by showing that Aβ levels are increased in AD platelet samples by reduced α- and increased β-secretase activities. Increased platelet Aβ levels with associated reduced α-secretase and increased β-secretase activities may be useful bio-markers for diagnosing AD and for following the clinical progression of disease, as well as evaluating drug effects in clinical trials.
Acknowledgments
This study is supported by grants from the NIH, NIA, Alzheimer's disease Center, University of Texas Southwestern Medical Center at Dallas P30-AG12300-12, the National Alzheimer's Coordinating Center 5U-01AG16976, and the Rudman Foundation.
References
- 1.Selkoe DJ. The cell biology of β-amyloid precursor protein and presenilin in Alzheimer's disease. Trends Cell Biol. 1998;8:447–53. doi: 10.1016/s0962-8924(98)01363-4. [DOI] [PubMed] [Google Scholar]
- 2.Rosenberg RN. The molecular and genetic basis of Alzheimer's disease: the end of the beginning. Neurology. 2000;54:2045–54. doi: 10.1212/wnl.54.11.2045. [DOI] [PubMed] [Google Scholar]
- 3.Cai H, Wang Y, McCarthy D, Wen H, Borchelt D, Price D, et al. BACE1 is the major β-secretase for generation of Aβ peptides by neurons. Nat Neurosci. 2001;4:233–4. doi: 10.1038/85064. [DOI] [PubMed] [Google Scholar]
- 4.Colciaghi F, Borroni B, Pastorino L, Marcello E, Zimmermann M, Cattabeni F, et al. α-Secretase ADAM10 as well as αAPPs is reduced in platelets and CSF of Alzheimer disease patients. Mol Med. 2002;8(2):67–74. [PMC free article] [PubMed] [Google Scholar]
- 5.Colciaghi F, Marcello E, Borroni B, Zimmermann M, Caltagirone C, Cattabeni F, et al. Platelet APP, ADAM 10 and BACE alterations in the early stages of Alzheimer disease. Neurology. 2004;62:498–501. doi: 10.1212/01.wnl.0000106953.49802.9c. [DOI] [PubMed] [Google Scholar]
- 6.Huse J, Byant D, Yang Y, Pijak D, D'Souza I, Lah J, et al. Endoproteolysis of β-secretase (β-site amyloid precursor protein-cleaving enzyme) within its catalytic domain. J Biol Chem. 2003;278:17141–9. doi: 10.1074/jbc.M213303200. [DOI] [PubMed] [Google Scholar]
- 7.Kojro E, Gimpl G, Lammich S, Marz W, Fahrenholz F. Low cholesterol stimulates the nonamyloidogenic pathway by its effect on the α-secretase. Proc Natl Acad Sci U S A. 2001;98:5815–20. doi: 10.1073/pnas.081612998. [DOI] [PMC free article] [PubMed] [Google Scholar]
- 8.Rosenberg RN, Baskin F, Fosmire JA, Risser R, Adams P, Svetlik D, et al. Altered amyloid protein processing in platelets of patients with Alzheimer's disease. Arch Neurol. 1997;54:139–44. doi: 10.1001/archneur.1997.00550140019007. [DOI] [PubMed] [Google Scholar]
- 9.Diluca M, Pastorino L, Bianchetti A, Perez J, Vignolo L, Lenzi G, et al. Differential level of platelet amyloid beta precursor protein isoforms—an early marker for Alzheimer's disease. Arch Neurol. 1998;55:1195–200. doi: 10.1001/archneur.55.9.1195. [DOI] [PubMed] [Google Scholar]
- 10.Baskin F, Rosenberg RN, Iyer L, Hynan L, Cullum CM. Platelet APP isoform ratios correlate with declining cognition in AD. Neurology. 2000;54:1907–9. doi: 10.1212/wnl.54.10.1907. [DOI] [PubMed] [Google Scholar]
- 11.Baskin F, Rosenberg RN, Fang X, Hynan L, Moore CB, Weiner M, et al. Correlation of statin increased platelet APP ratios and reduced blood lipids in AD patients. Neurology. 2003;60:2006–7. doi: 10.1212/01.wnl.0000068029.56740.96. [DOI] [PubMed] [Google Scholar]
- 12.Li Q, Evin G, Small D, Multhaup G, Beyreuther K, Masters C. Proteolytic processing of Alzheimer's disease βA4 amyloid precursor protein in human platelets. J Biol Chem. 1995;270:14140–7. doi: 10.1074/jbc.270.23.14140. [DOI] [PubMed] [Google Scholar]
- 13.Van Leeuwen FW, De Kleijn DP, Hurk HH, Neubauer A, Sonnemans M, Sluijs J, et al. Frameshift mutants of β amyloid precursor protein and ubiquitin-B in Alzheimer's and Down patients. Science. 1998;279:242–7. doi: 10.1126/science.279.5348.242. [DOI] [PubMed] [Google Scholar]
- 14.Hussain I, Powell D, Howlett D, Tew D, Thomas M, Chapman C, et al. Identification of novel aspartic protease (Asp 2) as β-secretase. Mol Cell Neurosci. 1999;14:419–27. doi: 10.1006/mcne.1999.0811. [DOI] [PubMed] [Google Scholar]
- 15.Rosendahl M, Ko S, Long D, Brewer M, Rosenzweig B, Hedl E, et al. Identification and characterization of pro-tumor necrosis factor-α-processing enzyme from the ADAM family of zinc metalloproteases. J Biol Chem. 1997;272:24588–93. doi: 10.1074/jbc.272.39.24588. [DOI] [PubMed] [Google Scholar]
- 16.Weidemann A, Konig G, Bunke D, Fische P, Salbaum JM, Masters CL, et al. Identification, biogenesis, and localization of precursors of Alzheimer's disease A4 amyloid protein. Cell. 1989;57:115–26. doi: 10.1016/0092-8674(89)90177-3. [DOI] [PubMed] [Google Scholar]