Abstract
We report a multilaboratory evaluation of hepatitis C virus (HCV) viral load assays to determine their linear range, reproducibility, subtype detection, and agreement. A panel of HCV RNA samples ranging in nominal concentration from 1.0 to 7.0 log10 IU/ml was constructed by diluting a clinical specimen (genotype 1b). Replicates of the panel were tested in multiple laboratories using the Abbott TaqMan analyte-specific reagent (Abbott reverse transcription-PCR [RT-PCR]), Roche TaqMan RUO (Roche RT-PCR), Roche Amplicor Monitor HCV 2.0 (Roche Monitor), and Bayer VERSANT HCV RNA 3.0 (Bayer bDNA) assays. Bayer bDNA-negative specimens were tested reflexively using the Bayer VERSANT HCV RNA qualitative assay (Bayer TMA). Abbott RT-PCR and Roche RT-PCR detected all 28 replicates with a concentration of 1.0 log10 IU/ml and were linear to 7.0 log10 IU/ml. Roche Monitor and Bayer bDNA detected 27 out of 28 and 13 out of 28 replicates, respectively, of 3.0 log10 IU/ml. Bayer TMA detected all seven replicates with 1.0 log10 IU/ml. Bayer bDNA was the most reproducible of the four assays. The mean viral load values for panel members in the linear ranges of the assays were within 0.5 log10 for the different tests. Eighty-nine clinical specimens of various genotypes (1 through 4) were tested in the Bayer bDNA, Abbott RT-PCR, and Roche RT-PCR assays. For Abbott RT-PCR, mean viral load values were 0.61 to 0.96 log10 greater than the values for Bayer bDNA assay for samples with genotype 1, 2, or 3 samples and 0.08 log10 greater for genotype 4 specimens. The Roche RT-PCR assay gave mean viral load values that were 0.28 to 0.82 log10 greater than those obtained with the Bayer bDNA assay for genotype 1, 2, and 3 samples. However, for genotype 4 samples the mean viral load value obtained with the Roche RT-PCR assay was, on average, 0.15 log10 lower than that of the Bayer bDNA. Based on these data, we conclude that the sensitivity and linear range of the Abbott and Roche RT-PCR assays enable them to be used for HCV diagnostics and therapeutic monitoring. However, the differences in the viral load values obtained with the different assays underscore the importance of using one assay when monitoring response to therapy.
Hepatitis C virus (HCV) is an important cause of hepatitis and is the leading indication for liver transplantation in the United States. Therapy with pegylated interferon and ribavirin has become the standard of care, although not all individuals successfully clear virus. End-of-treatment response to therapy is defined as an undetectable RNA after completion of therapy, and a sustained response is an undetectable RNA at the end of follow-up, 6 months after completion of therapy (8). Sustained response can be predicted by a number of factors, including age, the presence of fibrosis on liver biopsy, baseline viral load, and genotype (9). Recent studies have shown that there is a very low likelihood (no greater than 3%) of sustained response if an individual does not obtain at least a 2-log10 drop in viral load 12 weeks after initiating therapy (5, 7). Viral load testing has thus become an essential tool for therapeutic monitoring. Qualitative HCV RNA assays are also useful at the end of treatment and the end of follow-up because they are the most sensitive tests available, with a lower limit of detection of 5 to 50 IU/ml, depending on the assay.
An ideal HCV RNA assay would be one with a lower limit of detection of 5 to 50 IU/ml and a 6 to 7 log10 linear range. This would eliminate the need for both qualitative and quantitative assays and would allow laboratories to use a single assay for therapeutic monitoring. Traditional viral load assays, such as the Bayer bDNA and Roche Monitor, have lower limits of quantification of 615 IU/ml and 600 IU/ml, respectively, which are inadequate to define an end-of-treatment response or sustained-treatment response. In addition, for Roche Monitor, specimens with concentrations greater than the limit of quantification (800,000 IU/ml) must be diluted to accurately determine viral load. The upper quantification limit of the Bayer bDNA assay is 7.7 million IU/ml; therefore, dilution of clinical specimens is not routinely needed.
Real-time PCR assays are very promising tools for therapeutic monitoring because of their sensitivity and broad measurable range. Currently, there are a limited number of published studies on the performance characteristics of these assays. Several studies have reported that assays utilizing COBAS TaqMan48 HCV analyte-specific reagent (ASR) (Roche Diagnostics) have a low limit of sensitivity, between 10 and 100 IU/ml, and are linear to at least 100 million IU/ml (1, 4, 6). In this study, we performed a multilaboratory evaluation of two real-time assays, the Abbott reverse transcription-PCR (RT-PCR) and Roche RT-PCR, and compared their performances to those of the Bayer bDNA and Roche Monitor assays. The goal was to determine the limit of detection for the real-time assays (defined as the lowest concentration of HCV RNA in which 95% of replicates are positive), as well as linear range, reproducibility, subtype detection, and agreement.
MATERIALS AND METHODS
Standard and clinical samples.
Panels were produced by the Division of AIDS Viral Quality Assurance Laboratory (DAIDS VQA Laboratory) at Rush University Medical Center, Chicago, Ill. Plasma was obtained from an HCV-infected individual (genotype 1b) following an institutional review board-approved protocol. The concentration of HCV RNA in the plasma sample was determined using the COBAS AMPLICOR HCV Monitor v2.0 test (Roche Monitor; Roche Diagnostics Corporation, Indianapolis, IN). To allow quantification within the linear range of the assay, the sample was diluted 1:100 and run in triplicate, and a single aliquot at a 1:200 dilution was also run. All four values were averaged to determine the final concentration of the sample. This stock material was then diluted with normal human plasma to concentrations of 1.0 to 7.0 log10 IU/ml. Aliquots were stored at −70°C prior to testing.
For genotype equivalence studies, 89 plasma samples were collected at the Cleveland Clinic Laboratories following an institutional review board-approved protocol and were stored at −70°C. These samples were collected and shipped at −70°C to the Division of AIDS Viral Quality Assurance Laboratory, where they were aliquoted and shipped to the laboratories for testing.
Viral load assays.
The HCV RNA ASR (Abbott RT-PCR; Abbott Laboratories, Abbott Park, IL) and the COBAS TaqMan48 HCV RUO (Roche RT-PCR; Roche Diagnostics) were performed as follows. For both assays, nucleic acid was extracted from 500 μl of plasma using the QIAamp MinElute Virus Vacuum kit (QIAGEN, Valencia, CA). Although this is not the protocol recommended by either manufacturer, it was chosen to standardize the extraction method for both Abbott RT-PCR and Roche RT-PCR. The extraction was done per the manufacturer's protocol with the following exceptions: the protease was rehydrated in molecular-grade water instead of the supplied protease resuspension buffer, and carrier RNA was reconstituted in AVE buffer to which an internal quantitative control (IQC) or quantitation standard (QS) was added. For the Abbott RT-PCR, 104 μl of reconstituted carrier RNA and 7.68 μl of IQC were added to 9.3 ml of AL buffer; 500 μl of this buffer was added to each 500-μl sample. This equates to 0.41 μl of IQC per sample (1,809 IU of IQC per sample). Samples were eluted in 75 μl, and 50 μl of extracted sample was added to 50 μl of master mix; data were analyzed using the SQS 3.0 quantification software. For the Roche RT-PCR, extractions were performed following the manufacturer's protocol for MinElute columns with the following modification. Carrier RNA was reconstituted with 230 μl of QS and 80 μl AVE buffer, and the RNA-QS-AVE solution (74 μl) was then added to 6.6 ml lysis buffer. A total of 500 μl of the lysis buffer was added to 500 μl of sample, which equates to 4.09 μl of QS added per sample. Samples were eluted in 75 μl, and 50 μl was used in the amplification assays.
Roche Monitor and Bayer bDNA (Bayer Diagnostics Corporation, Tarrytown, NY) were performed following the manufacturer's protocols. Specimens that were negative in the Bayer bDNA were tested by the Bayer TMA (Bayer Reference Testing Laboratory, Berkeley, CA), which has a lower limit of detection of 5 IU/ml. For the Roche Monitor assay, specimens that had a viral load greater than 100,000 IU/ml were diluted 1:100 in normal human plasma and retested.
Study design.
The limit of detection, linear range, reproducibility, and agreement were determined using the dilution panel. For Roche RT-PCR, Bayer bDNA, and Roche Monitor, four laboratories tested seven replicates of each panel member (a total of 28 replicates for each panel member). Three laboratories performed the Abbott RT-PCR assay. One laboratory tested two panels, so that the total numbers of replicates were identical for the two RT-PCR assays. One laboratory (Bayer Reference Testing Laboratory) tested seven replicates of a limited panel that included members with a viral load of ≤3.0 log10 IU/ml using the Bayer TMA test.
To assess quantification of specimens with different genotypes, clinical specimens of known genotype were tested in the Bayer bDNA, Abbott RT-PCR, and Roche RT-PCR assays following the methods described above. There was not adequate specimen to perform the Roche Monitor test. HCV genotype was determined using the LiPA Line Probe Assay (Bayer Diagnostics, Tarrytown, NY). In these experiments, the Bayer bDNA assay was considered the gold standard viral load assay, as this is the only FDA-cleared HCV viral load test. There were 28 specimens of genotype 1, 25 specimens of genotype 2, 29 specimens of genotype 3, and 7 specimens of genotype 4.
Statistical analysis.
HCV concentrations were log10 transformed for analysis. Results that were reported as invalid using assay-specific software were excluded from the analysis. The linear range was examined by comparison to a 45o line. Within-laboratory standard deviations and mean residuals (observed minus nominal log10 viral load) were tools for evaluating reproducibility and bias, respectively. For the genotype study, differences in the mean viral load values were assessed with the paired t test. Agreement between viral load values was assessed by the method of Bland and Altman (2).
RESULTS
Sensitivity and specificity.
Differences in sensitivity and specificity were observed between assays. Both the Roche RT-PCR and Abbott RT-PCR were able to detect all 28 replicates of the 1.0-log10 IU/ml sample (Table 1). For the Roche Monitor assay, 22 of the 28 (79%) replicates at 2.5 log10 IU/ml and 27 of the 28 (96%) replicates at 3.0 log10 IU/ml were detected. The Bayer bDNA assay detected 13 out of 28 (46%) replicates at 3.0 log10 IU/ml. However, samples that were negative in the Bayer bDNA assay were reflex tested in the Bayer TMA, which detected all seven replicates at 1.0 log10 IU/ml. None of the 28 replicates at 0 IU/ml were positive in the Roche RT-PCR or Roche Monitor assays. Two and 1 of the 28 replicates at 0 log10 IU/ml were positive in the Bayer bDNA and Abbott RT-PCR, respectively. For the Bayer TMA, one of the seven replicates at 0 log10 IU/ml tested positive.
TABLE 1.
Sensitivity and specificity of the viral load assays
| Assay | No. positive/no. tested at the following sample concn (log10 IU/ml):
|
|||||
|---|---|---|---|---|---|---|
| 0 | 1.0 | 1.5 | 2.0 | 2.5 | 3.0 | |
| Bayer bDNA | 2/28 | 0/28 | 3/28 | 13/28 | ||
| Bayer TMA | 1/7 | 7/7 | 7/7 | 7/7 | 7/7 | 7/7 |
| Roche Monitor | 0/28 | 13/28 | 22/28 | 27/28 | ||
| Abbott RT-PCR | 1/28 | 28/28 | 28/28 | 26/26a | 27/27b | 28/28 |
| Roche RT-PCR | 0/28 | 28/28 | 28/28 | 28/28 | 28/28 | 28/28 |
Two invalid specimens.
One invalid specimen.
Linear range.
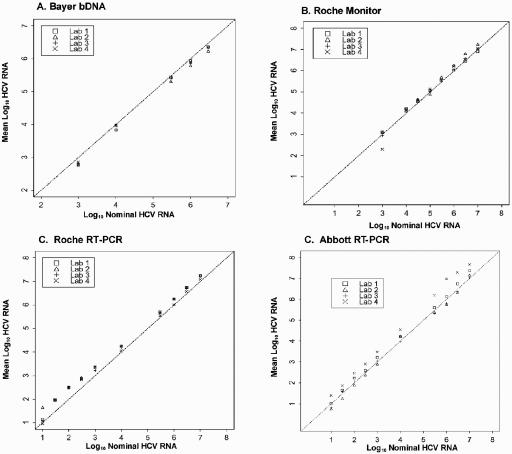
The Abbott and Roche RT-PCR assays were linear from 1.0 to 7.0 log10 IU/ml (Fig. 1). A clinical specimen with high enough viral load to assess the linear range beyond 7.0 log10 IU/ml was not available. The Bayer bDNA assay was linear to 6.5 log IU/ml. Eighteen of the 28 replicates of the 7.0- log10 IU/ml sample had linear ranges greater than 6.89 log10 IU/ml. After dilution of panel members with linear ranges of greater than 5.0 log10 IU/ml, the upper quantification limit of Roche Monitor was at least 7.0 log10 IU/ml.
FIG. 1.
Linear range of the viral load assays. (A) Bayer bDNA assay by laboratory; (B) Roche Monitor assay by laboratory (samples with a viral load greater than 5.0 log10 IU/ml were diluted 1:100 and retested); (C) Roche RT-PCR assay by laboratory; (D) Abbott RT-PCR by laboratory.
Mean viral load.
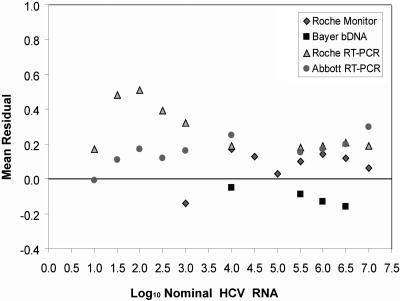
To assess the relative agreement of the mean viral load values between the different assays, the mean viral load was calculated across all laboratories for all samples that were within the linear range of each assay (Table 2). The mean viral load values between different tests were within 0.5 log10. The mean differences for pairs of tests ranged from 0.18 to 0.46 log10 IU/ml. Mean residual values, expressed as viral load values minus the nominal concentration, are shown in Fig. 2. The Roche RT-PCR assay provided viral load values that were consistently higher than those observed with the Abbott RT-PCR for viral load values less than 4.0 log10 IU/ml. The assays were in closer agreement for samples whose values were above this concentration.
TABLE 2.
Mean viral load values for the different assays (results are expressed as means for all laboratories)
| Nominal concn (log10 IU/ml) | Viral load (log10 IU/ml) by assay
|
|||
|---|---|---|---|---|
| Roche Monitora | Bayer bDNA | Roche RT-PCR | Abbott RT-PCR | |
| 1.0 | 1.17 | 0.99 | ||
| 1.5 | 1.96 | 1.59 | ||
| 2.0 | 2.51 | 2.17 | ||
| 2.5 | 2.87 | 2.59 | ||
| 3.0 | 2.86 | 3.32 | 3.16 | |
| 4.0 | 4.17 | 3.95 | 4.19 | 4.25 |
| 4.5 | 4.61 | |||
| 5.0 | 5.03 | |||
| 5.5 | 5.58 | 5.39 | 5.65 | 5.63 |
| 6.0 | 6.14 | 5.87 | 6.19 | 6.17 |
| 6.5 | 6.59 | 6.32 | 6.69 | 6.68 |
| 7.0 | 7.06 | —b | 7.19 | 7.30 |
Samples with a viral load of greater than 5.0 log10 IU/ml were diluted 1:100 and retested.
—, Eighteen of 28 samples were >6.89 log10 IU/ml.
FIG. 2.
Plot of the mean residual values for the viral load assays. Mean residual values are expressed as viral load minus the nominal concentration. Values are expressed as the means of all laboratories.
Reproducibility.
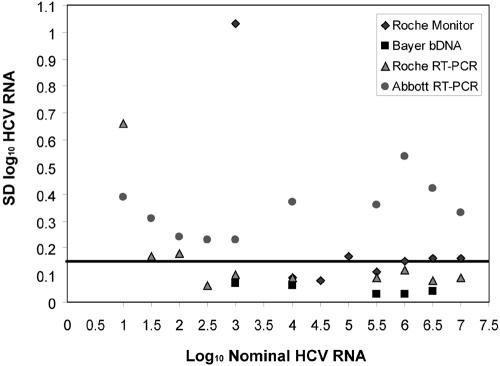
The Bayer bDNA is the most reproducible assay, with mean log10 standard deviation values consistently below 0.15 log10 (Fig. 3). The Virology Quality Assurance Laboratory program uses a standard deviation of 0.15 to ensure that within-laboratory results can reliably detect a fivefold (0.69 log10) difference in copy number between two independent samples (10). The Roche RT-PCR assay had good reproducibility (standard deviation, ∼0.15 log10 IU/ml or less) for samples with a viral load greater than or equal to 1.5 log10 IU/ml. The Abbott RT-PCR assay was the least reproducible of the four viral load assays, as the standard deviations were consistently greater than 0.15 log10 IU/ml.
FIG. 3.
Plot of the standard deviations (SD) for the viral load assays. The standard deviations have been calculated across all laboratories at tested log10 nominal HCV RNA values.
Genotype bias.
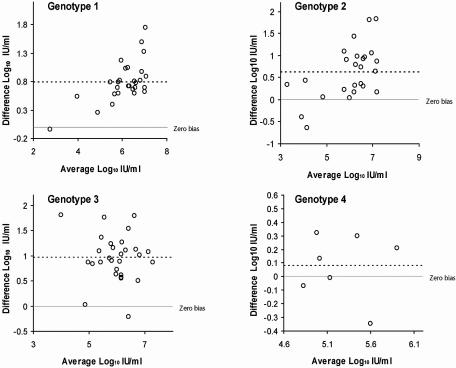
To determine whether genotype-specific quantification bias occurs in the two RT-PCR methods, a total of 89 clinical specimens were tested and compared to the concentrations determined by Bayer bDNA. Mean viral load values for each genotype are shown in Table 3. Abbott RT-PCR and Roche RT-PCR mean viral loads were higher than Bayer bDNA loads for genotypes 1, 2, and 3. The magnitude of this difference varied for the two RT-PCR assays. Compared to the Bayer bDNA, mean viral load values for genotype 1, 2, and 3 samples were 0.79, 0.61, and 0.96 log10 IU/ml greater by Abbott RT-PCR and 0.82, 0.77, and 0.28 log10 IU/ml greater by Roche RT-PCR. These differences between the RT-PCR and Bayer bDNA measurements were statistically significant for both assays (P < 0.0001, Abbott RT-PCR; P < 0.0001 and P < 0.004, Roche RT-PCR).
TABLE 3.
Mean viral load values and standard deviations for the 89 clinical specimens
| Assay | Mean viral load (SD) (log10 IU/ml) and P by genotype
|
|||
|---|---|---|---|---|
| Genotype 1 (n = 28) | Genotype 2 (n = 25) | Genotype 3 (n = 29) | Genotype 4 (n = 7) | |
| Bayer bDNA | 5.71 (0.86) | 5.70 (0.96) | 5.50 (0.77) | 5.23 (0.41) |
| Abbott RT-PCR | 6.50 (1.09), P < 0.0001 | 6.31 (1.30), P < 0.0001 | 6.46 (0.72), P < 0.0001 | 5.31 (0.40), P = 0.42 |
| Roche RT-PCR | 6.53 (1.01), P < 0.0001 | 6.47 (1.14), P < 0.0001 | 5.78 (0.95), P < 0.004 | 5.08 (0.72), P = 0.36 |
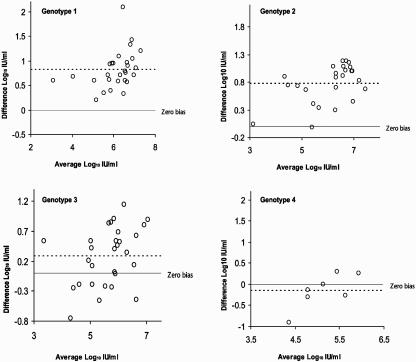
Compared to data for genotypes 1 to 3, mean viral load values were lower for genotype 4 specimens by Abbott RT-PCR and Roche RT-PCR. For genotype 4, the mean Abbott RT-PCR viral load was equivalent to that of Bayer bDNA (5.23 versus 5.31 log10 IU/ml) and the mean Roche RT-PCR viral load was less than that for Bayer bDNA (5.08 versus 5.23 log10 IU/ml). For one genotype 4 specimen, the difference between Roche RT-PCR and Bayer bDNA was 0.91 log10 IU/ml (see Fig. 5).
FIG. 5.
Agreement plots between the Bayer bDNA and Roche RT-PCR assays. The dotted line represents the mean difference for the samples.
Agreement plots between Bayer bDNA and Abbott RT-PCR are shown in Fig. 4, and agreement plots between Bayer bDNA and Roche RT-PCR are shown in Fig. 5. In these plots, positive bias occurred when RT-PCR test values were greater than Bayer bDNA values. Negative bias occurred when the Bayer bDNA viral load values were greater than the RT-PCR values. With the Abbott RT-PCR, for genotypes 1, 2, and 3 the majority of the samples had a positive bias; only 4 of the 82 (5%) samples had a negative bias. For genotype 4, two of the seven (29%) samples had a negative bias, and the bias for all genotype 4 samples was, on average, lower than that observed for the genotype 1, 2, and 3 samples. For the Roche RT-PCR, all genotype 1 and most (24 out of 25) genotype 2 samples had a positive bias. A different pattern was observed for genotype 3 and 4 samples. Eight genotype 3 specimens (28%) tested by Roche RT-PCR had viral load values less than those obtained with the Bayer bDNA assay. Some of these differences were small (0.01 log10 IU/ml); however, others were greater (0.45 and 0.75 log10 IU/ml). To assess whether the low mean difference for genotype 3 samples (0.28 log10 IU/ml; Table 3) was due to selective samples with a negative bias (as opposed to lower quantification of all genotype 3 samples), the mean difference between Roche RT-PCR and Bayer bDNA was recalculated after exclusion of genotype 3 samples with viral load values equal to or less than those of Bayer bDNA (data not shown). The resultant mean difference was 0.55 log10 IU/ml, and the range of mean difference values for genotype 1 to 3 samples (0.82 to 0.55 log10 IU/ml, or 0.27 log10 IU/ml) was comparable to that for Abbott RT-PCR (0.96 to 0.61 log10 IU/ml, or 0.35 log10 IU/ml). For genotype 4, four of the seven (57%) specimens had a negative bias, and the mean difference was −0.15 log10 IU/ml.
FIG. 4.
Agreement plots between the Bayer bDNA and Abbott RT-PCR assays. The dotted line represents the mean difference for the samples.
DISCUSSION
This multilaboratory comparison of the currently available HCV viral load assays clearly showed the value of the real-time PCR assays. Both the Abbott and Roche RT-PCR assays are very sensitive, detecting all 28 replicates of the 1.0-log10 IU/ml specimen. In addition, they remained linear to at least 7.0 log10 IU/ml. These results are consistent with those of recent reports of the sensitivity and linear range of the Roche RT-PCR ASR assay (1, 4, 6). We were unable to obtain an adequate volume of a clinical specimen with a viral load of >8.0 log10 IU/ml to establish the upper end of the linear range. With this limit of detection and linear range, these real-time assays can be used for both diagnosis of infection and monitoring response to therapy, eliminating the need for laboratories to use both qualitative and quantitative assays. The Bayer bDNA assay with reflex testing of negative specimens to the TMA assay provides a sensitivity equivalent to that of the real-time assays. Of note, the linear range of Bayer bDNA compared well with the manufacturer's stated upper limit of 6.89 log10 copies/ml.
The Bayer bDNA assay was the most reproducible of the four assays tested. The Roche Monitor assay is also quite reproducible for values greater than 4.0 log10 IU/ml. Between the two real-time assays, the Roche assay appears to be more reproducible than the Abbott assay; however, for both RT-PCR assays a QIAGEN MinElute system was used for nucleic acid extraction, which is not the method recommended by either manufacturer. We chose the MinElute system because it could accommodate a sample volume of 500 μl, and use of this method allowed for standardization of the nucleic acid extraction method for both of the RT-PCR assays. It is unclear if the assays would have shown better reproducibility using the manufacturer's recommended extraction method. For the Roche RT-PCR assay, the reproducibility improved considerably for viral load values greater than 2.5 log10 IU/ml. In contrast, the Abbott RT-PCR assay was most reproducible at the middle portion of the linear range, with higher variability at the upper and lower concentrations within the linear range.
In measurable range experiments using a single genotype 1b specimen, all four methods gave viral load values within 0.5 log10 IU/ml for all concentrations within the linear range of the assays. This level of agreement was remarkable, given that different amplification methods and standards were used in the assays. In contrast, greater variability in quantification (up to 2.09 log10 IU/ml) between different methods was observed when clinical specimens were tested in genotype bias experiments.
The Bayer bDNA was chosen as the comparator assay in genotype bias experiments, because it is reported to reliably detect all genotypes (3), quantification data in the linear range are very reproducible (our data and reference 2), and it is the only FDA-approved quantitative assay. One limitation of this approach is that the Bayer bDNA assay may not necessarily be the most accurate HCV quantification method. However, there is no gold standard quantitative assay for these types of studies, and for the purposes of this analysis, trends in viral load were more important than absolute quantification.
In genotype bias experiments, no difference in quantification of genotypes 1, 2, and 3 was observed for the Abbott RT-PCR assay. Mean viral load values for these genotypes were greater than the Bayer bDNA assay and varied by only 0.35 log10 IU/ml. In contrast, a different trend in quantification was observed for genotype 4 samples. Mean viral load values by Abbott RT-PCR were comparable to Bayer bDNA data, and two of the seven individual results were lower than those for Bayer bDNA. These data suggest that, relative to genotypes 1 to 3, Abbott RT-PCR may underquantify some genotype 4 specimens. The number of samples studied was limited, and additional experiments with a larger sample number are required.
For the Roche RT-PCR assay, quantification of genotypes 1 and 2 was equivalent, since viral load values for these specimens were similar to each other and greater than those obtained with the Bayer bDNA assay. The data for genotypes 3 and 4 raise concerns that some of these samples may be underquantified by the Roche RT-PCR assay. For genotype 3, the mean viral load was greater than that of Bayer bDNA; however, the difference was not as great as that observed for genotypes 1 and 2. Additionally, a proportion of genotype 3 specimens had viral loads less than that of Bayer bDNA. Significant underquantification (0.5 log10 IU/ml) by Roche RT-PCR appears to be specimen specific and not a systematic bias, since the range of the mean difference data for genotypes 1 to 3 obtained by the two RT-PCR methods was comparable after exclusion of genotype 3 samples with a negative bias. For genotype 4, the mean viral load value was lower for the Roche RT-PCR assay than for Bayer bDNA, and four of seven individual results were lower than those for Bayer bDNA, suggesting underquantification of this genotype. Testing of additional samples is required to definitively identify quantification bias.
A recent study (6) evaluated the genotype specificity of the Roche RT-PCR ASR assay by testing specimens with genotypes 1 through 5. For the 25 specimens tested, the Roche RT-PCR ASR assay gave viral loads that were 89.4% to 119% of the expected result. The samples were obtained from a commercial source, and the expected result was based on the viral load value provided by the company; their method of quantification was not reported. We may have seen more variation in quantification because a greater number of specimens were tested. Based on our data, it appears that significant underquantification (0.5 log10) is not systematic. Rather, it appears to occur in a small percentage of specimens.
In summary, the Roche and Abbott RT-PCR assays are sensitive and specific, with a broad linear range providing clinical utility for both diagnostic testing and therapeutic monitoring. Further studies are needed to assess the extent of underquantification of genotype 3 and 4 samples with the Roche RT-PCR assay and genotype 4 with the Abbott RT-PCRT assay. The variability in viral load values of clinical samples underscores the fact that different viral load assays should not be used interchangeably.
Acknowledgments
We thank Jessica Ingersoll, Mike Forman, Ann Roberto, Colleen Starkey, Salvatore Scianna, Aleksandra Danilovic, Heather A. Bentley, Maria Fernanda Sabato, and Ray Mills for their technical expertise in completing these studies. Reagent support for this work was provided by Abbott Laboratories, Bayer Diagnostics Corporation, and Roche Diagnostic Corporation.
This work was additionally supported by National Institutes of Health contract NO1-AI35172 to J.W.B., the Emory University Center for AIDS Research grant (A.M.C.), and NIH, Division of AIDS, NAID U01-AI-38858 (A.V. and R.P.).
REFERENCES
- 1.Barbeau, J. M., J. Goforth, A. M. Caliendo, and F. S. Nolte. 2004. Performance characteristics of a quantitative TaqMan hepatitis C virus RNA analyte-specific reagent. J. Clin. Microbiol. 42:3739-3746. [DOI] [PMC free article] [PubMed] [Google Scholar]
- 2.Bland, J. M., and D. G. Altman. 1986. Statistical methods for assessing agreement between two methods of clinical measurement. Lancet i:307-310. [PubMed] [Google Scholar]
- 3.Elbeik, T., J. Surtihadi, M. Destree, J. Gorlin, M. Holodniy, S. A. Jortani, K. Kuramoto, V. Ng, R. Valdes, Jr., A. Valsamakis, and N. A. Terrault. 2004. Multicenter evaluation of the performance characteristics of the Bayer VERSANT HCV RNA 3.0 assay (bDNA). J. Clin. Microbiol. 42:563-569. [DOI] [PMC free article] [PubMed] [Google Scholar]
- 4.Forman, M. S., and A. Valsamakis. 2004. Verification of an assay for quantification of hepatitis C virus RNA by use of an analyte-specific reagent and two different extraction methods. J. Clin. Microbiol. 42:3581-3588. [DOI] [PMC free article] [PubMed] [Google Scholar]
- 5.Fried, M. W., M. L. Shiffman, K. R. Reddy, C. Smith, G. Marinos, F. L. Goncales, Jr., et al. 2002. Peginterferon alfa-2a plus ribavirin for chronic hepatitis C virus infection. N. Engl. J. Med. 347:975-992. [DOI] [PubMed] [Google Scholar]
- 6.Konnick, E. Q., S. Williams, E. R. Ashwood, and D. R. Hillyard. 2005. Evaluation of the COBAS hepatitis C virus (HCV) TaqMan analyte-specific reagent assay and comparison to the COBAS Amplicor HCV Monitor V2.0 and Versant HCV bDNA 3.0 assays. J. Clin. Microbiol. 43:2133-2140. [DOI] [PMC free article] [PubMed] [Google Scholar]
- 7.Lee, S. S., E. J. Heathcote, K. R. Reddy, S. Zeuzem, M. W. Fried, T. L. Wright, P. J. Pockros, D. Haussinger, C. I. Smith, A. Line, and S. C. Pappas. 2002. Prognostic factors and early predictability of sustained viral response with peginterferon alfa-2a (40DK). J. Hepatol. 37:500-506. [DOI] [PubMed] [Google Scholar]
- 8.McHutchinson, J. G., S. C. Gordon, E. R. Schiff, M. L. Shiffman, W. M. Lee, V. K. Rustgi, Z. D. Goodman, M.-H. Ling, S. Cort, J. K. Albrecht, et al. 1998.Interferon alfa-2b alone or in combination with ribavirin as initial treatment for chronic hepatitis C. N. Engl. J. Med. 339:1485-1492. [DOI] [PubMed] [Google Scholar]
- 9.Poynard, T., J. G. McHutchison, Z. D. Goodman, M.-H. Ling, J. Albrecht, et al. 2000. Is an “a la carte” combination interferon alfa-2b plus ribavirin regimen possible for the first line treatment in patients with chronic hepatitis C. Hepatology 31:211-218. [DOI] [PubMed] [Google Scholar]
- 10.Yen-Lieberman, B., D. Brambilla, B. Jackson, J. Bremer, R. Coombs, M. Cronin, S. Herman, D. Katzenstein, S. Leung, H. J. Lin, P. Palumbo, S. Rasheed, J. Todd, M. Vahey, and P. Reichelderfer. 1996. Evaluation of a quality assurance program for quantification of human immunodeficiency virus type 1 RNA in plasma and AIDS Clinical Trials Group virology laboratories. J. Clin. Microbiol. 34:2695-2701. [DOI] [PMC free article] [PubMed] [Google Scholar]


