

Abstract
Objective: Develop a method to quantify the cross-sectional area of the pubic portion of the levator ani muscle, validate the method in women with unilateral muscle defects, and report preliminary findings in those women. Method: Multi-planar proton density magnetic resonance images of 12 women with a unilateral defect in the pubic portion of their levator ani were selected from a larger study of levator ani muscle anatomy in women with and without genital prolapse. Three-dimensional bilateral models of the levator ani were reconstructed (using 3-D Slicer, version 2.1b1) and divided into iliococcygeal and pubic portions. Muscle cross-sectional areas were calculated at four equally spaced locations perpendicular to a line drawn from the pubic origin to the visceral insertion using the I-DEASR® computer modeling software. Results: The cross-sectional area of the muscle on the side with the defect was smaller than the normal side at all the four locations. The average bilateral difference was up to 81% at location 1 (nearest pubic origin). Almost all of the volume difference (13.7%, P =0.0004) was attributable to a reduction in the pubic portion (24.6%, P <0.0001), not the iliococcygeal portion ( P =0.64), of the muscle. Conclusions: A method was developed to quantify cross-sectional area of the pubic portion of the levator ani perpendicular to the intact muscle direction. Significant bilateral cross-sectional area differences were found between intact and defective muscles in women with a unilateral defect.
Keywords: Levator ani, Muscle, Injury, Cross-sectional area, MR image, 3-D reconstruction
1. Introduction
Pelvic organ prolapse and urinary incontinence can be debilitating problems, with one in nine women [1] facing the probability of surgery during their lifetime for these problems. Although the disease mechanism responsible for organ prolapse is not fully understood, injury and deterioration of muscle, nerve and connective tissue are believed to play a role in altering normal pelvic organ function [2-5]. Visible defects of levator ani muscle have been observed in MR images of women after vaginal delivery [6] and also women with pelvic floor dysfunction [7-9].
The maximum force developed by skeletal muscle is related to its cross-sectional area measured perpendicular to muscle fascicle direction and ranges from 4 to 8 kgf/cm2 [10,11]. Therefore the cross-sectional area measurement perpendicular to muscle fascicle direction is an important morphological determinant of muscle capacity. The levator ani muscle has a complex shape with the muscle fibers in the pubic portion of the levator ani muscle running in a different direction than those in the iliococcygeal muscle [12-14]. Therefore, the two regions must be separated prior to cross-sectional area measurements. Also, the muscle fibers do not run perpendicular to standard MR scan slices, so levator cross-sectional area measurements cannot be properly performed on standard 2-D MR images.
The goal of this study was to first develop a method for quantifying the cross-sectional area of pubic portion of the levator ani muscle perpendicular to its muscle fascicle direction. Then, the method was used to quantify the loss in cross-sectional area in women with visible unilateral levator ani defects by comparing normal muscle on one side with abnormal muscle on the other side in the same individual. To validate this new method, the null hypotheses were tested that there would be no difference in cross-sectional area between the defect and normal sides, nor would there be a difference in cross-sectional area along the length of the muscle.
2. Methods
A convenience sample of 12 women with a unilateral levator ani muscle defect was selected from an IRB-approved study comparing muscle anatomy in women with prolapse and women with normal pelvic organ support. The prolapse patients were recruited through the University of Michigan Urogynecology Clinic. The controls were recruited through advertisements as well as through the Women's Health Registry. Patients were excluded if they had previous surgery for prolapse or incontinence, genital anomalies, or had delivered in the past year. Women with visible unilateral defects in the pubic portion of the levator ani muscle on MR imaging were selected so that, within the same individual, normal muscle morphology on one side could be compared with abnormal muscle morphology on the other side (Fig. 1). This approach circumvents the problem of inter-individual differences in muscle appearance and bulk. Among the 12 women who were selected, five had prolapse of one vaginal wall or cervix at least 1 cm below the hymen; seven had normal support of all pelvic structures with no vaginal wall lower than 1 cm above the hymen as assessed by clinic evaluation (POP-Q [15]). The average age was 56.2 ± SD 11.9 years and average BMI was 27.3 ± SD 4.0 kg/m2. Parity ranges from one to six vaginal deliveries with a median of three.
Figure 1.
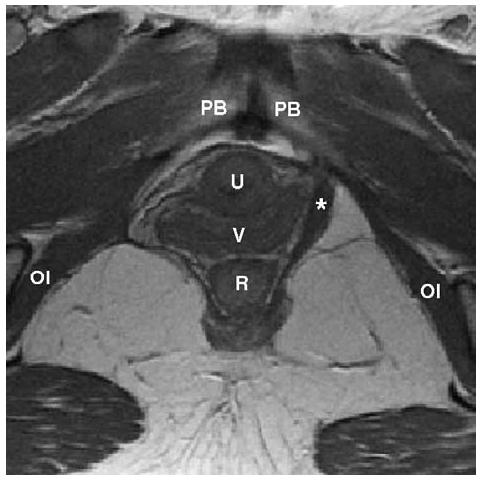
Axial proton density MR image of a woman with a right unilateral defect. The left levator ani muscle is intact (denoted by *) while the right side portion of the muscle is missing. PB denotes pubic bone; U: urethra; V: vagina; R: rectum; OI: obturator internus muscle.
Ten additional women with normal intact levator ani muscles on MR images were selected as a control group to validate the method. Five had prolapse and five had normal pelvic organ support. The average age was 62.5 ± SD 3.34 years and average BMI was 27.5 ± SD 5.0 kg/m2. Parity ranges from one to six with a median of three.
Multi-planar, two-dimensional, fast spin, proton density MR images (echo time 15 ms, repetition time 4000 ms) were obtained using of a 1.5 T superconducting magnet (General Electric Signa Horizon LX, GE Medical System, Milwaukee, Wis) with version 9.1 software. The axial and coronal fields of view were each 16 × 16 cm while in the sagittal images, it was 20 × 20 cm. All three views had slice thicknesses of 4 mm with a 1 mm gap between slices.
Axial, sagittal and coronal MR images were imported into a three-dimensional (3-D) imaging program (3-D Slicer, version 2.1b1, Brigham and Women's Hospital, Boston, MA) and aligned using anatomic landmarks (arcuate pubic ligament, pubic bone, pubic symphysis, etc.). 3-D volume-rendering models were generated from axial and coronal planes and then imported into I-DEAS version 9.0 (UGS, Plano, TX), an engineering graphics program (Fig. 2A).
Figure 2.
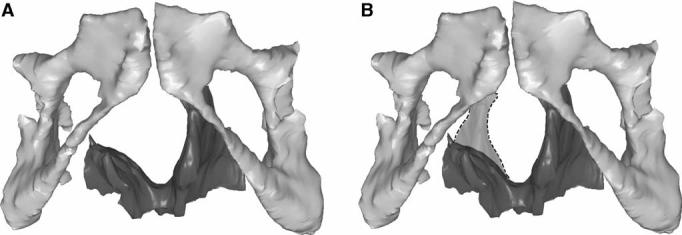
(A) Reconstructed 3-D model showing the pubic bone and levator ani muscle with a right unilateral defect. (B) The dashed region shows the expected location of the missing muscle after reflecting the muscle from the normal side across the midline.
The levator ani was separated in the midline and then designated as either “normal” or “defective” side. Within 12 women, five had defective muscles on the left side and seven had defective right sided muscles. A model of the normal muscle (dashed outline) was reflected about the mid-sagittal plane and superimposed on the contralateral defective side in order to visualize the area of missing muscle (Fig. 2B).
The pubic portion of the levator ani muscle was separated from the iliococcygeal portion by establishing a dividing plane through three anatomical landmarks identified independent of muscle presence or absence (Figs. 3 and 4). One middle landmark was defined as the upper aspect of the puborectalis “bump” [16] on the mid-sagittal slice (Fig. 3a). Two lateral landmarks for the plane were defined as the most medial origin of the iliococcygeus from the arcus tendineus levator ani (ATLA) (Fig. 3b and c).
Figure 3.

Separating the pubic portion of levator ani from the iliococcygeus portion on MR scans. A): Identification of the middle point (triangle) on the mid-sagittal MRI; B) and C): identification of the two lateral points on MRI (cross and diamond). The following structures were identified in MRI to help for orientation. PS denotes pubic symphysis; PB: pubic bone; B: bladder; A: anus; OI: obturator internus; U: uterus (with fibroids); PRM: puborectalis muscle. ICM: iliococcygeus muscle.
Figure 4.
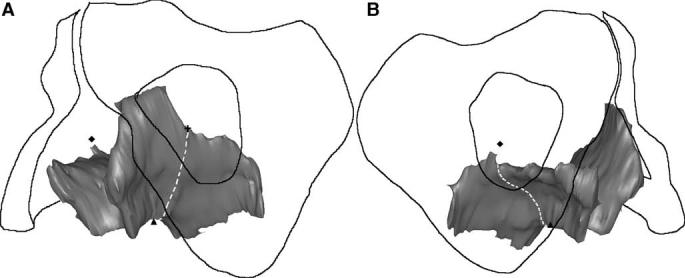
3-D view of the separation of the pubic portion from the iliococcygeal portion of the levator ani. The dashed line represents the plane of separation, while the triangle, cross and diamond have the same meaning as in the preceding figure.
There is evidence that the pubic portion of the levator ani has muscle fascicles oriented parallel to the line-of-action of the muscle between its origin and insertion [17]. The fascicle direction was not directly observable on the MR scans, so it was approximated by establishing a line between the middle of the origin point and the center of the insertions using anatomic landmarks. These landmarks were chosen to be independent of muscle presence or absence, and were based on anatomical literature [13], MR imaging [16] and the senior author's dissection experience. The muscle origins were defined in axial MR images as being 1.5 cm above the arcuate pubic ligament, and 0.2 cm medial from the obturator internus insertion on the left and right pubic rami. The insertion points were defined bilaterally in the sagittal plane as the center of the intersphincteric groove on slices 0.5 cm lateral to the mid-sagittal slice (Figs. 5 and 6).
Figure 5.

Reference points for determining fiber direction in the pubic portion of the levator ani. A) Origin points on axial MR at its junction with obturator internus (OI) as open circle on patient's left and filled circle on patient's right; B) and C) right (filled square) and left (open square) insertion point on sagittal MR scans. The following structures are identified aid orientation. PB: pubic bone; B: bladder; V: vagina; R: rectum; A: anus.
Figure 6.
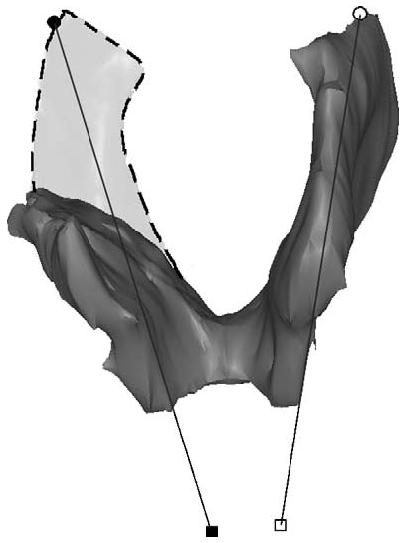
Lines connecting the origin and insertion points (see preceding figure) were used to estimate muscle fiber direction. The dashed region shows the expected location of the muscle on the defective side, were it intact.
Using I-DEAS, five equally spaced cross-sectional were made perpendicular to the fiber direction line and were numbered from ‘1’ at the pubic origin to ‘5’ at the insertion end (Fig. 7). Since location 5 lay dorsal to the edge of the muscle, cross-sectional areas were only calculated bilaterally for locations 1–4. Fig. 7 shows a graphical demonstration of the sequence of steps used to quantify the unilateral levator ani muscle loss. Two-sided paired t-tests were used to compare for bilateral differences in cross-sectional area and volume, with P <0.05 being considered statistically significant.
Figure 7.

Methodological steps to quantify levator ani muscle loss in a subject with a unilateral defect. A: Frontal view of the 3-D reconstruction model of levator ani was built. B: The pubic portion is separated from the iliococcygeal portion; here only the pubic portion is shown. C: The line of estimated fiber direction of the pubic portion was determined. Equally spaced cutting planes perpendicular to the fiber direction line were placed. D: The resulting cross-sections are shown. Cross-sectional areas were then calculated. Due to the defect on the right, muscle is not present at location 1; therefore, it is not shown.
One might hypothesize that the fiber direction of the remaining muscle could change due to the presence of the defect and the use of the normal fiber direction may cause some error in estimation of the cross-sectional area of the remaining muscle. Therefore, a secondary analysis was performed by curving and rotating the normal muscle fiber direction line to best fit the remaining muscle model. The cross-sectional area perpendicular to remaining muscle fiber direction was compared with the initial results using a paired t-test (Fig. 8).
Figure 8.
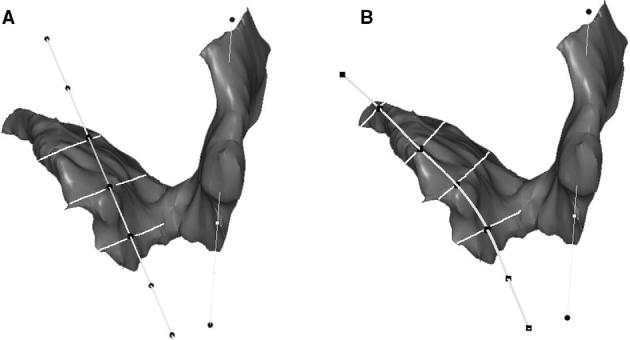
A: Cross-sectional area perpendicular to ‘normal’ muscle direction; B: Cross-sectional area perpendicular to remaining muscle direction.
The volumes of both the pubic portion and iliococcygeal portion of levator ani muscle on the normal and defective sides were also calculated as a secondary outcome.
3. Results
In the 10 women with normal levator ani muscle, there was not a significant difference between left and right cross-sectional areas at any location (Table 1).
Table 1.
Comparison of mean ± standard error of the mean cross-sectional area (CSA) in cm2 of left and right side in ten women with normal muscle
| Location 1 | Location 2 | Location 3 | Location 4 | |
|---|---|---|---|---|
| CSA of left side (cm2) | 1.30 ± 0.20 | 2.26 ± 0.15 | 2.84 ± 0.11 | 2.62 ± 0.21 |
| CSA of right side (cm2) | 1.20 ± 0.25 | 2.23 ± 0.17 | 2.71 ± 0.14 | 2.74 ± 0.19 |
| P-value | 0.43 | 0.84 | 0.35 | 0.42 |
In the women with a unilateral defect, the defective side had a significantly smaller muscle cross-sectional area at each location in the pubic portion of the levator ani (Fig. 9). However, the extent of the cross-sectional area loss differed depending on location. The largest mean cross-sectional area loss (81%, P = 0.0002) was near the pubic origin (location 1), while near the insertion (location 4) the loss in mean cross-sectional area was not statistically significant (13.5%, P = 0.1987; post hoc power = 25%).
Figure 9.
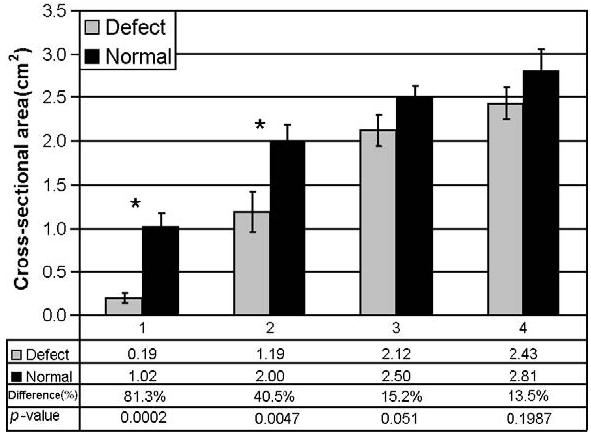
Bilateral comparison of muscle cross-sectional area of pubic portion of levator ani muscle perpendicular to its fiber direction. Bars are standard error and * denotes P <0.05.
There was no statistically significant difference in the cross-sectional areas calculated using the “normal” fiber direction compared to the fitted remaining fiber direction (Table 2), thereby validating the use of the “normal” fiber direction on the defective side.
Table 2.
Comparison of mean ± standard error of the mean cross-sectional area (CSA) in cm2 calculated using “normal” fiber direction with that calculated using remaining fiber direction
| Location 1 | Location 2 | Location 3 | Location 4 | |
|---|---|---|---|---|
| CSA perpendicular to ‘normal’ muscle direction | 0.19 ± 0.06 | 1.19 ± 0.23 | 2.12 ± 0.19 | 2.43 ± 0.18 |
| CSA perpendicular to remaining muscle direction | 0.24 ± 0.10 | 1.15 ± 0.20 | 2.09 ± 0.20 | 2.31 ± 0.20 |
| P-value | 0.24 | 0.33 | 0.60 | 0.42 |
The overall volume of the levator muscle was 13.69% smaller on the defective side (17.96 ± 1.4 cm3 ) than on the normal side (20.81 ± 1.35 cm3, P = 0.0004). This was primarily attributable to a reduction in the pubic portion of levator ani muscle (defective side: 9.16 ± 0.83 cm3; normal side: 12.19 ± 0.71 cm3, a 24.6% volume reduction, P <0.0001), while the iliococcygeal portions were not significantly different (defective side: 8.80 ± 1.25 cm3; normal side: 8.62 ± 1.12 cm3, P = 0.64, post hoc power = 7%).
4. Discussion
This new method allows levator ani muscle cross-sectional area to be measured perpendicular to the fascicle direction, which was assumed parallel to the line-of-action of the pubic portion of the levator ani muscle. This is important because maximum muscle strength is proportional to cross-sectional area, not thickness or volume. Since it was demonstrated that there was no bilateral difference in cross-sectional area in normal pubic portion of the levator ani muscle, having a normal muscle on one side and a visibly defective muscle on the other side within the same individual offers a unique opportunity to validate the method's capability for detecting the magnitude of any bilateral cross-sectional area differences.
Since the levator ani muscle damage usually appears in localized regions, and more often in the pubic portion rather than in the iliococcygeal portion [6], focus was placed on quantifying the cross-sectional area in the pubic portion to increase the sensitivity of the method for identifying muscle defects. The finding of a smaller volume in the pubic portion, but not in the iliococcygeal portion, shows that our method of separating the two parts of the muscle was effective in isolating the defective area.
Muscle fascicle direction in the pubic portion was determined independent of muscle presence by identifying muscle origin and insertion. A smaller cross-sectional area was found in the defective muscle near the pubic origin corresponding to the anatomical location of the visible MR defect. Since no visible defects were evident in the iliococcygeus muscle, calculations of its cross-sectional area were omitted for the sake of brevity.
Several techniques have been used to quantify levator ani muscle morphology. Bernstein used perineal ultrasonography to visualize and measure the thickness of levator ani muscle [18]. However, because image resolution was limited, it is not clear which portion of the levator ani muscle was measured or what angle of fiber direction was used. Aukee et al. measured the thickness of the distal part of the pubococcygeal in static axial MR image and found it to be significantly correlated with EMG values during a maximal contraction [19]. This measurement only reflects one dimension of the muscle and the relationship of this dimension to fiber direction is not known. Hoyte et al. quantified the levator ani muscle volume and levator ani angle using 3-D reconstructed models [20]. Although volumetric techniques can provide a measurement of morphologic change, quantifying muscle cross-sectional area normal to its assumed fascicle direction, as done in this study, is more appropriate from a biomechanical perspective. The smaller the muscle cross-sectional area, the smaller the maximum contractile force it can develop in that region. Volume results are provided in this paper in case it is later found that the pennation angle of the pubic portion of levator ani muscle fibers is non-zero. In that case, the physiological cross-sectional area of the muscle can be found by dividing the volume by the product of muscle fiber length times the cosine of the pennation angle.
The complex shape and fiber arrangement of the levator ani muscle precludes useful measurements of the muscle being made in standard MR imaging planes (i.e., axial, sagittal and coronal plane slices) because slice angle variation in 2-D static MRI scans can cause measurement variations of up to 15% [21]. Therefore 3-D reconstruction and establishment of muscle fascicle direction in 3-D space is preferred for cross-sectional area measurements aimed at estimating the maximum potential to develop muscle force.
There were several challenges in developing this measurement method. The first was in separating the levator ani into two portions. There are some small regions of the muscle where the iliococcygeal and the pubic portions overlap, for example, behind the rectum. [12] Therefore separation of the pubic and iliococcygeal portions of the muscle did not preclude the possibility for inclusion of a small portion of the iliococcygeal muscle in the pubic portion, and vice versa. Further refinements in the technique may allow more accurate separations to be made in the future.
Identification of muscle fascicle direction was also a challenge. It was not possible, at present, to consistently see individual fascicles or fibers within the pubic portion of the levator. The straight line used to approximate muscle fascicle direction from the muscle origin to insertion point allows one to circumvent this problem. However, some muscle fibers did not follow this approximate fiber direction. For example, cross-sectional areas calculated at location 4 were not strictly perpendicular to the fiber direction as some fibers cross the midline at this point. This problem did not affect locations 1, 2 or 3. There was also concern that a defect might also affect the remaining fiber direction; however, the results showed that the differences in measurements using an alternative assumption for fiber direction were not statistically significant (Table 2).
This method for measuring muscle cross-sectional area should help investigators assess one morphological, and hence biomechanical, feature of the levator ani muscle. For example, this type of approach may yield insights into the role of levator ani muscle defects in the development of pelvic floor dysfunction. The method was validated using women with unilateral defects and can be applied to patients with both normal muscles and injured muscles.
Acknowledgment
The support of a grant from NICHD (R01 HD-38665) is gratefully acknowledged.
References
- 1.Olsen AL, Smith VJ, Bergstrom JO, Colling JC, Clark AL. Epidemiology of surgically managed pelvic organ prolapse and urinary incontinence. Obstet Gynecol. 1997;89:501–6. doi: 10.1016/S0029-7844(97)00058-6. [DOI] [PubMed] [Google Scholar]
- 2.Boreham MK, Wai CY, Miller RT, Schaffer JL, Word RA. Morphometric analysis of smooth muscle in the anterior vaginal wall of women with pelvic organ prolapse. Am J Obstet Gynecol. 2002;187:56–63. doi: 10.1067/mob.2002.124843. [DOI] [PubMed] [Google Scholar]
- 3.Boreham MK, Wai CY, Miller RT, Schaffer JL, Word RA. Morphometric properties of the posterior vaginal wall in women with pelvic organ prolapse. Am J Obstet Gynecol. 2002;187:1501–9. doi: 10.1067/mob.2002.130005. [DOI] [PubMed] [Google Scholar]
- 4.Takano CC, Girao MJ, Sartori MG, Castro RA, Arruda RM, Simoes MJ, et al. Analysis of collagen in parametrium and vaginal apex of women with and without uterine prolapse. Int Urogynecol J. 2002;13(6):342–5. doi: 10.1007/s001920200076. [DOI] [PubMed] [Google Scholar]
- 5.Smith ARD, Hosker GL, Warrell DW. The role of partial denervation of the pelvic floor in the etiology of genitourinary prolapse and stress incontinence of urine: a neurophysiologic study. Br J Obstet Gynaecol. 1989;96:24–8. doi: 10.1111/j.1471-0528.1989.tb01571.x. [DOI] [PubMed] [Google Scholar]
- 6.DeLancey JO, Kearney R, Chou Q, Speights S, Binno S. The appearance of levator ani muscle abnormalities in magnetic resonance images after vaginal delivery. Obstet Gynecol. 2003;101(1):46–53. doi: 10.1016/s0029-7844(02)02465-1. [DOI] [PMC free article] [PubMed] [Google Scholar]
- 7.Kirschner-Hermanns R, Wein B, Niehaus S, Schaefer W, Jakse G. The contribution of magnetic resonance imaging of the pelvic floor to the understanding of urinary incontinence. Br J Urol. 1993;72:715–8. doi: 10.1111/j.1464-410x.1993.tb16254.x. [DOI] [PubMed] [Google Scholar]
- 8.Tunn R, Paris S, Fischer W, Hamm B, Kuchinke J. Static magnetic resonance imaging of the pelvic floor muscle morphology in women with stress urinary incontinence. Neurourol Urodyn. 1998;17(6):579–89. doi: 10.1002/(sici)1520-6777(1998)17:6<579::aid-nau2>3.0.co;2-r. [DOI] [PubMed] [Google Scholar]
- 9.Singh K, Jakab M, Reid WM, Berger LA, Hoyte L. Three-dimensional magnetic resonance imaging assessment of levator ani morphologic features in different grades of prolapse. Am J Obstet Gynecol. 2003;188(4):910–5. doi: 10.1067/mob.2003.254. [DOI] [PubMed] [Google Scholar]
- 10.Ikai M, Fukunaga T. Calculation of muscle strength per unit cross-sectional area of human muscle by means of ultrasonic measurement. Int Z Angew Physiol Einschl Arbeitsphysiol. 1968;26(1):26–32. doi: 10.1007/BF00696087. [DOI] [PubMed] [Google Scholar]
- 11.Ikai M, Fukunaga T. A study on training effect on strength per unit cross-sectional area of muscle by means of ultrasonic measurement. Int Z Angew Physiol Einschl Arbeitsphysiol. 1970;28(3):173–80. doi: 10.1007/BF00696025. [DOI] [PubMed] [Google Scholar]
- 12.Lawson JO. Pelvic anatomy: I. Pelvic floor muscles. Ann R Coll Surg Engl. 1974;54:244–52. [PMC free article] [PubMed] [Google Scholar]
- 13.Kearney R, Sawhney R, DeLancey JO. Levator ani muscle anatomy evaluated by origin-insertion pairs. Obstet Gynecol. 2004;104(1):168–73. doi: 10.1097/01.AOG.0000128906.61529.6b. [DOI] [PMC free article] [PubMed] [Google Scholar]
- 14.Singh K, Reid WM, Berger LA. Magnetic resonance imaging of normal levator ani anatomy and function. Obstet Gynecol. 2002;99(3):433–8. doi: 10.1016/s0029-7844(01)01743-4. [DOI] [PubMed] [Google Scholar]
- 15.Bump RC, Mattiasson A, Bo K, Brubaker LP, DeLancey JO, Klarskov P, et al. The standardization of terminology of female pelvic organ prolapse and pelvic floor dysfunction. Am J Obstet Gynecol. 1996;175(1):10–7. doi: 10.1016/s0002-9378(96)70243-0. [DOI] [PubMed] [Google Scholar]
- 16.Strohbehn K, Ellis JH, Strohbehn JA, DeLancey JOL. Magnetic resonance imaging of levator ani with anatomic correlation. Obstet Gynecol. 1996;87(2):277–85. doi: 10.1016/0029-7844(95)00410-6. [DOI] [PubMed] [Google Scholar]
- 17.Janda S, van der Helm FC, de Blok SB. Measuring morphological parameters of the pelvic floor for finite element modelling purposes. J Biomech. 2003;36(6):749–57. doi: 10.1016/s0021-9290(03)00008-3. [DOI] [PubMed] [Google Scholar]
- 18.Bernstein IT. The pelvic floor muscles: muscle thickness in healthy and urinary-incontinent women measured by perineal ultrasonography with reference to the effect of pelvic floor training. Estrogen receptor studies. Neurourol Urodyn. 1997;16(4):237–75. doi: 10.1002/(sici)1520-6777(1997)16:4<237::aid-nau2>3.0.co;2-f. [DOI] [PubMed] [Google Scholar]
- 19.Aukee P, Usenius JP, Kirkinen P. An evaluation of pelvic floor anatomy and function by MRI. Eur J Obstet Gynecol Reprod Biol. 2004;112(1):84–8. doi: 10.1016/s0301-2115(03)00327-0. [DOI] [PubMed] [Google Scholar]
- 20.Hoyte L, Schierlitz L, Zou K, Flesh G, Fielding JR. Two-and 3-dimensional MRI comparison of levator ani structure, volume, and integrity in women with stress incontinence and prolapse. Am J Obstet Gynecol. 2001;185(1):11–19. doi: 10.1067/mob.2001.116365. [DOI] [PubMed] [Google Scholar]
- 21.Hoyte L, Ratiu P. Linear measurements in 2-dimentional pelvic floor imaging: the impact of slice tilt angles on measurement reproducibility. Am J Obstet Gynecol. 2001;185:537–44. doi: 10.1067/mob.2001.116751. [DOI] [PubMed] [Google Scholar]