

Abstract
Alternative splicing (AS) of pre-messenger RNA is a major mechanism for generating protein diversity from a limited number of genes in higher eukaryotes, and it constitutes a central mode of genetic regulation. Thus, efficient methods are needed to systematically identify new AS events at a genomic scale across different tissues, stages of development, and physiological or pathological conditions in order to better understand gene expression. To fulfill this goal, we have designed the ASEtrap, which is a cloning procedure for producing AS libraries that is based on a single-stranded trap consisting of an ssDNA-binding protein. In this paper, we have applied our approach to the construction of an AS library and a Control library from human placenta. By analyzing 9226 and 9999 sequences of the AS and Control libraries, respectively, we show that internal AS events (events that can be identified by the sole resources provided by either the AS or the Control library) and the discovery rate of new AS events measured at early stages of sequencing were nine to 10 times higher in the former than in the latter. Moreover, by performing a search for new AS events within a group of 162 known drug target genes, we identified six new events in six genes, and we observed that they all were discovered exclusively through the AS library. Thus, it appears that ASEtrap has the potential to greatly facilitate the determination of the total complement of splice variants expressed in human, as well as other organisms.
Alternative pre-mRNA splicing is a major contributor to protein diversity in metazoan organisms (Lopez 1998; Black 2000; Graveley 2001). It is especially common in mammals, where 40%–80% of the genes are estimated to have more than one splice form (Mironov et al. 1999; Croft et al. 2000; Kan et al. 2001; Lander et al. 2001; Modrek et al. 2001; Lee and Wang 2005). Alternative splicing (AS) is a tightly regulated phenomenon, and the patterns of AS can be specific to tissue, developmental stage, physiological condition, or pathological state (Caceres and Kornblihtt 2002; Stamm 2002; Black 2003; Black and Grabowski 2003; Lareau et al. 2004; Lynch 2004). The importance of AS is further illustrated by the increasing number of human diseases that have been attributed to mis-splicing events (Krawczak et al. 1992; Faustino and Cooper 2003).
Given the importance and prevalence of AS in mammals, it is apparent that studies characterizing mammalian transcriptomes must incorporate efforts to systematically identify new splice variants on a genomic scale. Four different strategies have been applied toward this goal. Full-length cDNA sequencing projects are considered the gold standard for defining the transcriptional state of a cell (Strausberg et al. 1999; Zavolan et al. 2003). However, these sequencing-based approaches are labor-intensive and expensive, and the characterization of transcripts across all physiological or disease states, tissues, and stages of development remains a distant goal. The second approach is based on bioinformatics analyses of expressed sequence tags (EST) (Kan et al. 2001; Modrek et al. 2001; Modrek and Lee 2002; Haas et al. 2003). Although these analyses have provided evidence for a vast number of alternative isoforms, this approach is hampered by significant limitations as a result of differences in protocols, by transcript end bias, and by limited tissue coverage. Moreover, it is hard to discover new variants that are expressed at low levels because they are less likely to be cloned during construction of the EST libraries. The third approach, which consists of analyzing gene expression of RNA or cDNA samples with high-density oligonucleotide microarrays, has been implemented successfully in a variety of ways (Castle et al. 2003; Johnson et al. 2003; Lee and Roy 2004). However, this approach has drawbacks too, including the fact that sequences of novel isoforms are not specified and detection of AS events requires differential expression of splice variants. The fourth strategy consists of developing experimental methods to selectively clone alternatively spliced sequences from biological samples in order to produce alternative AS libraries. One such method recently has been described (Watahiki et al. 2004). Here, we present a new cloning procedure for production of AS libraries, called ASEtrap, that is based on a single-stranded trap consisting of an ssDNA-binding protein. By coupling this trap with a large-scale sequencing and informatics capacity, this method can be implemented in a high-throughput manner to systematically characterize the alternative splice forms of transcripts in different physiological situations in a cost-effective manner.
Results
Preparation of an AS library from human placenta
In order to test the effectiveness of the ASEtrap, we prepared an AS library from human placenta. The procedure starts by converting total RNA from human placenta to double-stranded cDNA using the SMART PCR cDNA synthesis technology (Fig. 1). The double-stranded cDNA is then cleaved into small fragments of ∼100–500 bp with RsaI. This fragmentation step with the restriction enzyme has two functions. First, it produces DNA fragments with sizes suitable for sequencing in a single pass. Second, because each DNA molecule of a given cDNA species is cut at the same sites, most of the renatured DNA molecules that will form after the denaturation and renaturation steps will have blunt ends that will be ready to receive the adaptor (see below). The fragmented DNA mixture, referred to hereafter as the M0 mixture, is now ready to enter the ASEtrap procedure per se.
Figure 1.

The ASEtrap procedure (see text).
The M0 mixture is first subjected to a denaturation–renaturation reaction. The resulting mixture, called M0.1, is composed of various types of DNA molecules. Type 1 corresponds to fully blunt-ended homoduplex DNA molecules that form when two complementary strands of the same restriction fragment anneal. Type 2 corresponds to fully blunt-ended heteroduplex DNA molecules containing internal single-stranded regions. These molecules form when a strand corresponding to a restriction fragment encompassing an AS event anneals to the complementary strand displaying a sequence difference introduced by the AS event. Other duplex types will fail subsequent enrichment or amplification steps and will not be considered further. After the denaturation–renaturation reaction, an adaptor sequence is ligated to the blunt ends of the newly formed DNA molecules, which allows only those molecules that have blunt ends on both sides to be amplified later in the protocol by PCR.
The resulting ligation reaction, called M0.2, is next incubated with a recombinant Escherichia coli single-stranded DNA binding protein (SSBP) equipped with a histidine tag (Histag-SSBP). Because of the high affinity and specificity of the E. coli SSBP for single-stranded DNA (Meyer and Laine 1990), stable complexes form between the Histag-SSBP and type 2 molecules, but not with type 1 molecules, as the result of the single-stranded regions present in the former but absent from the latter. Once formed, the Histag-SSBP/DNA complexes are purified by nickel affinity chromatography. This mixture, called M1, is enriched in type 2 molecules, but it is depleted in type 1 molecules relative to M0.2. The M1 mixture then is amplified by PCR using an adaptor-specific primer. Since only type 1 and 2 DNA molecules can be efficiently amplified during the PCR reaction, the resulting amplified mixture called M1.1 is depleted in sequences originating from other duplex types. Finally, the adaptor sequence is removed from the ends of the DNA fragments of the M1.1 mixture by redigestion with RsaI.
This first selection cycle generates a new mixture, called MI, that is enriched in molecules originating from type 2 molecules and hence in AS events. At this stage, depending on whether the enrichment in AS events is sufficient, the MI mixture either can be cloned into an AS library or subjected to one or more additional enrichment cycles. Based on an experimental assessment of the enrichment level (see below), we decided to perform two more enrichment cycles as described above. The DNA mixtures recovered at the end of the second and third enrichment cycles were called MII and MIII, respectively.
To assess the enrichment in AS events after each cycle of the ASEtrap procedure experimentally, we determined by PCR the relative abundance in M0, MI, MII, and MIII of two restriction fragments encompassing an AS event known to affect the deionidase mRNA in human placenta (Ohba et al. 2001). We also analyzed a restriction fragment of the β-actin cDNA for which no alternative splicing is documented (Fig. 2). We observed an abrupt increase (∼30-fold) of the deionidase gene fragments in MI relative to M0 but no further increase in MII and MIII. In contrast, the β-actin fragment decreased slightly after the first enrichment cycle (∼15%), but it continued to decrease after the second and third cycles, resulting in ∼50% and ∼90%, respectively, less actin. These results suggested that the ASEtrap procedure was efficient at selecting AS events, but that three enrichment cycles were necessary to efficiently reduce the pool of DNA fragments not associated with AS events. We then cloned the DNA fragments of the MIII mixture in order to obtain an AS library. A Control library was also produced by cloning the DNA fragments of the initial M0 mixture.
Figure 2.

Experimental assessment of enrichment in AS events. (A) schematic representation of (1) hDII(a) and hDII(b) cDNAs, the two variants of the human type II iodothyronine deionidase gene generated by an alternative splicing event occurring in human placenta (Ohba et al. 2001); (2) the β-actin cDNA. Black vertical arrows show the RsaI restriction sites whose cleavage produces the restriction fragments (RF1, RF2, and RF3) that were monitored by PCR in the M0, MI, MII, and MIII mixtures (see below). Primer positions for PCR are indicated by gray horizontal arrows, and amplification products are indicated by bars. hDII(b) differs from hDII(a) by an additional 108-nt-long exon (black box). (B) PCR assessment of the relative abundance within the M0, MI, MII, and MIII mixtures of the two hDII restriction fragments RF1 and RF2. Four PCR reactions were performed with 4 ng of template DNA from the M0, MI, MII, and MIII mixtures using primers P1 and P2. Six-microliter aliquots were taken from the PCR reactions after 22, 24, and 30 amplification cycles and electrophoresed in a 1.2% agarose gel. Two PCR products of the expected size were amplified. Densitometry revealed a 30-fold increase in these products in lanes MI, MII, and MIII relative to M0. (C) PCR assessment of the relative abundance within the M0, MI, MII, and MIII mixtures of the β-actin restriction fragments RF3. Four PCR reactions were performed with 4 ng of template DNA from the M0, MI, MII, and MIII mixtures using primers P3 and P4. Eight-microliter aliquots were taken from the PCR reactions after 22 amplification cycles and electrophoresed in a 1.2% agarose gel. A PCR product of the expected size was amplified, and densitometry revealed that its abundance decreased ∼15%, 50%, and 90% in MI, MII, and MIII relative to M0.
Sequencing and redundancy analysis of the AS and Control libraries
Individual clones were isolated from both libraries and subjected to sequencing. We obtained good sequences for 14,934 and 14,976 clones, respectively, from the Control and AS libraries. Following the nomenclature used by Watahiki et al. (2004), sequences from AS and Control libraries are hereafter referred to as ASSETs (alternative splicing sequence-enriched tags) for the former and as ESTs for the latter.
ASSETs from the AS library and ESTs from the Control library were clustered using a genome-based clustering strategy (see Methods). Whereas about the same number of ASSETs (9226) and ESTs (9999) could be aligned on the genomic DNA (see Methods), the ASSETs formed fewer clusters (2270) than the ESTs (5749), which indicated there was a higher redundancy of the AS library (see Table 1). We considered this result to be a good sign regarding the effectiveness of the ASEtrap procedure. Indeed, ASEtrap focuses not so much on genes that are subjected to AS events but, more precisely, on those restriction fragments within these genes that encompass AS events. Hence, owing to the bias it introduces in favor of certain precise locations within the expressed genome, ASEtrap is expected, when applied to tissues, such as placenta, that are characterized by a high complexity of their mRNAs pools, to reduce the dispersion and enhance the redundancy of the libraries it produces. The size distribution of the clusters within the two libraries is shown in Table 2. More information related to the redundancy of the Control and AS libraries is presented as Supplemental material.
Table 1.
Redundancy analysis of the AS and Control libraries
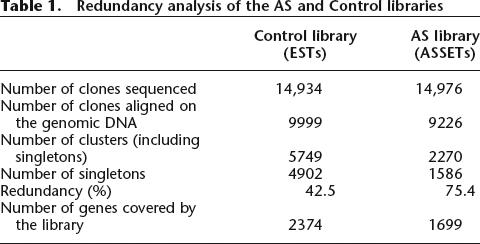
Table 2.
Size distribution of the clusters
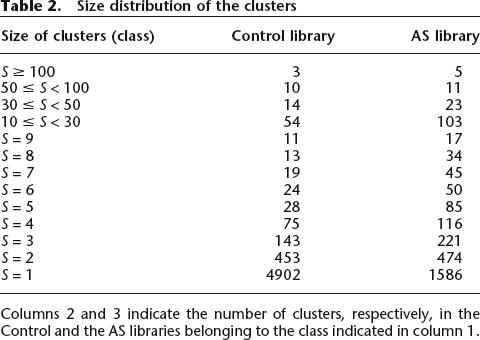
Columns 2 and 3 indicate the number of clusters, respectively, in the Control and the AS libraries belonging to the class indicated in column 1.
Search for internal AS events
We define internal AS (iAS) events as events that can be identified with the sole resources provided by either the Control or the AS library, as opposed to events whose identification requires comparison with external resources, such as those given by public cDNA databases. In order to detect and characterize iAS events, we developed a semiautomatic procedure involving first a computational step aiming at differentiating the clusters where no iAS event could possibly be found from the ones where such events could be found, followed by a manual step whereby the latter were inspected by human expertise for the presence of one or more genuine iAS events. Details concerning this two-step procedure can be found in the Methods section.
The manual step of the above search procedure is significantly more labor-intensive with regard to the detection of alternative 5′ or 3′ splice site (5′/3′-ASS) events and, to a lesser degree, for intron retention events, than it is for the detection of exon-cassette (EC) events. While the latter can be readily spotted by a visual inspection for a given cluster, the former require a systematic intron length analysis and thus an effort proportional to the total number of sequences (see Methods). As a consequence, we decided to perform an exhaustive search only for clusters having size ranging from two to nine sequences (space S2–9) but to limit our search only to EC events for all clusters having size greater than nine (space S>9). Data related to the composition of these two spaces, as well as the space of singletons within each library, are shown in Figure 3.
Figure 3.

Space composition of the Control and AS libraries. For each space, the number of ESTs and ASSETs (in bold characters) and the corresponding number of clusters (in italic and in parentheses) are indicated. The areas of the spaces are proportional to the number of ESTs or ASSETs, not to the number of clusters.
The above strategy gave us access to the total content in internal EC events of both libraries (see Table 3). We found 18 and 189 such events within the Control and AS libraries, respectively, indicating that there was at least a 10-fold enrichment of internal EC events in the AS library over the Control library. As for the exhaustive search performed within spaces S2–9, we found at least 12 times more iAS events in space S2–9 of the AS library than in the same space of the Control library (248 vs. 20), which confirms the effectiveness of the ASEtrap procedure (Table 3). When looking at how these events were distributed with regard to AS event typology, we found that EC events represented, respectively, 50% (10 out of 20) and 54% (134 out 248) of the total number of events found within spaces S2–9 of the Control and AS libraries.
Table 3.
Results of the search for iAS events

(EC) Exon cassette; (5′-ASS) alternative 5′-splice site event; (3′-ASS) alternative 3′-splice site event; (Complex) events that involve both an alternative 5′ and 3′ splice site; (RI) retained intron; (nd) no data.
As already mentioned, because the cost associated with an exhaustive search within spaces S>9 was prohibitive, we could not determine directly the number of non-EC events within these spaces. As a result, the actual number, N, of iAS events within the two libraries remains unknown. However, if we assume that in a given library the ratio, R, between non-EC and EC events is the same within space S>9 as within space S2–9, it is possible to propose a rough estimate of N (Nest). With R = 10/10 = 1 for space S2–9 of the Control library and R = 114/134 = 0.85 for the same space of the AS library (Table 3), we end up with Nest = 36 for the former and Nest = 350 for the latter; that is, we obtain a nearly 10-fold enrichment in iAS events within the AS library. Granted, these estimations should be taken with caution as they are based on an unproven assumption. Nevertheless, we take it as a reasonable hypothesis.
Each identified iAS event was checked for novelty against two genomically aligned sets of human cDNAs retrieved from the Ensembl transcript (build 34) and H-Invitational databases. Of the 28 (20 + 8) and 303 (248 + 55) iAS events identified (Table 3) within the Control and AS libraries, 22 and 249, respectively, were not documented in the reference databases. This corresponded to a novelty rate of ∼80% for both libraries. Interestingly, we observed the same novelty rate of ∼80% regardless of the space (S2–9 or S>9) or the library under consideration. In other words, the novelty rate appears to be independent not only of the library but also of the size of the clusters. As a result, since we previously have estimated the total number of iAS events to be 36 within the Control library and 350 within the AS library, the total number of new iAS events can be estimated to be ∼29 (36 × 0.8) in the former and 280 (350 × 0.8) in the latter.
The 303 iAS events identified in the AS library were in a total of 237 clusters of ASSETs of sizes ranging from two to 97 sequences. We examined whether these 237 clusters also were covered by the ESTs from the Control library, and we found that 111 (47%) of them were not. The fact that so many iAS events were found within clusters not covered by the 9999 ESTs of the Control library is indicative of the capacity of the ASEtrap to select AS events occurring in poorly expressed transcripts. At the very least, it shows that the technology has no problem identifying AS events occurring in transcripts expressed at a frequency of 5 × 10⁻⁴ to 6 × 10−4.4
Automatic detection of new AS events
The value of the ASEtrap lies primarily in its capacity to detect new AS events. In this respect, the new iAS events identified above only tell a part of the story because several new events can be identified by comparison with external resources without being necessarily iAS events. Obviously, this is the case when dealing with singletons, as no iAS event can, by definition, be found within the space of singletons. When compared with a set of reference cDNA sequences, however, a singleton can reveal itself as a new isoform, thereby documenting the occurrence of one or more new AS events relatively to that reference. The same is true for clusters made of several identical sequences, which can define one or more new AS events by comparison with external resources. Therefore, in order to gain a deeper insight regarding the value of the ASEtrap for discovering new AS events, we developed a computer program that allowed us to compare ESTs and ASSETs with the Ensembl transcript (build 34) and H-Invitational databases and applied it for the identification of new EC as well as new 5′/3′-ASS types of events (see Methods). By examining how the program performed at detecting the new internal EC and 5′/3′-ASS events already identified by the semiautomatic search procedure described above, we were able to estimate the level of false negatives and false positives to be <5% in both cases. Overall, the program detected 77 (38 EC + 39 5′/3′-ASS) and 413 (238 EC + 175 5′/3′-ASS) new AS events within the Control and AS libraries, respectively, suggesting that the content in new events is five to six times higher in the AS library.
Because the enrichment in new AS events (defined here as the ratio between the content in new AS events of the AS and Control libraries, respectively) obviously varies according to the number of sequences analyzed, it appears that the best way to assess the efficiency of the ASEtrap procedure in a meaningful, comparable manner is to look at the initial enrichment levels at early stages of sequencing. In order to determine this parameter, we randomly extracted from each library a sample of 200 sequences and used the program to determine their content in new EC and 5′/3′-ASS events. The same experiment was repeated 50 times to ensure that the number of events eventually assigned to this sample size would represent a reliable mean. So doing, we obtained mean values of 1.94 and 18 new AS events with the samples originating from the Control and AS libraries, respectively. This result indicates that the discovery rate of new AS events measured at early stages of sequencing is nearly 10 times higher in the AS library.
We next determined the size threshold below which an AS event would not be efficiently selected by the ASEtrap procedure. To do this, we first compared the enrichment in new 5′/3′-ASS events of the AS library over the Control library within discrete size intervals (Fig. 4). Whereas only a slight enrichment was recorded for all intervals below 25 bp, there was a marked increase of the enrichment levels for intervals above 25 bp. We also compared the cumulative size distribution of our set of 175 new 5′/3′-ASS events detected within the AS library with a reference set of 9390 5′/3′-ASS events documented in FAST DB, which is a bioinformatics suite providing extensive information on alternative splicing (Fig. 5; de la Grange et al. 2005). Overall, the AS library exhibited a marked deficit in 5′/3′-ASS events of sizes smaller than 40 bp. However, this deficit, which kept growing for sizes between 5 bp and 25 bp, clearly started to diminish above 25 bp. Taken together, these two analyses strongly suggest that the threshold was situated between 25 and 30 bp.
Figure 4.

Enrichment in new 5′/3′-ASS events according to the size of the events. (A) Number of new 5′/3′-ASS events found at discrete size intervals within the Control and AS libraries. (B) Enrichment level in new 5′/3′-ASS events at the same discrete size intervals (the enrichment level in new 5′/3′-ASS events at a given size interval is the ratio between the number of new 5′/3′-ASS events found within the AS library at this size interval and the number of new 5′/3′-ASS events found within the Control library at the same interval).
Figure 5.

Cumulative size distribution of two sets of AS events, the set of 175 new 5′/3′-ASS events detected in the AS library, and a reference set of 9390 5′/3′-ASS events documented in FAST DB (see text).
Finally, we used the program to examine in more depth the question of the level of false positives among the AS events retained by the program. There are two types of false positives that must be considered. The first type, which can be referred to as “program-dependent false positives,” corresponds to those events that are retained mistakenly by the program but that can be recognized as false positives upon manual inspection because their splice sites do not obey the GT-AG rule. As already mentioned (see above), we found that these “program-dependent false positives” do not exceed 5%. The other type, which can be referred to as “program-independent false positives,” corresponds to those events that are retained appropriately by the program but that cannot be recognized as false positives upon manual inspection because they seemingly display all the attributes of genuine AS events. In particular, they display seeming splice sites that comply with the GT-AG rule. A good approximation of the percentage (x) of “program-independent false positives” in both libraries is given by the following equation
where N is the number of events that is recorded at the output of the program when it is not forced to eliminate the events that do not obey the GT-AG rule, A is the number of events detected by the program when it is forced to retain only the events that comply with the GT-AG rule, and P is the probability that a false positive displays the GT-AG splice sites by chance. Assuming an equal representation and a random distribution of the four nucleotides in the system, P = 1/44, that is, 1/256. Therefore, since N = 157 and A = 77 in the Control library and N = 805 and A = 413 in the AS library, we end up with x ≈ 0.4% in the former and x ≈ 0.37% in the latter. What these values show is that the proportion of the so-called program-independent false positives within both libraries can be considered negligible. This result dispels an a priori concern associated with the ASEtrap procedure. Indeed, it is well known that PCR can generate artifacts (Viguera et al. 2001; Kanagawa 2003). Given that we performed three rounds of PCR enrichment to generate the AS library, there was the possibility that a high number of unusual PCR events such as slippage events (Viguera et al. 2001) could be amplified and, consequently, that the level of program-independent false positives within the AS library could be significant. The above analysis strongly suggests that this is not the case.
Search for new AS events within a group of 162 known drug target genes
The above analyses have shown that the ASEtrap procedure is efficient at producing a library highly enriched in AS events. However, we also wanted to assess the value of the method in identifying new AS events within medically important genes. We performed a manual search for new events within a set of 162 known drug target genes (Jin et al. 2004). We used as reference the same two databases mentioned above, namely, the Ensembl transcript database (build 34) and the H-Invitational database. We found that 25 genes out of the 162 considered were covered by at least one EST or ASSET. Among these 25 genes, seven were positive for the occurrence of one or more new AS events. Altogether, 10 new AS events were found within these seven positive genes. We noted that only one new event was identified by the resources of the Control library (ESTs), whereas the nine others were identified exclusively by the AS library (ASSETs). This result emphasized the value of the ASEtrap for discovering new mRNA isoforms within medically important genes. Moreover, the ratio between the number of ASSETs and ESTs covering a gene was on average much higher for genes in which a new AS event was found than for genes negative regarding the occurrence of a new AS event. It is equal to eight (210/26) in the former case and to slightly less than one (38/40) in the latter. This trend was, of course, expected in case of a successful ASEtrap procedure.
The 10 AS events identified in this study are new relative to cDNA databases such as Ensembl and H-Invitational databases. However, to verify the novelty of these events, we checked whether they were documented in ASD (human release 2), which is a comprehensive alternative splicing database made of (1) computationally delineated AS events from alignments of cDNA and EST sequences with genome sequences and (2) alternatively spliced exons collected from the literature (Thanaraj et al. 2004) (http://ebi.ac.uk/asd). We found that four of the 10 events were documented in ASD, while the six others were new and affected six different genes. Interestingly, none of these six events was found in the Control library. More information on these six new AS events occurring within six drug target genes are reported in Table 4. Note that three of the AS events might affect the primary structure of the corresponding protein.
Table 4.
Information regarding the six drug target genes in which a new AS event was found

(GSTP1) Glutathione S transferase π; (GUSB) β-glucuronidase; (P4HA2) α2 subunit of prolyl 4-hydroxylase; (FOLR2) folate receptor 2 (fetal); (HSD3B1) 3-β hydroxysteroid dehydrogenase; (PRL) prolactin. Columns 3 and 4 indicate, respectively, the number of ESTs and ASSETs covering the corresponding gene. Column 7 gives the identity of one ASSET documenting the corresponding event. Note that the six AS events described here have all been identified exclusively thanks to the AS library (column 6). Note also that the new exon truncation event found within the FOLR2 gene displays the rare GC–AG splice-site motif instead of the standard GT–AG motif. Using the ID sequence (column 7) as an entrance key, the above six AS events can be seen through a graphical interface (http://www.genoscope.cns.fr/cgi-bin/ggb/splicing_human/gbrowse/Human), where it is possible to compare the alignment on the genomic DNA of the ID sequence and the cDNAs retrieved from the Ensembl transcript and H-Invitational databases. The genomic positions encompassing the events are as follow: GSTP1, K11_67129103_67129220; GUSB, K7_64844511_64846918; P4HA2, K5_131630554_131639699; FOLR2, K11_71654278_71655983; HSD3B1, K1_119396626_119400507; and PRL, K6_22405288_22410968.
To confirm the existence of the six AS events, we performed RT-PCR experiments from human placenta RNA. For each of the six corresponding genes, we designed two sets of primers, where one set would amplify the known as well as the new spliced products (nonspecific set) and the other set would amplify only the new spliced products (specific set). For the specific sets of primers, we obtained RT-PCR products of the expected sizes for each of the six genes, providing strong evidence for the occurrence of the six AS events in placenta (an illustration of these results for two genes, namely, PAHA2 and GSTP1, is shown in Fig. 6). However, when performing the RT-PCR with the nonspecific sets of primers, we observed the two expected amplification products only for one gene, namely, P4HA2 (Fig. 6, lane 2). For the five others, we only saw the amplification products corresponding to the known splice variants (data not shown). This result suggested that of the six new splice variants, five were expressed at low levels relative to the known spliced form. Thus, it appears that even rare AS events can be identified with ASEtrap. Together, these RT-PCR experiments not only confirmed the occurrence in placenta of the six new AS events but also emphasized the sensitivity of the ASEtrap technology.
Figure 6.

RT-PCR validation of two new AS events identified within the P4HA2 and GSTP1 genes (see text). (Lane 1) A 100-bp ladder. (Lanes 2,4) RT-PCR products obtained with the nonspecific pairs of primers. Because these primers have been designed so that the two members of a pair would anneal the flanking regions on both sides of the corresponding AS event, they make possible the coamplification of the two isoforms produced by the event. Whereas two products with the expected size (a 161-bp and a 334-bp product corresponding, respectively, to the known and new splice variants) are observed with P4HA2 (lane 2), only one product (the expected 265-bp product corresponding to the already known splice variant) is observed with GSTP1 (lane 4). (Lanes 3,5) RT-PCR products obtained with the specific pairs of primers. These primers have been designed so that one member of a pair (nonspecific primer) would anneal flanking regions upstream or downstream of the newly identified AS event, whereas the other member (specific primer) would anneal within the additional sequence introduced by the event (the two new splicing isoforms monitored here are characterized by the insertion of an additional sequence relative to the known isoforms). This design ensures that only the new splicing isoforms can be amplified. For P4HA2 and GSTP1 (lanes 3,5), the expected products corresponding to the new splice variants are observed (a 274-bp and a 134-bp product, respectively). The arrow in lane 5 indicates an additional GSPT1 product at ∼250 bp. Although we didn’t investigate further the identity of this amplification product, we note that its size is consonant with the occurrence of a new AS event corresponding to the retention of the last intron of the GSPT1 gene.
Discussion
In recent years, it has been realized that the process of alternative splicing affects many mammalian genes and often generates multiple variants (Mironov et al. 1999; Croft et al. 2000; Kan et al. 2001; Lander et al. 2001; Modrek et al. 2001; Lee and Wang 2005). In order to determine the full repertoire of splice variants, new methods will be needed to systematically identify the AS events at a genomic scale. Here, we have presented one such method, which we named ASEtrap.
Although we have shown that the ASEtrap procedure is efficient, there are several points to note. At the beginning of the construction of the AS library, the double-stranded cDNA is fragmented into small fragments of mainly 100–500 bp using the 4-bp-cutter restriction enzyme RsaI. This fragmentation step, which has been designed for ensuring that the sequence of most DNA fragments collected at the end of the enrichment procedure can be determined by a single pass sequencing, has two important consequences. First, because the physical links between AS events within a single mRNA are broken, there is no way to determine how two or more AS events affecting the same transcript are combined. Second, any AS event introducing a sequence difference harboring an RsaI restriction site cannot be selected. However, this latter drawback can be easily overcome. By starting from the same initial double-stranded cDNA, one can construct simultaneously two or three different AS libraries using different 4-bp restriction enzymes. Thus, an AS event that would be missed in one library as the result of a cleavage by one restriction enzyme will likely be rescued in another one. Finally, we have shown that ASEtrap is likely to be inefficient at selecting AS events with sizes below 25 bp. Since, according to an analysis of a data set of 26,292 AS events documented in FAST DB (de la Grange et al. 2005), small events below 25 bp may represent ∼14% of all human AS events, it appears that ASEtrap can determine ∼86% of the total complement of human AS events. The same data set of 26,292 events also indicates that, respectively, ∼1.2% and 36% of all EC and 5′/3′-ASS events have sizes below 25 bp and that, among this latter group, nearly two-thirds have sizes below 10 bp. Consequently, the small fraction (14%) of AS events that cannot be determined by ASEtrap because of its inefficiency at capturing small AS events will comprise mainly very small 5′/3′-ASS events, that is, 5′/3′-ASS events with sizes below 10 bp.
We have reported one possible application of ASEtrap for exploring the repertoire of AS events occurring within a given tissue. However, many other applications exist. For example, as stated above, it may be used in a more systematic way for speeding up the determination of the full repertoire of human AS events. This would involve constructing and sequencing several tissue-specific AS libraries but also mixed AS libraries (mixed libraries are obtained when the RNA sample used at the beginning of the ASEtrap procedure is made from a pool of two or more tissue-specific RNA samples), the interest of the latter being that, unlike the tissue-specific libraries, they would identify AS events even though the splice variants they give rise to exhibit mutually exclusive expression patterns.
ASEtrap could also be used for identifying AS events that are differentially regulated between mRNA populations originating from two or more different sources. One may want to compare, for example, a pathological source and its healthy equivalent, or a source that has been exposed to an extracellular stimulus and its nonexposed equivalent. As a specific example, let’s imagine that we want to examine the action of a given hormone on the splicing pattern of a target tissue. Using the ASEtrap procedure, the first step would be to construct, sequence, and analyze three AS libraries: one from the nonexposed tissue, one from the exposed tissue, and the third one from a mixture of both the exposed and nonexposed tissues (mixed library). We would then have a broad knowledge of the AS events occurring within the whole system but little information regarding their differential expression. Therefore, an expression study of the set of AS events previously identified would then have to be performed by whatever technologies are available for that purpose. In this respect, DNA microarrays, which have recently emerged as potentially powerful tools for analyzing the expression of splice variants (Lee and Roy 2004), may well become the technology of choice.
Beside its use for analyzing the spliceomes of cells or tissues in various situations, the ASEtrap may also be used to produce gene-targeted libraries that show AS events occurring within gene family products with therapeutic interest, such as GPCRs, ECM proteins, kinases, hormones, ions channels, and so on. In such cases, the ASEtrap procedure would start with an initial cDNA sample obtained by pooling the products of individual gene-specific RT-PCR reactions.
How does ASEtrap compare with alternative methods already used for the systematic identification of AS events on a genome-wide scale? Bioinformatics analysis of expressed sequence tags (ESTs) was the first and, until now, the most efficient method for this purpose (Modrek and Lee 2002). However, there are several problems with EST data. First, ESTs are twofold less likely to detect AS events in the middle of a transcript than at its 5′- and 3′-ends. This bias toward transcript termini most likely reflects an undersampling in the center of long transcripts that is caused by nonuniformity in cDNA library construction and the use of end-sequence reads from these clones (Johnson et al. 2003). This type of bias has been avoided here because (1) the cDNA used at the beginning of the ASEtrap procedure has been obtained by means of a technology, the SMART cDNA technology, that generates high yields of full-length double-stranded cDNA (Chenchik et al. 1998); and (2) the fragmentation step of the ASEtrap procedure mostly produces DNA fragments with sizes suitable for a single pass sequencing. Another problem with ESTs is that they are biased against detecting AS events in genes with lower expression levels (Johnson et al. 2003). In contrast, our results suggest that ASEtrap is less vulnerable to this type of bias. Finally, probably the most significant limitation of ESTs is that they are derived from a limited number of tissues of limited developmental or physiological states and, as a result, are far from covering all biological situations. Here again, ASEtrap offers an advantage over EST studies because it can more easily be used to address a wide range of specific biological questions.
Until recently, alternative splicing studies using DNA microarrays’ technology have essentially focused on monitoring the expression of known splice variants (Clark et al. 2002; Yeakley et al. 2002; Castle et al. 2003; Wang et al. 2003; Neves et al. 2004). However, an important study has recently been published demonstrating that microarrays may also be used for large-scale detection of unknown AS events (Johnson et al. 2003). In this study, Johnson et al. designed 36-mer probes complementary to every exon–exon junction in >10,000 multi-exon human genes and used an array of the probes to monitor splicing of these genes in 52 tissues and cell lines. Although effective at predicting several new AS events, the design of Johnson et al. has several drawbacks that neither EST studies nor ASEtrap have. First, it seems to generate a high rate of false positives. Second, detection requires differential expression; if two isoforms are present in the same proportion in the tissues analyzed, no prediction will result. Finally and most importantly, the sequences of novel isoforms are not specified.
The idea to produce AS libraries by selectively cloning DNA fragments associated with AS events first appeared in US patent 6251,590 (Bracco and Kearsey 2003). In this approach, DNA–RNA hybrids are formed, and loop structures in the RNA comprising alternatively spliced exons are released by RNase H digestion of RNA within DNA–RNA hybrids. Fragments derived from the loop structures are then cloned. Owing to the lack of publicly available data, the efficiency of this technology is difficult to assess. Moreover, it is hampered by the fact that it cannot determine exact exon borders, as only partial exon sequences are obtained. In contrast, ASEtrap allows the retrieval of entire exons along with their flanking regions. More recently, another alternative splicing library approach has been reported that shares important similarities with ASEtrap even if the details differ significantly (Watahiki et al. 2004). The two methods rely on the formation of double-stranded DNA molecules harboring internal single-stranded loops that are then selected by means of a single-stranded trap. However, the trap used by Watahiki et al. is based on the annealing of the single-stranded loop structures to randomized-biotinized oligonucleotides, whereas that of the ASEtrap procedure is based on the binding of these loop structures to a single-stranded binding protein. Another difference between the two relates to the fact that ASEtrap has been designed in such a way that several enrichment cycles can be performed if needed. Since Watahiki et al. did not determine the enrichment level in AS events of their AS library, it is not possible to compare the efficiency of their approach with ASEtrap.
We have shown that ASEtrap is an efficient method allowing the systematic identification of AS events on a large scale. Because it presents several advantages over existing approaches, it may become a useful tool for speeding up the exploration of the human as well as other spliceomes.
Methods
ASEtrap procedure
cDNA obtention
The cDNA was obtained by using the SMART PCR cDNA synthesis method developed by Clontech Laboratory. The first-strand cDNA reaction was performed from human placenta total RNA purchased from Clontech (ref 64095-1). One microgram of total RNA was added to the RT reaction. The rest of the reagents used in the RT reaction were from the SMART PCR cDNA Synthesis Kit (Clontech). The manufacturer’s instructions were followed during cDNA synthesis. The double-stranded cDNA was produced by performing 10 identical PCR reactions using as the template 1 μL of the RT reaction mixture. The primer and other reagents used in the PCR reactions were from the SMART PCR cDNA Synthesis Kit. Each of the 10 PCR reactions was set up in a volume of 80 μL. The amplification conditions were as follows: denaturation at 95°C for 90 sec followed by 14 cycles of amplification (95°C for 10 sec; and 68°C for 6 min) in a Perkin Elmer GeneAmp PCR System 9600 (PE Biosystem). At the end of the PCR reactions, the amplification products were incubated for 2 h at 37°C in the presence of exonuclease VII (USB) at a final concentration of 0.1 U/μL. Then, the reaction mixture was extracted once with an equal volume of phenol:chloroform:isoamyl alcohol (25:24:1). The aqueous phase was ethanol-precipitated twice with ammonium acetate, and the resulting pellet was resuspended in 30 μL of TE (pH 8). Approximately 10 μg of purified double-stranded cDNA was eventually obtained.
Fragmentation of the double-stranded cDNA
The double-stranded cDNA obtained as described above (∼10 μg) was incubated for 2 h with 40 units of RsaI in 1× buffer Y+/Tango (Fermentas). Then, the fragmented cDNA was purified by phenol extraction and ethanol precipitation, and the resulting pellet was resuspended in 12 μL of TE. Approximately 8 μg of fragmented cDNA was eventually obtained. This mixture of fragmented cDNA molecules was used as the starting material of the ASEtrap procedure. We called it the M0 mixture.
First cycle of enrichment
Denaturation/renaturation of the M0 mixture
Three microliters of the M0 mixture (∼2 μg of DNA) was diluted with 1 μL of 60 mM EDTA and 6 μL of water. The resulting mixture was placed at 97°C for 2 min for denaturation and then placed at 67°C. Five microliters of a 3× hybridization buffer [3 M NaCl; 120 mM Tricine-KOH at pH 8.7 and 25°C; 45 mM KOAc; 10.5 mM Mg(OAc)2; 12 μg/mL BSA; 0.015% Tween 20; 0.015% Nonidet-P40] was then added to the denatured mixture. After having overlaid the resulting mixture with a drop of mineral oil in order to avoid evaporation, it was maintained at 67°C for 24 h (Cot = 37). Then, the NaCl concentration was adjusted to 0.2 M by adding 60 μL of water, and the resulting mixture was precipitated with ethanol. The pellet was resuspended in 10 μL of TE. This material was called the M0.1 mixture.
Adaptor ligation and strand displacement reaction
Two micrograms of the AdRsaI adaptor [produced by annealing an equimolar amount of the AdRsaI(up) and AdRsaI(low) oligonucleotides] was ligated to the denatured–renatured DNA molecules of the M0.1 mixture in a total volume of 20 μL using 3 U of T4 DNA ligase (Fermentas) in the following buffer: 40 mM Tris-HCl (pH 8 at 25°C); 7 mM MgCl2; 3 mM DTT; 0.2 mM ATP; 5% polyethylene glycol (mol wt 4000). After 90 min of incubation at 37°C, the ligation reaction was placed for 10 min at 65°C in order to inactivate the ligase. Then, 80 μL of an SD solution [50 mM Tris-HCl (pH 8.0 at 25°C), 5 mM MgCl2, 1 mM DTT, 1.25 mM dNTPs, and 6.5 U of Klenow Fragment exo− (Fermentas)] was added to the ligation mixture, and the resulting mixture was incubated for 30 min at 37°C. The DNA molecules now harboring the adaptor sequence at their ends were purified by phenol extraction and ethanol precipitation, and the resulting pellet was resuspended in 40 μL of TE. This material was called the M0.2 mixture.
Selection of DNA molecules comprising single-stranded regions (SSRDNA)
For this, 32 μL of the His-tagged SSBP (0.5 μg/μL) and 40 μL of buffer (100 mM NaH2PO4 at pH 8, 600 mM NaCl, 20 mM imidazole, 0.08% Tween 20) were added to the M0.2 mixture, and the resulting mixture was placed at 37°C for 60 min so that His-tagged SSBP/SSRDNA complexes formed. These complexes were then isolated from the rest of the mixture by means of an immobilized metal affinity chromatography (IMAC) using the Ni-NTA Spin columns, reagents, and buffers from the Ni-NTA spin Kit (Qiagen; cat. no. 31,014). The manufacturer’s instructions were followed during this step. We called the eluate collected at the end of the IMAC chromatography the M1 mixture.
PCR amplification of the M1 mixture
Ten identical PCR reactions were performed in order to amplify within the M1 mixture the subset of DNA molecules equipped at both ends with the adaptor sequence. Each amplification was conducted in a 60-μL volume containing 1 μL of the M1 mixture; 200 μM each dATP, dGTP, dTTP, and dCTP; 5 μL of primer P1; 6 μL of 10× Titanium Buffer (Clontech); and 1.2 μL of 50× Titanium Taq DNA polymerase (Clontech). The temperature parameters of the PCRs were as follows: 1 min, 30 sec at 95°C followed by 16–20 cycles of 94°C for 15 sec and 68°C for 2 min, 30 sec; followed by a 5-min final extension at 68°C. At the end of the PCR reactions, the amplification products were incubated for 2 h at 37°C in the presence of exonuclease VII (USB) at a final concentration of 0.1 U/μL. Then, the reaction mixture was extracted one time with an equal volume of phenol:chloroform:isoamyl alcohol (25:24:1). The aqueous phase was ethanol-precipitated with ammonium acetate, and the resulting pellet was resuspended in 20 μL of TE (pH 8). Approximately 10 μg of purified amplification products was eventually obtained. We called this new material the M1.1 mixture.
Treatment of the M1.1 mixture by the S1 nuclease
Forty microliters of an S1 solution (50 mM sodium acetate at pH 4.6; 420 mM NaCl; 1.5 mM ZnSO4; 12 units of S1 nuclease) was added to the M1.1 mixture, and the resulting mixture was incubated at 16°C for 20 min. The reaction was stopped by adding 140 μL of cold water followed by two successive phenol extractions. The deproteinized solution was then precipitated with ethanol, and the resulting pellet was resuspended in 30 μL of TE (pH 8). We called this new material the M1.2 mixture.
Elimination of the adaptor sequence at the ends of the DNA molecules of M1.2
Elimination of the adaptor sequence at the ends of the DNA molecules of M1.2 was accomplished by digesting the DNA molecules of the M1.2 mixture for 2 h at 37°C with 40 units of RsaI in a total volume of 100 μL and in 1× buffer Y+/Tango (Fermentas). The reaction was stopped by phenol extraction and ethanol precipitation, and the resulting pellet was resuspended in 10 μL of TE (pH 8). Approximately 4 μg of DNA was eventually obtained. We called this material the MI mixture.
Second and third cycles of enrichment
Starting with 2 μg of DNA fragments from the MI mixture, the same steps described above were performed again for a second enrichment cycle. The only difference with the first cycle concerns the denaturation–renaturation step, where the renaturation time was shortened to 7 h (Cot = 11). We called the mixture obtained at the end of the second cycle the MII mixture. Finally, 2 μg of DNA fragments from the MII mixture was subjected to a third enrichment cycle. The conditions were the same as for the previous two cycles except that the renaturation time was shortened to 3 h (Cot = 4.64). We called the mixture obtained at the end of the third cycle the MIII mixture.
Cloning of the DNA fragments from the M0 and MIII mixtures into, respectively, the Control and the Alternative Splicing libraries
BstXI-linkered DNA fragments originating from the M0 and MIII mixtures were cloned into the BstXI-digested phagemid vector pcDNA2.1 (Invitrogen).
Preparation of BstXI-linkered DNA inserts
The ends of the DNA fragments of the M0 and MIII mixtures were equipped with a BstXI adaptor (Invitrogen, cat. no. N408-18) as follows: 6 μg of the adaptor was ligated to ∼2 μg of aforementioned DNA fragments in a total volume of 30 μL using 5 U of T4 DNA ligase (Fermentas) in buffer (40 mM Tris-HCl at pH 8 at 25°C; 7 mM MgCl2; 3 mM DTT; 0.2 mM ATP; 5% polyethylene glycol [mol wt 4000]). After 90 min of incubation at 21°C, the ligation reactions were placed for 10 min at 65°C in order to inactivate the ligase. The BstXI-linkered DNA fragments were separated from the excess of nonreacted adaptors by ultrafiltration using a Microcon-100 centrifugal filter device (Millipore) and then by gel electrophoresis (1.2% low melting point agarose-TAE), where all fragments larger than 100 bp were cut out from the gel and purified using the GELase agarose gel-digesting preparation (Epicentre).
Cloning of the BstXI-linkered DNA inserts
Five nanograms of purified BstXI-linkered DNA inserts and 25 ng of vector (ratio ∼2:1) were mixed and ligated in a total volume of 20 μL under standard conditions at 16°C for 15 h using 2.5 U of T4 DNA ligase (Fermentas). At the end of the ligation reactions, the two DNA solutions were purified by phenol extraction and ethanol precipitation, the resulting pellets were resuspended in 10 μL of TE, and 1 μL of each solution was used for transformation of DH10B ultracompetent E. coli cells (Invitrogen) by electroporation.
Sequencing procedure
All clone inserts were sequenced at one end using a primer complementary to the vector sequence. Sequences from the Control library are referred to as ESTs, and sequences from the AS library are referred to as ASSETs (alternative splicing sequence-enriched tags).
Alignment of EST and ASSET sequences to the human genome
We used a two-step strategy to align the transcript sequences on the repeat-masked genomic reference sequence (NCBI build 34) (Castelli et al. 2004). The repeats taken into account by the masking procedure were limited to Alu sequences and microsatellites. As a first step, we used BLAST (Altschul et al. 1990) (W = 20, X = 8, match score = 5, mismatch score = −4) on the complete genomic sequences to generate the alignments. The sum of HSP (High-Scoring Pairs) scores was then computed for each possible location; if the sum of scores was >1000, the location with the highest score was retained. Once the location of the transcript sequence was determined, the corresponding unmasked genomic region was extended by 10 kb on each side. Transcript sequences were then realigned on the extended region using EST_GENOME (Mott 1997) (with the following settings: mismatch 2, gap penalty 3).
Search for internal alternative splicing events (iAS events)
Internal AS events (iAS events) were identified using a semiautomatic search procedure involving two steps. First, for a given library, all clusters having at least two sequences were screened for the presence of one or more putative iAS events using a computational procedure aimed at detecting internal sequence differences between sequences of the clusters. However, the presence of an internal sequence difference is a necessary but not a sufficient condition for establishing the presence of a genuine iAS event because internal sequence differences, corresponding to experimental noise, also can be generated at certain steps of the library’s construction. For example, the reverse transcriptase used to synthesize the first strand of cDNA may sometimes pass through a stable RNA structure of some mRNA molecules and thereby introduce a gap in the cDNA. Alternatively, the DNA polymerase used during the different PCR amplification steps may also, in some rare circumstances, skip certain regions of the DNA templates, and likewise introduce a gap in some molecules. Thus the function of the computational step essentially was to screen out negative clusters from further consideration. In the second step of the search procedure, each cluster selected by the computational step was manually inspected for the presence of one or more genuine iAS events.
Computational step
The computational approach was developed in Perl v5.8.5 (www.perl.org) using an Athlon64 3200+ processor with 1.5 Gb of RAM and with the Mandrake 10.1 Linux distribution (http://wwwnew.mandriva.com/). This computational step was performed on the two libraries for each cluster composed of at least two sequences. For each cluster and for each transcript (ASSETs for the AS library or ESTs for the Control library), the algorithm aligned the transcript sequence against the corresponding genomic sequence using Sim4. By parsing the Sim4 output, we defined the transcript exons. These exons were then clustered by genomic position in order to define the genomic exons (using the more frequent first and last positions of the different clustered “transcript exons”). A putative AS event was recorded when a transcript exon displayed a sequence difference with its corresponding genomic exon. Differences were not considered if they concerned the beginning of the first exon of a transcript or the end of the last exon of a transcript (only internal differences were considered).
Manual step
All clusters selected by the computational step were visually inspected for the presence of iAS events using a graphical interface (Generic Genome Browser; http://www.genoscope.cns.fr/cgi-bin/ggb/splicing_human/gbrowse/Human) showing the alignments of either ESTs or ASSETs on the genomic DNA. When a difference in alignment within a cluster could be visually spotted (as is the case for exon cassette and intron retention events as well as large enough exon extensions or truncations resulting from 5′- or 3′-alternative-splice-site types of events), we checked whether (1) the putative splice sites involved in the putative iAS event signaled by the alignment difference obeyed the GT-AG rule; and (2) that at least five out of the first six nucleotides from the splice junctions involved in the putative iAS event matched the genome perfectly. Only iAS events that complied with these two conditions were considered as genuine. Because small differences in exon length introduced by 5′- or 3′-alternative splice site events could easily be missed by the above visual inspection approach, we completed it by a systematic analysis of intron length when, as was the case for clusters having sizes ranging from two to nine sequences (see text), the goal was to be exhaustive in our search for iAS events. More precisely, for each cluster, the intron length analysis consisted of building a matrix of intron lengths, with columns corresponding to the different introns found in the cluster and lines to the individual transcript sequences. Intron length differences, validated by the two criteria stated above, were considered as characteristic of genuine 5′ or 3′ alternative splice site events.
Automatic detection of new AS events
We developed a Perl program that detects alternative splicing events by comparing a (query) set of transcript sequences with a reference set (in this case, transcript sequences from Ensembl build 34 and H-Invitational). The program performs all pairwise comparisons between a query sequence and a reference sequence. For each comparison, AS events are searched for within the region delimited by the two outermost overlapping exon pairs. Exon cassette (EC) and alternative 5′–3′-splice site (5′/3′-ASS) types of events are detected by matching query exons to reference exons whenever overlap occurs, recording missing exons and exon boundary location in the case of incomplete overlaps. An alternative splicing event is thus defined by its type (EC or 5′/3′-ASS) and the location of its 3′ and 5′ boundaries on the genomic sequence. Following this identification step, AS events are subjected to a two-step validation process: The existence of a GT-AG consensus site is confirmed, and we check the quality of the sequence in the neighborhood of the splice site using KERR (Landau et al. 1986) and the genomic reference (nberr = 1 mismatch/6 nucleotides). Finally, redundancies are eliminated from the set of validated events and novel events (events that are not deducible from the reference set alone) are tagged.
Acknowledgments
We thank Kyle Tanner for critical reading of the manuscript and for his help in writing it. We also thank Jean-Marc Aury for his work related to the graphical interface that has been an invaluable tool for identifying iAS events.
Footnotes
[Supplemental material is available online at www.genome.org.]
Article published online before print. Article and publication date are at http://www.genome.org/cgi/doi/10.1101/gr.5063306
The average size of the double-stranded cDNA molecules obtained at the end of the preparation step was ∼1.5 kb (data not shown); consequently, the transcripts expressed in placenta should be, on average, represented by about five to six different RsaI restriction fragments in the Control library. The frequency in placenta of a transcript not represented by any ESTs from the Control library is therefore bound to be less than 5/9999–6/9999, that is, 5 × 10⁻⁴ to 6 × 10⁻⁴.
References
- Altschul S.F., Gish W., Miller W., Myers E.W., Lipman D.J., Gish W., Miller W., Myers E.W., Lipman D.J., Miller W., Myers E.W., Lipman D.J., Myers E.W., Lipman D.J., Lipman D.J. Basic local alignment search tool. J. Mol. Biol. 1990;215:403–410. doi: 10.1016/S0022-2836(05)80360-2. [DOI] [PubMed] [Google Scholar]
- Black D.L. Protein diversity from alternative splicing: A challenge for bioinformatics and post-genome biology. Cell. 2000;103:367–370. doi: 10.1016/s0092-8674(00)00128-8. [DOI] [PubMed] [Google Scholar]
- Black D.L. Mechanisms of alternative pre-messenger RNA splicing. Annu. Rev. Biochem. 2003;72:291–336. doi: 10.1146/annurev.biochem.72.121801.161720. [DOI] [PubMed] [Google Scholar]
- Black D.L., Grabowski P.J., Grabowski P.J. Alternative pre-mRNA splicing and neuronal function. Prog. Mol. Subcell. Biol. 2003;31:187–216. doi: 10.1007/978-3-662-09728-1_7. [DOI] [PubMed] [Google Scholar]
- Bracco L., Kearsey J., Kearsey J. The relevance of alternative RNA splicing to pharmacogenomics. Trends Biotechnol. 2003;21:346–353. doi: 10.1016/S0167-7799(03)00146-X. [DOI] [PubMed] [Google Scholar]
- Caceres J.F., Kornblihtt A.R., Kornblihtt A.R. Alternative splicing: Multiple control mechanisms and involvement in human disease. Trends Genet. 2002;18:186–193. doi: 10.1016/s0168-9525(01)02626-9. [DOI] [PubMed] [Google Scholar]
- Castelli V., Aury J.M., Jaillon O., Wincker P., Clepet C., Menard M., Cruaud C., Quetier F., Scarpelli C., Schachter V., Aury J.M., Jaillon O., Wincker P., Clepet C., Menard M., Cruaud C., Quetier F., Scarpelli C., Schachter V., Jaillon O., Wincker P., Clepet C., Menard M., Cruaud C., Quetier F., Scarpelli C., Schachter V., Wincker P., Clepet C., Menard M., Cruaud C., Quetier F., Scarpelli C., Schachter V., Clepet C., Menard M., Cruaud C., Quetier F., Scarpelli C., Schachter V., Menard M., Cruaud C., Quetier F., Scarpelli C., Schachter V., Cruaud C., Quetier F., Scarpelli C., Schachter V., Quetier F., Scarpelli C., Schachter V., Scarpelli C., Schachter V., Schachter V., et al. Whole genome sequence comparisons and “full-length” cDNA sequences: A combined approach to evaluate and improve Arabidopsis genome annotation. Genome Res. 2004;14:406–413. doi: 10.1101/gr.1515604. [DOI] [PMC free article] [PubMed] [Google Scholar]
- Castle J., Garrett-Engele P., Armour C.D., Duenwald S.J., Loerch P.M., Meyer M.R., Schadt E.E., Stoughton R., Parrish M.L., Shoemaker D.D., Garrett-Engele P., Armour C.D., Duenwald S.J., Loerch P.M., Meyer M.R., Schadt E.E., Stoughton R., Parrish M.L., Shoemaker D.D., Armour C.D., Duenwald S.J., Loerch P.M., Meyer M.R., Schadt E.E., Stoughton R., Parrish M.L., Shoemaker D.D., Duenwald S.J., Loerch P.M., Meyer M.R., Schadt E.E., Stoughton R., Parrish M.L., Shoemaker D.D., Loerch P.M., Meyer M.R., Schadt E.E., Stoughton R., Parrish M.L., Shoemaker D.D., Meyer M.R., Schadt E.E., Stoughton R., Parrish M.L., Shoemaker D.D., Schadt E.E., Stoughton R., Parrish M.L., Shoemaker D.D., Stoughton R., Parrish M.L., Shoemaker D.D., Parrish M.L., Shoemaker D.D., Shoemaker D.D., et al. Optimization of oligonucleotide arrays and RNA amplification protocols for analysis of transcript structure and alternative splicing. Genome Biol. 2003;4:R66. doi: 10.1186/gb-2003-4-10-r66. [DOI] [PMC free article] [PubMed] [Google Scholar]
- Chenchik A., Zhu Y.Y., Diatchenko L., Li R., Hill J., Siebert P.D., Zhu Y.Y., Diatchenko L., Li R., Hill J., Siebert P.D., Diatchenko L., Li R., Hill J., Siebert P.D., Li R., Hill J., Siebert P.D., Hill J., Siebert P.D., Siebert P.D.1998. Generation and use of high-quality cDNA from small amounts of total RNA by SMART PCR. In Gene cloning and analysis by RT-PCR (eds. P. Siebert and J. Larrick), pp. 305–319. BioTechniques Books; Natick, MA [Google Scholar]
- Clark T.A., Sugnet C.W., Ares Jr , M , Sugnet C.W., Ares Jr , M , Ares Jr , M , M Genomewide analysis of mRNA processing in yeast using splicing-specific microarrays. Science. 2002;296:907–910. doi: 10.1126/science.1069415. [DOI] [PubMed] [Google Scholar]
- Croft L., Schandorff S., Clark F., Burrage K., Arctander P., Mattick J.S., Schandorff S., Clark F., Burrage K., Arctander P., Mattick J.S., Clark F., Burrage K., Arctander P., Mattick J.S., Burrage K., Arctander P., Mattick J.S., Arctander P., Mattick J.S., Mattick J.S. ISIS, the intron information system, reveals the high frequency of alternative splicing in the human genome. Nat. Genet. 2000;24:340–341. doi: 10.1038/74153. [DOI] [PubMed] [Google Scholar]
- de la Grange P., Dutertre M., Martin N., Auboeuf D., Dutertre M., Martin N., Auboeuf D., Martin N., Auboeuf D., Auboeuf D. FAST DB: A website resource for the study of the expression regulation of human gene products. Nucleic Acids Res. 2005;33:4276–4284. doi: 10.1093/nar/gki738. [DOI] [PMC free article] [PubMed] [Google Scholar]
- Faustino N.A., Cooper T.A., Cooper T.A. Pre-mRNA splicing and human disease. Genes & Dev. 2003;17:419–437. doi: 10.1101/gad.1048803. [DOI] [PubMed] [Google Scholar]
- Graveley B.R. Alternative splicing: Increasing diversity in the proteomic world. Trends Genet. 2001;17:100–107. doi: 10.1016/s0168-9525(00)02176-4. [DOI] [PubMed] [Google Scholar]
- Haas B.J., Delcher A.L., Mount S.M., Wortman J.R., Smith R.K., Jr., Hannick L.I., Maiti R., Ronning C.M., Rusch D.B., Town C.D., Delcher A.L., Mount S.M., Wortman J.R., Smith R.K., Jr., Hannick L.I., Maiti R., Ronning C.M., Rusch D.B., Town C.D., Mount S.M., Wortman J.R., Smith R.K., Jr., Hannick L.I., Maiti R., Ronning C.M., Rusch D.B., Town C.D., Wortman J.R., Smith R.K., Jr., Hannick L.I., Maiti R., Ronning C.M., Rusch D.B., Town C.D., Smith R.K., Jr., Hannick L.I., Maiti R., Ronning C.M., Rusch D.B., Town C.D., Hannick L.I., Maiti R., Ronning C.M., Rusch D.B., Town C.D., Maiti R., Ronning C.M., Rusch D.B., Town C.D., Ronning C.M., Rusch D.B., Town C.D., Rusch D.B., Town C.D., Town C.D., et al. Improving the Arabidopsis genome annotation using maximal transcript alignment assemblies. Nucleic Acids Res. 2003;31:5654–5666. doi: 10.1093/nar/gkg770. [DOI] [PMC free article] [PubMed] [Google Scholar]
- Jin P., Fu G.K., Wilson A.D., Yang J., Chien D., Hawkins P.R., Au-Young J., Stuve L.L., Fu G.K., Wilson A.D., Yang J., Chien D., Hawkins P.R., Au-Young J., Stuve L.L., Wilson A.D., Yang J., Chien D., Hawkins P.R., Au-Young J., Stuve L.L., Yang J., Chien D., Hawkins P.R., Au-Young J., Stuve L.L., Chien D., Hawkins P.R., Au-Young J., Stuve L.L., Hawkins P.R., Au-Young J., Stuve L.L., Au-Young J., Stuve L.L., Stuve L.L. PCR isolation and cloning of novel splice variant mRNAs from known drug target genes. Genomics. 2004;83:566–571. doi: 10.1016/j.ygeno.2003.09.023. [DOI] [PubMed] [Google Scholar]
- Johnson J.M., Castle J., Garrett-Engele P., Kan Z., Loerch P.M., Armour C.D., Santos R., Schadt E.E., Stoughton R., Shoemaker D.D., Castle J., Garrett-Engele P., Kan Z., Loerch P.M., Armour C.D., Santos R., Schadt E.E., Stoughton R., Shoemaker D.D., Garrett-Engele P., Kan Z., Loerch P.M., Armour C.D., Santos R., Schadt E.E., Stoughton R., Shoemaker D.D., Kan Z., Loerch P.M., Armour C.D., Santos R., Schadt E.E., Stoughton R., Shoemaker D.D., Loerch P.M., Armour C.D., Santos R., Schadt E.E., Stoughton R., Shoemaker D.D., Armour C.D., Santos R., Schadt E.E., Stoughton R., Shoemaker D.D., Santos R., Schadt E.E., Stoughton R., Shoemaker D.D., Schadt E.E., Stoughton R., Shoemaker D.D., Stoughton R., Shoemaker D.D., Shoemaker D.D. Genome-wide survey of human alternative pre-mRNA splicing with exon junction microarrays. Science. 2003;302:2141–2144. doi: 10.1126/science.1090100. [DOI] [PubMed] [Google Scholar]
- Kan Z., Rouchka E.C., Gish W.R., States D.J., Rouchka E.C., Gish W.R., States D.J., Gish W.R., States D.J., States D.J. Gene structure prediction and alternative splicing analysis using genomically aligned ESTs. Genome Res. 2001;11:889–900. doi: 10.1101/gr.155001. [DOI] [PMC free article] [PubMed] [Google Scholar]
- Kanagawa T. Bias and artifacts in multitemplate polymerase chain reactions (PCR). J. Biosci. Bioeng. 2003;96:317–323. doi: 10.1016/S1389-1723(03)90130-7. [DOI] [PubMed] [Google Scholar]
- Krawczak M., Reiss J., Cooper D.N., Reiss J., Cooper D.N., Cooper D.N. The mutational spectrum of single base-pair substitutions in mRNA splice junctions of human genes: Causes and consequences. Hum. Genet. 1992;90:41–54. doi: 10.1007/BF00210743. [DOI] [PubMed] [Google Scholar]
- Landau G.M., Vishkin U., Nussinov R., Vishkin U., Nussinov R., Nussinov R. An efficient string matching algorithm with k differences for nucleotide and amino acid sequences. Nucleic Acids Res. 1986;14:31–46. doi: 10.1093/nar/14.1.31. [DOI] [PMC free article] [PubMed] [Google Scholar]
- Lander E.S., Linton L.M., Birren B., Nusbaum C., Zody M.C., Baldwin J., Devon K., Dewar K., Doyle M., FitzHugh W., Linton L.M., Birren B., Nusbaum C., Zody M.C., Baldwin J., Devon K., Dewar K., Doyle M., FitzHugh W., Birren B., Nusbaum C., Zody M.C., Baldwin J., Devon K., Dewar K., Doyle M., FitzHugh W., Nusbaum C., Zody M.C., Baldwin J., Devon K., Dewar K., Doyle M., FitzHugh W., Zody M.C., Baldwin J., Devon K., Dewar K., Doyle M., FitzHugh W., Baldwin J., Devon K., Dewar K., Doyle M., FitzHugh W., Devon K., Dewar K., Doyle M., FitzHugh W., Dewar K., Doyle M., FitzHugh W., Doyle M., FitzHugh W., FitzHugh W., et al. Initial sequencing and analysis of the human genome. Nature. 2001;409:860–921. doi: 10.1038/35057062. [DOI] [PubMed] [Google Scholar]
- Lareau L.F., Green R.E., Bhatnagar R.S., Brenner S.E., Green R.E., Bhatnagar R.S., Brenner S.E., Bhatnagar R.S., Brenner S.E., Brenner S.E. The evolving roles of alternative splicing. Curr. Opin. Struct. Biol. 2004;14:273–282. doi: 10.1016/j.sbi.2004.05.002. [DOI] [PubMed] [Google Scholar]
- Lee C., Roy M., Roy M. Analysis of alternative splicing with microarrays: Successes and challenges. Genome Biol. 2004;5:231. doi: 10.1186/gb-2004-5-7-231. [DOI] [PMC free article] [PubMed] [Google Scholar]
- Lee C., Wang Q., Wang Q. Bioinformatics analysis of alternative splicing. Brief. Bioinform. 2005;6:23–33. doi: 10.1093/bib/6.1.23. [DOI] [PubMed] [Google Scholar]
- Lopez A.J. Alternative splicing of pre-mRNA: Developmental consequences and mechanisms of regulation. Annu. Rev. Genet. 1998;32:279–305. doi: 10.1146/annurev.genet.32.1.279. [DOI] [PubMed] [Google Scholar]
- Lynch K.W. Consequences of regulated pre-mRNA splicing in the immune system. Nat. Rev. Immunol. 2004;4:931–940. doi: 10.1038/nri1497. [DOI] [PubMed] [Google Scholar]
- Meyer R.R., Laine P.S., Laine P.S. The single-stranded DNA-binding protein of Escherichia coli. Microbiol. Rev. 1990;54:342–380. doi: 10.1128/mr.54.4.342-380.1990. [DOI] [PMC free article] [PubMed] [Google Scholar]
- Mironov A.A., Fickett J.W., Gelfand M.S., Fickett J.W., Gelfand M.S., Gelfand M.S. Frequent alternative splicing of human genes. Genome Res. 1999;9:1288–1293. doi: 10.1101/gr.9.12.1288. [DOI] [PMC free article] [PubMed] [Google Scholar]
- Modrek B., Lee C., Lee C. A genomic view of alternative splicing. Nat. Genet. 2002;30:13–19. doi: 10.1038/ng0102-13. [DOI] [PubMed] [Google Scholar]
- Modrek B., Resch A., Grasso C., Lee C., Resch A., Grasso C., Lee C., Grasso C., Lee C., Lee C. Genome-wide detection of alternative splicing in expressed sequences of human genes. Nucleic Acids Res. 2001;29:2850–2859. doi: 10.1093/nar/29.13.2850. [DOI] [PMC free article] [PubMed] [Google Scholar]
- Mott R. EST_GENOME: A program to align spliced DNA sequences to unspliced genomic DNA. Comput. Appl. Biosci. 1997;13:477–478. doi: 10.1093/bioinformatics/13.4.477. [DOI] [PubMed] [Google Scholar]
- Neves G., Zucker J., Daly M., Chess A., Zucker J., Daly M., Chess A., Daly M., Chess A., Chess A. Stochastic yet biased expression of multiple Dscam splice variants by individual cells. Nat. Genet. 2004;36:240–246. doi: 10.1038/ng1299. [DOI] [PubMed] [Google Scholar]
- Ohba K., Yoshioka T., Muraki T., Yoshioka T., Muraki T., Muraki T. Identification of two novel splicing variants of human type II iodothyronine deiodinase mRNA. Mol. Cell. Endocrinol. 2001;172:169–175. doi: 10.1016/s0303-7207(00)00368-3. [DOI] [PubMed] [Google Scholar]
- Stamm S. Signals and their transduction pathways regulating alternative splicing: A new dimension of the human genome. Hum. Mol. Genet. 2002;11:2409–2416. doi: 10.1093/hmg/11.20.2409. [DOI] [PubMed] [Google Scholar]
- Strausberg R.L., Feingold E.A., Klausner R.D., Collins F.S., Feingold E.A., Klausner R.D., Collins F.S., Klausner R.D., Collins F.S., Collins F.S. The mammalian gene collection. Science. 1999;286:455–457. doi: 10.1126/science.286.5439.455. [DOI] [PubMed] [Google Scholar]
- Thanaraj T.A., Stamm S., Clark F., Riethoven J.J., Le Texier V., Muilu J., Stamm S., Clark F., Riethoven J.J., Le Texier V., Muilu J., Clark F., Riethoven J.J., Le Texier V., Muilu J., Riethoven J.J., Le Texier V., Muilu J., Le Texier V., Muilu J., Muilu J. ASD: The Alternative Splicing Database. Nucleic Acids Res. 2004;32:D64–D69. doi: 10.1093/nar/gkh030. [DOI] [PMC free article] [PubMed] [Google Scholar]
- Viguera E., Canceill D., Ehrlich S.D., Canceill D., Ehrlich S.D., Ehrlich S.D. In vitro replication slippage by DNA polymerases from thermophilic organisms. J. Mol. Biol. 2001;312:323–333. doi: 10.1006/jmbi.2001.4943. [DOI] [PubMed] [Google Scholar]
- Wang H., Hubbell E., Hu J.S., Mei G., Cline M., Lu G., Clark T., Siani-Rose M.A., Ares M., Kulp D.C., Hubbell E., Hu J.S., Mei G., Cline M., Lu G., Clark T., Siani-Rose M.A., Ares M., Kulp D.C., Hu J.S., Mei G., Cline M., Lu G., Clark T., Siani-Rose M.A., Ares M., Kulp D.C., Mei G., Cline M., Lu G., Clark T., Siani-Rose M.A., Ares M., Kulp D.C., Cline M., Lu G., Clark T., Siani-Rose M.A., Ares M., Kulp D.C., Lu G., Clark T., Siani-Rose M.A., Ares M., Kulp D.C., Clark T., Siani-Rose M.A., Ares M., Kulp D.C., Siani-Rose M.A., Ares M., Kulp D.C., Ares M., Kulp D.C., Kulp D.C., et al. 2003Gene structure-based splice variant deconvolution using a microarray platform. Bioinformatics (Suppl 1) 19i315–i322. [DOI] [PubMed] [Google Scholar]
- Watahiki A., Waki K., Hayatsu N., Shiraki T., Kondo S., Nakamura M., Sasaki D., Arakawa T., Kawai J., Harbers M., Waki K., Hayatsu N., Shiraki T., Kondo S., Nakamura M., Sasaki D., Arakawa T., Kawai J., Harbers M., Hayatsu N., Shiraki T., Kondo S., Nakamura M., Sasaki D., Arakawa T., Kawai J., Harbers M., Shiraki T., Kondo S., Nakamura M., Sasaki D., Arakawa T., Kawai J., Harbers M., Kondo S., Nakamura M., Sasaki D., Arakawa T., Kawai J., Harbers M., Nakamura M., Sasaki D., Arakawa T., Kawai J., Harbers M., Sasaki D., Arakawa T., Kawai J., Harbers M., Arakawa T., Kawai J., Harbers M., Kawai J., Harbers M., Harbers M., et al. Libraries enriched for alternatively spliced exons reveal splicing patterns in melanocytes and melanomas. Nat. Methods. 2004;1:233–239. doi: 10.1038/nmeth719. [DOI] [PubMed] [Google Scholar]
- Yeakley J.M., Fan J.B., Doucet D., Luo L., Wickham E., Ye Z., Chee M.S., Fu X.D., Fan J.B., Doucet D., Luo L., Wickham E., Ye Z., Chee M.S., Fu X.D., Doucet D., Luo L., Wickham E., Ye Z., Chee M.S., Fu X.D., Luo L., Wickham E., Ye Z., Chee M.S., Fu X.D., Wickham E., Ye Z., Chee M.S., Fu X.D., Ye Z., Chee M.S., Fu X.D., Chee M.S., Fu X.D., Fu X.D. Profiling alternative splicing on fiber-optic arrays. Nat. Biotechnol. 2002;20:353–358. doi: 10.1038/nbt0402-353. [DOI] [PubMed] [Google Scholar]
- Zavolan M., Kondo S., Schonbach C., Adachi J., Hume D.A., Hayashizaki Y., Gaasterland T., Kondo S., Schonbach C., Adachi J., Hume D.A., Hayashizaki Y., Gaasterland T., Schonbach C., Adachi J., Hume D.A., Hayashizaki Y., Gaasterland T., Adachi J., Hume D.A., Hayashizaki Y., Gaasterland T., Hume D.A., Hayashizaki Y., Gaasterland T., Hayashizaki Y., Gaasterland T., Gaasterland T. Impact of alternative initiation, splicing, and termination on the diversity of the mRNA transcripts encoded by the mouse transcriptome. Genome Res. 2003;13:1290–1300. doi: 10.1101/gr.1017303. [DOI] [PMC free article] [PubMed] [Google Scholar]