Abstract
Syndromic surveillance systems are being deployed widely to monitor for signals of covert bioterrorist attacks. Regional systems are being established through the integration of local surveillance data across multiple facilities. We studied how different methods of data integration affect outbreak detection performance. We used a simulation relying on a semi-synthetic dataset, introducing simulated outbreaks of different sizes into historical visit data from two hospitals. In one simulation, we introduced the synthetic outbreak evenly into both hospital datasets (aggregate model). In the second, the outbreak was introduced into only one or the other of the hospital datasets (local model). We found that the aggregate model had a higher sensitivity for detecting outbreaks that were evenly distributed between the hospitals. However, for outbreaks that were localized to one facility, maintaining individual models for each location proved to be better. Given the complementary benefits offered by both approaches, the results suggest building a hybrid system that includes both individual models for each location, and an aggregate model that combines all the data. We also discuss options for multi-level signal integration hierarchies.
INTRODUCTION
The threat of bioterrorism has thrown into greater relief the critical need for timely detection of infectious outbreaks.1 This awareness has resulted in a greatly accelerated time frame for major enhancements to the public health infrastructure.2 The emerging discipline of syndromic surveillance enables the real-time monitoring of pre-diagnostic information for the first signs of a covert biological warfare attack. Such an attack could be detected as an exceedence in the expected numbers of victims seeking health care and engaging in health care-related behaviors. For example, patients with early-stage anthrax infection may develop influenza-like symptoms and might visit primary care physicians or emergency departments (EDs) for treatment1. By detecting a surge in visits of patients with flu-like symptoms, a public health authority could get an early warning of a covert anthrax attack,3 perhaps within the first two days, enabling prompt identification, containment, treatment, and prophylaxis.
In a given region, simultaneous interpretation of multiple data streams from different sources is often necessary. One example of this signal integration challenge is the need to interpret syndromic data from two different emergency departments in a given region. Another is the higher level integration of data from multiple regions. With multi-tiered syndromic surveillance systems being deployed across the country at the local, state and national levels, the question of how best to integrate data from multiple local systems is of critical importance.
We consider two modeling methods for integrating surveillance data across multiple systems. The first is to maintain separate local models for each system. This effectively creates a collection of many individually localized syndromic surveillance systems that report their results to one central authority. The second method is to combine the data from all the systems into one aggregate model that covers many locations.
We set out to study the effects of different integration methods on overall system performance, including model accuracy and detection sensitivity. We did so by constructing both local and aggregate models of historical visit data from two hospitals. We then introduced simulated outbreaks of various sizes and measured the overall detection performance of the various models.
METHODS
Settings and Subjects.
Data were extracted from two hospital information systems. Hospital 1 is an urban, academic, tertiary care general hospital with an ED that sees approximately 50,000 patients annually. Hospital 2 is an urban, academic, tertiary care pediatric hospital with a similar catchment area and also having an annual ED census of approximately 50,000 visits. Eligible subjects were all patients seen in Hospital 1 and Hospital 2 between June 1, 1998 and December 25, 2002. This time period included 1,668 consecutive days at each hospital. No patient identifying information was used in this study. Institutional review board approval for the study was obtained at both hospitals.
Syndromic Grouping.
The chief complaints and ICD (International Classification of Disease) codes of eligible patients were used to select those ED encounters that were related to respiratory illness. At Hospital 1, chief complaints are entered in free text during the triage process. We used two procedures to classify complaints. One was to search for words in the complaint that occur with high frequency among patients with respiratory ICD codes. The other was to utilize a Bayesian classification program developed at the University of Pittsburgh, and made publicly available4,5. Default probabilities from a Pennsylvania ED dataset, supplied with the software, were applied to the Hospital 1 data. At Hospital 2, chief complaint codes were chosen during the triage process, from an online constrained list with 181 choices. A previously validated subset of the constrained chief complaint set was chosen a priori for inclusion in the respiratory syndromic grouping. 6
ICD diagnostic codes for patients at both hospitals are assigned after the ED visit and then again during the billing process. ICD codes were grouped into the respiratory syndromic classification according to the military Electronic Surveillance System for the Early Notification of Community-based Epidemics (ESSENCE)7 respiratory syndrome classification (available at www.geis.ha.osd.mil).
For each hospital, to determine if a given visit was classifiable as a respiratory syndrome we included those visits that had either a respiratory-related chief complaint or a respiratory-related ICD diagnostic code.
Modeling.
The next step in building syndromic surveillance systems after assembling and categorizing the input data is building a historical model.8 We constructed three historical models: (1) based on the daily visit totals for Hospital 1; (2) based on the daily visit totals for Hospital 2; (3) based on the daily visit totals for Hospital 1 and Hospital 2 combined. These three models are referred to as Hospital 1, Hospital 2, and COMB, respectively.
We used 80% of the data (1,334 days) to train the models, and the remaining 20% of the data (334 days) to test the model accuracy.
We have previously described the historical modeling methodology9. The general approach was to separate the signal into its various stationary and periodic components. First, the overall mean of the entire data series was calculated and subtracted out. An average weekly trend was then calculated from the remaining signal and subtracted out as well. Finally, an average yearly trend was calculated from the remaining signal. The resulting model consisted of the sum of these three components: the overall mean, the weekly signal, and the yearly trend. Using these models, predictions were generated for the daily respiratory-related visit totals in the test range (the final 20% of the time period covered by the data).
Detection.
The next stage in building a syndromic surveillance system is detection--evaluating the significance of the difference between predictions made by the historical model and the actual visit totals recorded in the hospital.
In order to test the effects of data integration methods on detection performance, we introduced simulated disease outbreaks into the three daily visit time series and presented them to the three models -- Hospital 1, Hospital 2 and COMB. We evaluated the detection sensitivity of these models under two sets of conditions. First, we introduced a 30% increase in daily visits, evenly distributed across both hospitals. This led to a 30% increase in the COMB signal as well.
Second, we introduced a 30% increase in only one of the hospitals, with no increase in the other hospital. This meant that the simulated outbreaks were localized to one facility, and led to a smaller increase in the overall COMB signal.
The methods for simulation were in keeping with those previously described9. Briefly, 110 simulated outbreaks, each seven days long, and spaced 15 days apart, were inserted over the 1,668 days. During every day of an outbreak, a fixed number of visits (the magnitude of the outbreak) were added to the daily visit totals. We set the magnitude of the outbreaks to 30% of the average number of respiratory-related daily visits for that mo del. This fixed ratio of outbreak size to average daily volume allowed comparison of detection performance across the different time series.
Sensitivity was calculated as the total number of outbreak days with an alarm divided by the total number of outbreak days. Specificity was calculated as the total number of non-outbreak days without alarms divided by the total number of non-outbreak days. In order to compare sensitivities across the different models, we set a fixed false alarm rate (1-specificity). Alarm thresholds were calibrated to achieve a benchmark false alarm rate of 7% (specificity of 93%), selected to allow comparison across all the different models. This rate can be changed to suit the needs of any particular system. It is not expected that different rates will have dramatic effects on the results reported here.
RESULTS
Model Error.
Table 1 shows that the error variability did not scale linearly with the average number of daily visit numbers. Instead, the models with more average visits per day seemed to have relatively less noise.
Table 1.
Evaluation of the historical models based on daily respiratory -related visits seen at Hospital 1, Hospital 2 and at both hospitals combined (COMB): Average daily visits; the standard deviation of the error signal for the models; the Mean Absolute Percentage Error (MAPE) achieved by the model.
| AVG | STDDEV | MAPE | |
|---|---|---|---|
| Hosp 1 | 20.90 | 5.37 | 22.03 % |
| Hosp 2 | 40.39 | 8.20 | 23.04 % |
| COMB | 61.29 | 10.24 | 16.93 % |
The model error, measured as mean absolute percentage error, also decreased with larger numbers of average daily visits.
Detection.
Table 2 shows that when both hospitals had increases of 30%, the COMB model achieved significantly higher sensitivity than the two individual models.
Table 2.
Simulation results for evenly-distributed outbreaks. The combination model achieved a better sensitivity than the individual model.
| Outbreak size 30% visits/day | Sensitivity[95% CI] | |
|---|---|---|
| Hosp 1 | 6.27 | 0.36 [0.33, 0.40] |
| Hosp 2 | 12.12 | 0.43 [0.39, 0.46] |
| COMB | 18.39 | 0.69 [0.66, 0.72] |
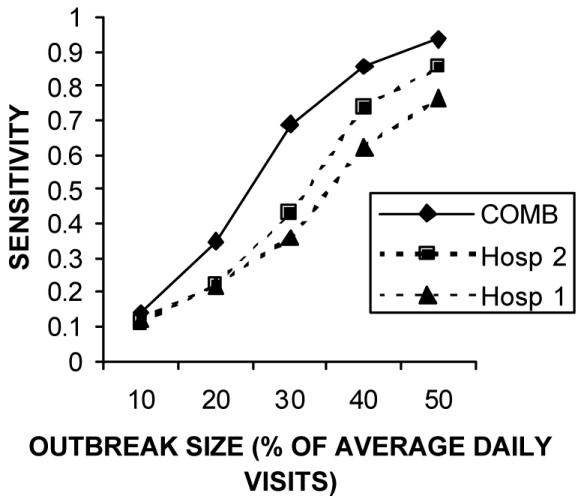
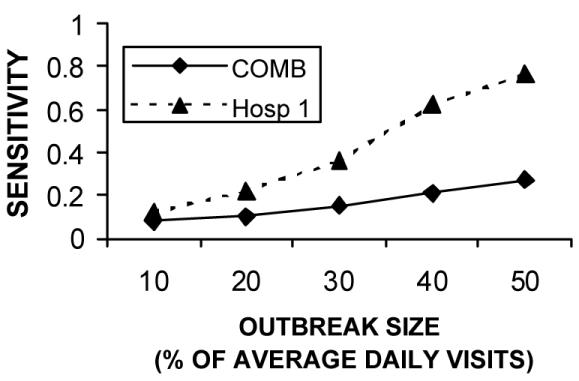
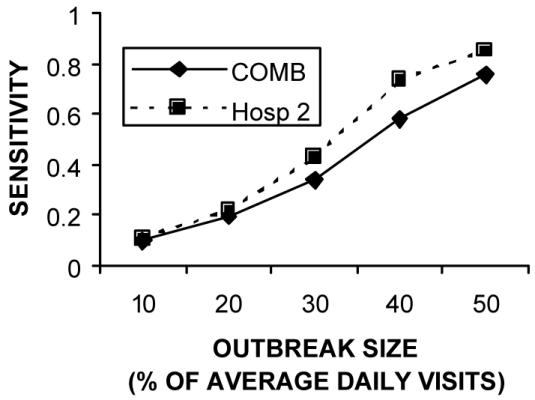
Figure 1 shows that the sensitivity advantage for the COMB model held for a wide range of outbreak sizes. Table 3 shows that when only one hospital had a 30% increase, the individual model for that hospital achieved a better sensitivity than the COMB model. Figures 2 and 3 show that this sensitivity advantage for localized outbreaks held true over a wide range of outbreak sizes.
Figure 1.

Sensitivity of the individual and aggregate models in detection outbreaks of different sizes. The results show that the aggregate model maintains a significant sensitivity advantage over a wide range of outbreak sizes.
Table 3.
Simulation results for localized outbreaks. In both cases, the localized model achieved a better sensitivity than the combination model.
| Sensitivity to local Hospital 1 [95% CI] | Sensitivity to local Hospital 2 [95% CI] | |
|---|---|---|
| Hosp 1 | 0.36 [0.33, 0.40] | - |
| Hosp 2 | - | 0.43 [0.39, 0.46] |
| COMB | 0.15 [0.13, 0.18] | 0.34 [0.30, 0.37] |
Figure 2.

Comparing sensitivity to localized Hospital 1 outbreaks for a variety of outbreak
Figure 3.

Comparing sensitivity to localized Hospital 2 outbreaks for a variety of outbreak
DISCUSSION
We have found that combining data across institutions is optimal if outbreaks are expected to cause excess visits at both institutions. This is consistent with the findings that the larger combination model has relatively less noise than the individual models. In our analysis, model error decreased as the average daily visit number grew, as would be expected from the law of large numbers.
On the other hand, the results suggest that maintaining individual models is better for detecting localized outbreaks. One could envision an outbreak that had a differential effect on the population of two different hospitals. One hospital may serve a different catchment area than the other. Or there may be fundamentally different populations at each hospital. In our study, we looked at data from both a pediatric and an adult hospital--clearly these populations could be differentially infected by, for example, an exposure at a school. Local models proved better at identifying outbreaks primarily having an impact on patients seeking care at one facility.
Given the different advantages of local and aggregate models, we recommend constructing hybrid systems that maintain both individual and aggregate models. It is expected that this approach enables a system to gain better sensitivity for both widely distributed outbreaks as well as for outbreaks that are localized to one or more facilities.
It is also possible to aggregate the data at multiple different levels. Supervised or unsupervised clustering techniques could be employed to create multi-tiered hierarchies of data groupings. If grouped wisely, these mid-level combination models would achieve increased sensitivity by aggregating across facilities (e.g. all pediatric hospitals, or all downtown hospitals) without losing the sensitivity to localized outbreaks.
CONCLUSIONS
The results suggest that while an aggregate model has a higher sensitivity for detecting outbreaks that are evenly distributed across multiple locations, individual models are better for detecting localized outbreaks. These findings are independent of the outbreak size.
We recommend a hybrid approach that maintains both localized and aggregate models, each providing its own complementary advantages in increased detection performance. The data may also be grouped at multiple levels of aggregation to provide additional meaningful perspectives on the data. These findings and recommendations can be put to practical use today in guiding the development of surveillance systems being built at the local, state and national levels.
Acknowledgments
This work was supported by the National Institutes of Health through a grant from the National Library of Medicine (R01LM07677-01), by contract 290-00-0020 from the Agency for Healthcare Research and Quality and by the Alfred P. Sloan Foundation (Grant 2002-12-1). We gratefully acknowledge the methodological contributions of Karen Olson, PhD, Shlomit Feit, and Allison Beit el, MD that enabled generation of the datasets used in this study. We also thank John Halamka, MD, MS for his invaluable help.
References
- 1.Jernigan JA, Stephens DS, Ashford DA, et al. Bioterrorism-related inhalational anthrax: the first 10 cases reported in the United States. Emerging Infectious Diseases. 2001;7(6):933–944. doi: 10.3201/eid0706.010604. [DOI] [PMC free article] [PubMed] [Google Scholar]
- 2.Kohane IS. The contributions of biomedical informatics to the fight against bioterrorism. J Am Med Inform Assoc. Mar–Apr. 2002;9(2):116–119. doi: 10.1197/jamia.M1054. [DOI] [PMC free article] [PubMed] [Google Scholar]
- 3.Gesteland PH, Wagner MM, Chapman WW, et al. Rapid deployment of an electronic disease surveillance system in the state of utah for the 2002 olympic winter games. Proc AMIA Symp. 2002:285–289. [PMC free article] [PubMed] [Google Scholar]
- 4.RODS Laboratory. RODS: Real-time Outbreak and Disease Surveillance Software Packages. Available at: http://www.health.pitt.edu/rods/sw/default.htm Accessed January 31, 2003.
- 5.Ivanov O, Wagner MM, Chapman WW, Olszewski RT. Accuracy of three classifiers of acute gastrointestinal syndrome for syndromic surveillance. Proc AMIA Symp. 2002:345–349. [PMC free article] [PubMed] [Google Scholar]
- 6.Beitel AJ RB, Mandl KD. Use of emergency department chief complaint and ICD9 diagnostic codes for real time bioterrorism surveillance (Abstract) Pediatric Research. 2002;51(4 Pt 2):94a. [Google Scholar]
- 7.DoD-GEIS. "Electronic Surveillance System for the Early Notification of Community-based Epidemics (ESSENCE). Available at: http://www.geis.ha.osd.mil/GEIS/SurveillanceActivities/ESS ENCE/ESSENCEinstructions.asp. Accessed January 13, 2003.
- 8.Reis BY, Mandl KD. Time series modeling for syndromic surveillance. BMC Med Inform Decis Mak. 2003;3(1) doi: 10.1186/1472-6947-3-2. http://www.biomedcentral.com/1472-6947/1473/1472. [DOI] [PMC free article] [PubMed] [Google Scholar]
- 9.Reis BY, Pagano M, Mandl KD. Using temporal context to improve biosurveillance. Proc Natl Acad Sci U S A. 2003;100(4):1961–1965. doi: 10.1073/pnas.0335026100. [DOI] [PMC free article] [PubMed] [Google Scholar]


