Abstract
We developed a novel method for the discovery of functional relationships between pairs of genes based on gene expression profiles generated from microarrays. This approach examines all possible pairs of genes and identifies those in which the relationship between the two genes changes in different diseases or conditions. In contrast to previous methods that have focused on differentially expressed genes, this method attempts to find changes in the correlation between genes. These changes may be indicative of the functional relationships related to a disease mechanism. We demonstrate the utility of this approach by applying it to an oral squamous cell carcinoma (OSCC) microarray data set. Our results suggest new directions for future experimental investigations.
INTRODUCTION
Microarray technology has provided the biomedical research community with a powerful method for identifying transcriptional changes on a genome-wide scale. Gene expression studies using microarrays have thus far yielded considerable new insights into the transcriptional changes in different tissues and have contributed substantially to the classification of diseases. However, the volume and the complexity of gene expression data have also created new opportunities and challenges in the extraction of knowledge from data. Various computational and statistical methods have been developed in both private and public domains for analysis of microarray data [1]. These tools range from simple analysis such as fold change and basic statistical tests for differential expression to more complex algorithms such as neural networks and other machine-learning techniques. Typical unsupervised methods include clustering techniques such as hierarchical clustering [2] and self-organizing maps [3]. In the supervised setting, various methods have been applied for the purpose of class discovery as well as class prediction of samples [4].
A difficulty in analyzing microarray data is our incomplete understanding of gene interactions for most biological systems. As a result, most studies have simply focused on each gene independently, attempting to find a set of genes whose expression levels change across various conditions or experiments. For example, many studies have compared two sets of samples, such as cancer and normal tissues, and found thousands of genes that are differentially expressed between the groups; other studies have compared three or more groups. We have recently taken this approach to examine the progression of oral cancer [5].
In the present study we seek a different question: we ask not whether a particular gene is highly expressed in a diseased tissue when compared to a normal tissue, but, more fundamentally, whether the functional relationships between two genes change across different conditions or experiments.
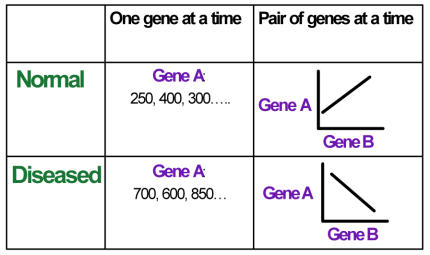
In Figure 1, we illustrate the new approach of examining a pair of genes instead of one gene at a time. For example, Gene A and B may be positively correlated in the normal condition, but negatively correlated in the diseased case. Interpretation of this analysis may potentially provide more information about the mechanism or function underlying the disease. Focusing on one gene at a time can only provide a partial view of this interaction. The most interesting pairs of genes would be those that behave inversely in the two conditions. In the following sections, we describe the statistical method and then apply it to an OSCC data set to verify its usefulness.
Figure 1a.
Comparing the two approaches: 1) finding differential expression between two genes; 2) finding the change in the relationship between two genes.
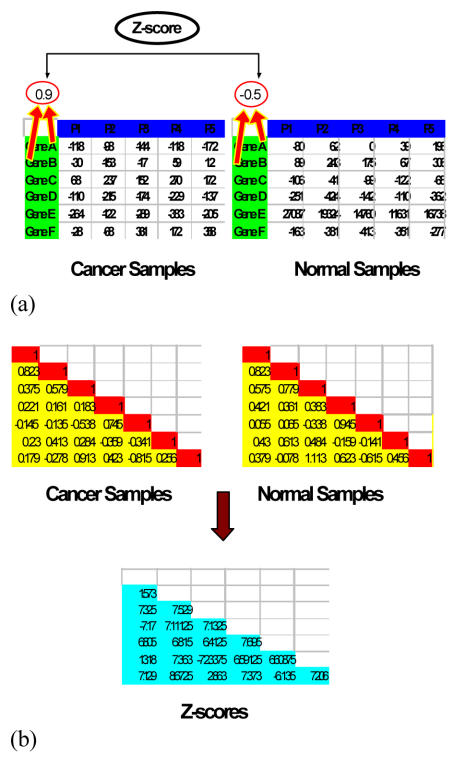
Figure 1b.
Computation of Z-scores after using Fisher’s Z-transformation. (a) We computed the correlation coefficients between gene A and gene B and then obtain a statistic to see whether the change in correlation coefficient is statistically significant. (b) This process was carried out for all pairwise combinations. The numbers from the two similarity matrices were transformed using the Fisher z-trans formation and the Z-scores computed from the pair of transformed values and stored in a new matrix.
MATERIALS AND METHODS
The oral cancer gene expression data set was obtained from OSCC tissue samples as reported by Mendez et al [6]. The experimental design included tumor samples from patients diagnosed with squamous cell carcinoma and normal tissue samples obtained from healthy patients who were scheduled for an oral surgical procedure not related to cancer. The collected samples were prepared for RNA isolation, linearly amplified, labeled, and hybridized to Affymetrix HuGeneFL microarrays, which contained 7,070 genes.
For the analysis, we had expression profiles from a total of 36 patients (28 cancer and 8 normal samples). The data were pre-processed through multiple filtering steps:
The expression values less than 50 were set to “50”; below this value, expression values can be considered noise and unreliable. Since this was an older generation Affymetrix array, many negative values were present, and these were replaced in the same way.
About a thousand genes that had uniformly negative or very low values for most samples in both conditions were removed.
Those genes with low overall variance across all the samples were eliminated since they are of limited interest.
Without filtering, many top scoring pairs had high correlations due to the negative outlier values. Eliminating these cases using proper filtering reduced the amount of noise in interpreting the data.
For each group of samples, the pairwise Pearson correlations were calculated and represented in a correlation matrix (Figure 1). For each correlation coefficient for a pair of genes , a Fisher’s Z-transformation was applied. The transformation is given by the equation,
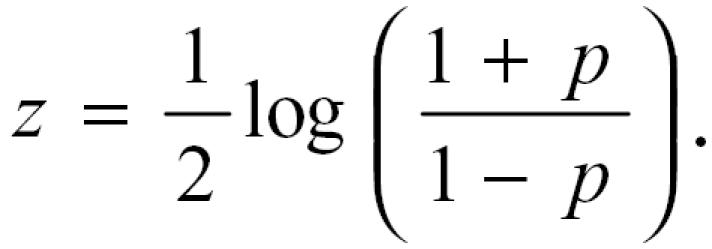 |
This transformation results in the change of the range of the variable, and makes it possible to derive (or apply) a statistical test. For any given set of observations, the range of the correlation is −1 ≤ p ≤ 1, but after transformation the range of the new variable is − ∞ ≤ z ≤ ∞. M ore importantly, the Fisher’s transformation improves the distributional property and allows a statistical test to be devised under normality assumptions.
Using transformed values, a statistical test was then applied to see whether the change in the correlation for that gene is statistically significant. The larger Z-scores indicate that the gene pair relationships are statistically significant. The Z-score is given by the equation,
 |
where N1 and N2 are the sample sizes for the two groups. If the Pearson correlation coefficient is used, the assumption is that the underlying relationship is linear between two variables. A problem using this measure is that if the relationship were not linear, it would not provide a valid measure of their association. More importantly, it can be severely distorted by undue influence from outliers, and thus may not provide an accurate description of the underlying behavior of the genes. Outliers can significantly change the results, especially for Affymetrix data, where extremely high values may be present. To reduce the effects of outliers, one could remove the outliers and recalculate the correlations; alternatively, one could use a non-parametric test. For the dataset we studied, we applied both parametric and non-parametric correlations, and we observed that the results improved in general when the non-parametric Spearman rank correlation was applied to the data.
The significant gene-pairs we obtained were entered into a literature cluster analysis program called PubGene [7]. We used the PubGene MeSH and literature network tools. All other analyses were performed using MATLAB (Math Works, Natick, MA).
RESULTS
The p-values generated by comparing the Pearson correlation similarity matrices of the OSCC and normal samples were obtained and ranked. Table 1 shows the top ten gene pairs and their associated p-values. The pairs of genes with the most significant scores were plotted in Figure 2. We found that some of the plots investigated showed the presence of outliers as in Figure 2. Of the top 10 gene pairs, 6 were found to be associated to some type of cancer (highlighted in red) when linked to disease MeSH terms. Among the six, three gene pairs CORO1A and CXCR4, CORO1A and CR2, CXCR4 and CR2 were linked to oral cancer MeSH terms in particular.
Table 1.
P-values of the top ten gene pairs from the Pearson correlation similarity matrix
| Gene 1 | Gene 2 | Cancer Samples | Normal Samples | P-value |
|---|---|---|---|---|
| EST | ICSBP1 | 0.0278 | 0.999974 | < 0.00001 |
| CORO1A | CXCR4 | 0.0045 | 0.999909 | < 0.00001 |
| CD48 | CD79B | −0.0881 | 0.999303 | < 0.00001 |
| IGL | TRB | 0.0002 | 0.999386 | < 0.00001 |
| ALK | TFF1 | 0.0657 | 0.999190 | < 0.00001 |
| CORO1A | CR2 | −0.1328 | 0.998793 | < 0.00001 |
| MS4A1 | EST | −0.1064 | 0.998518 | < 0.00001 |
| EST | HLA-DPB1 | −0.1957 | 0.998061 | < 0.00001 |
| CXCR4 | CR2 | 0.3282 | 0.999296 | < 0.00001 |
| APOE | POU2AF1 | −0.2053 | 0.997812 | < 0.00001 |
Figure 2.
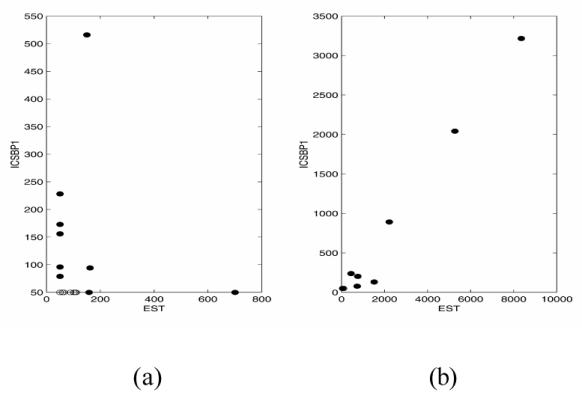
Scatterplot of gene pairs ICSBP1 and an EST using Pearson correlation coefficient. (a) Cancer samples and (b) Normal samples. Notice that the correlation is almost 1 in the Normal group.
Since using the Pearson coefficient was not always suitable, Spearman rank correlations was also used. We noticed when examining the high ranked genes in this group, they were different from those obtained using the Pearson Correlation measure (Figure 3). In Table 2, the p-values generated from the Spearman rank correlation matrix were obtained and ranked. Most of the gene pairs were paired with ESTs or unknown genes, indicating potential novel genes that have relevant functions. The top three gene-pairs in this group based on disease MeSH terms was found to be associated with neoplasms, genetic predisposition to a disease, and disease progression. Interestingly, the top gene pair, PIN and IGFBP4 was linked to a “precancerous condition” from the disease MeSH terms.
Figure 3.
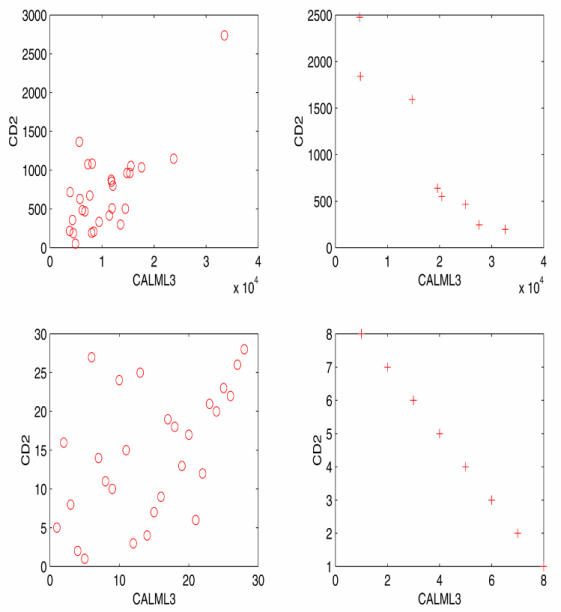
Scatterplot of gene pairs CD2 and CALML2 using Spearman-rank correlation. Top two are plots of the gene expression values of the gene pairs in the cancer and normal groups and bottom two are the plots of the ranks.
Table 2.
P-values of the top ten gene pairs from the Spearman-rank correlation similarity matrix
| Gene 1 | Gene 2 | Cancer Samples | Normal Samples | P-value |
|---|---|---|---|---|
| EST | CASP4 | −0.6124 | 0.999 | < 0.00001 |
| EST | EST | −0.5649 | 0.999 | < 0.00001 |
| EST | LCP1 | −0.5386 | 0.999 | < 0.00001 |
| PIN | IGFBP4 | −0.5073 | 0.999 | < 0.00001 |
| CALML3 | CD2 | 0.5013 | −0.999 | < 0.00001 |
| FABP5 | AKT1 | −0.4718 | 0.999 | < 0.00001 |
| EST | SNRPD2 | −0.4641 | 0.999 | < 0.00001 |
| HLA-DQA1 | EST | −0.4592 | 0.999 | < 0.00001 |
| CD14 | EST | −0.4381 | 0.999 | < 0.00001 |
| RPS28 | EMP3 | −0.4345 | 0.999 | < 0.00001 |
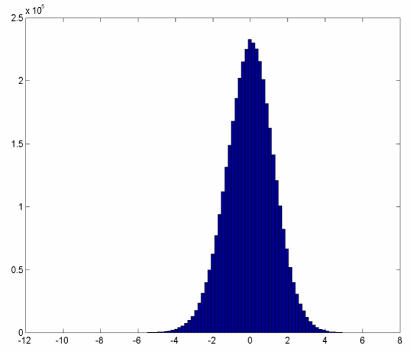
The histograms of the overall Z -scores for both Pearson (Figure 4) and Spearman (not shown) approaches displayed a standard normal distribution, as the number of pairwise combinations were very large. The areas of interest would be those with Z-scores that lie at the tails of the curve.
Figure 4.
Histogram of the Z-scores for changes in the Pearson correlation coefficients for the cancer and normal samples .
DISCUSSION
Finding differential correlation as described above is a novel approach for detecting functional relationships among gene pairs. This method attains its effectiveness by examining pairs of genes exhaustively and evaluating their significance. The idea is to examine pairs of genes under different conditions, and find the genes whose relationship has changed significantly across the conditions. The general hypothesis is that genes that behave differently in different disease conditions are more likely to be related to a disease mechanism. When the number of samples is large for each condition, the correlation coefficients become a good approximation to the true values and the method is likely to find significant functional relationships.
OSCC is a multi-step process in which there is a sequential activation of oncogenes and inactivation of tumor suppressor genes. These genetic changes generate concomitant phenotypic changes in the tumor cells that allow the cells to continue to survive and expand. Constructing signaling pathways through the identification of specific gene-pairs and the sequence in which they appear can be beneficial in our understanding of the mechanisms involved in the development of OSCC. Examining a subset of gene-pairs we found, CORO1A and CXCR4, CORO1A and CR2, CXCR4 and CR2 were very interesting, since all three genes were somewhat related to each other. For example, the primary function of CORO1A, an actin binding protein, is that it plays a role in signal transduction pathways of chemotaxis and its pair CXCR4 is a receptor for the C-X-C chemokine SDF-1, which tranduces a signal by increasing intracellular calcium ion levels. So both of these genes not only have similar functions but also are involved in signal transduction pathways. CR2, a complement component receptor was found to have a similar role as CXCR4.
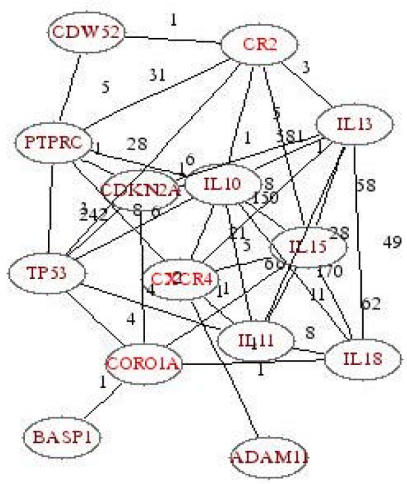
The PubGene literature network revealed that all three genes were somehow connected to P53 (Figure 5), a tumor suppressor gene, known to be associated with OSCC. Independent PubGene searches of the three gene-pairs all had a link to p53 (not shown).
Figure 5.
Literature network of genes CORO1A, CR2 and CXCR4. For each link (line), the numbers indicate the number of abstracts for which the two linked genes were found in the same abstract in MEDLINE.
We used both the Pearson and the Spearman correlation coefficients, although the Pearson correlation sometimes gave spurious results due to the outlier effect. In both cases, we were able to find some interesting gene-pair relationships, which indicates the effectiveness of this approach.
The results from this study are very interesting, but these are preliminary findings and further studies are necessary, which also include controlled experiments. Other future directions include the expansion of this approach to analyze multiple pairs of genes and eventually a network of genes. Algorithmic improvements would also include other metric comparisons.
Acknowledgments
This work was inspired by discussions involving relevance networks [8] at one of our weekly Data Sharing sessions at Children’s Hospital Informatics Program (www.chip.org).
REFERENCES
- 1.Quackenbush J. Computational analysis of microarray data. Nat Rev Genet. 2001;2(6):418–27. doi: 10.1038/35076576. [DOI] [PubMed] [Google Scholar]
- 2.Eisen MB, Spellman PT, Brown PO, Botstein D. Cluster analysis and display of genome -wide expression patterns. Proc Natl Acad Sci U S A. 1998;95(25):14863–8. doi: 10.1073/pnas.95.25.14863. [DOI] [PMC free article] [PubMed] [Google Scholar]
- 3.Tamayo P, Slonim D, Mesirov J, Zhu Q, Kitareewan S, Dmitrovsky E, et al. Interpreting patterns of gene expression with self -organizing maps: methods and application to hematopoietic differentiation. Proc Natl Acad Sci U S A. 1999;96(6):2907–12. doi: 10.1073/pnas.96.6.2907. [DOI] [PMC free article] [PubMed] [Google Scholar]
- 4.Golub TR, Slonim DK, Tamayo P, Huard C, Gaasenbeek M, Mesirov JP, et al. Molecular classification of cancer: class discovery and class prediction by gene expression monitoring. Science. 1999;286(5439):531–7. doi: 10.1126/science.286.5439.531. [DOI] [PubMed] [Google Scholar]
- 5.Kuo WP, Jenssen TK, Park PJ, Lingen MW, Hasina R, Machado-Ohno L. Gene expression levels in different stages of progression in oral squamous cell carcinoma. Proc AMIA Symp. 2002:415–9. [PMC free article] [PubMed] [Google Scholar]
- 6.Mendez E, Cheng C, Farwell DG, Ricks S, Agoff SN, Futran ND, et al. Transcriptional expression profiles of oral squamous cell carcinomas. Cancer. 2002;95(7):1482–94. doi: 10.1002/cncr.10875. [DOI] [PubMed] [Google Scholar]
- 7.Jenssen TK, Laegreid A, Komorowski J, Hovig E. A literature network of human genes for high-throughput analysis of gene expression. Nat Genet. 2001;28(1):21–8. doi: 10.1038/ng0501-21. [DOI] [PubMed] [Google Scholar]
- 8.Butte AJ, Tamayo P, Slonim D, Golub TR, Kohane IS. Discovering functional relationships between RNA expression and chemotherapeutic susceptibility using relevance networks. Proc Natl Acad Sci U S A. 2000;97(22):12182–6. doi: 10.1073/pnas.220392197. [DOI] [PMC free article] [PubMed] [Google Scholar]


