Abstract
A Computerized Physician order entry (CPOE) system was successfully implemented at the Ohio State University Medical Center (OSUMC) in February 2000. The electronic entry and use of order sets is designed to standardize patient care and improve efficiency and patient safety. To evaluate the effectiveness of the CPOE system and to maximize its benefits, one needs to easily access and analyze the data. Since the CPOE system is not equipped to support such on demand analysis, the data from the system is extracted daily into the OSUMC’s Information Warehouse (IW). This allows the CPOE data to be linked with other clinical and financial patient information in the IW to provide detailed and comprehensive analysis. Our focus in this paper is the use of the IW as a tool to analyze order set usage patterns and the opportunities such analysis provides for improvements in education, resource utilization and patient care.
INTRODUCTION
Background
Improvements in healthcare delivery in recent years are rooted in the continued industry wide investments in information technology1. One such investment that has come to the forefront for many hospitals, including the OSUMC, is the implementation of a CPOE system2. Development of this product was preceded by intensive needs analysis, design, system adaptation and customization3, 4. In February of 2000, the first rollout of the CPOE system at the OSUMC was successfully completed. For such an undertaking there is always an ensuing debate on the risk of cultural changes in practice the system demands, the overall financial burden the system imposes and the overall benefits the system may provide. Any fears related to the investment subsided when rudimentary analysis from the system identified preliminary evidence of improved patient care, cost savings and enhanced clinical and research benefits.
In the wake of this excitement it also became evident that to continue to enhance the benefits derived from the system, time consuming custom coded programs were not adequate to perform this analysis on an ongoing basis. To fully realize the enormous potential of the system one needs a method to organize this data in an environment where it is easily accessible and amenable to quick on-demand retrospective analysis. Our focus in this paper is the use of the IW as a tool to analyze order set usage patterns and the opportunities such analysis provides for improvements in education, resource utilization and patient care.
Order Set Usage
A CPOE provides the clinicians with valuable patient information at the point of care, as well as the ability to standardize care by automating the use of order sets. An order set is a pre-filled ordering template, or electronic protocol that is derived from evidence based best practice guidelines. These guidelines are reviewed and developed by the ‘Clinical practice guideline policy’ committee, one of the four committees of the Leadership Council at the OSUMC. Through an extensive review process and literature search in support of evidence for better disease management by the use of guidelines, the committee evaluates adaptation and implementation of new guidelines at the OSUMC. In instances, where such evidence is not available through research, and the presence of a guideline is deemed beneficial for a specific disease management, the guideline is developed through a consensus and a thorough review process. Once a guideline is accepted, the contents of the guidelines are translated into a workflow that can then be adapted into one or more order sets and automated through the CPOE system. The committee assumes the role of educating the physicians and house staff regarding the evidence based best practice guidelines as well as the order sets derived from these guidelines. More than six hundred such order sets have been automated since the CPOE implementation. While the guidelines were available even prior to CPOE implementation, the use of the guidelines in patient care has been facilitated through the inclusion of the order sets in the CPOE system.
Most of the benefits of standardizing care can only be realized if the physicians actually use the order sets. To be able to enhance the interaction between the system and the physician and for the order sets to be an effective method for better and more efficient patient care; one has to constantly evaluate the utilization of the order sets. This analysis is essential due to the large role order sets play in the CPOE environment. The number of orders placed from an order set has steadily increased over the years and currently more than 40% of the orders originate from an order set. By analyzing these order set patterns we are able to get a snapshot of resource utilization and physician practice preferences.
The inclusion of CPOE data in the IW provides us with an ideal tool to perform such analysis. We can identify which departments and services are best using order sets. Are some order sets preferred over others? Or are the physicians resistant to using them? These are just few of the questions that we now have the ability to answer efficiently.
While the inclusion of CPOE data itself allows us to study the order set usage patters, leveraging this data with other patient information in the IW, such as ICD9 diagnosis codes, DRG’s, procedure codes, charges, revenue etc. enables us to analyze outcomes and compliance statistics for order sets. Which DRG’s have the highest order set compliance? What are the practice variations among physicians? Using the CPOE data in conjunction with the historical data in the IW also provides a convenient platform to analyze pre and post order set implementation outcomes.
METHODS
Requirements Analysis
The task of designing a data model to accommodate the thousands of data elements that constitute the CPOE system required a detailed understanding of the source data structure. Incorporating the numerous business rules associated with the data and the system are vital in developing a robust data model, and customization is often necessary. Users from many different areas within the organization were consulted for their business and analytical requirement needs.
Data Model
While there are many tables that store small, detailed information of an order, at the heart of the data model is the Orders table. Each record in the table represents one order and contains all high level information about the order such as, order description, department, type of order, frequency, dose, order entry date, etc. This table also houses essential, frequently used attributes needed in order set analysis such as order set name, ordering health care professional, the patients current clinical service and patient location at the time the order set was placed. Quite a few of the data elements in the table are custom fields that were not directly available from the source system but derived by applying intricate logic and unraveling business rules buried deep in the source data. For example, the actual clinical service a patient was on at the time of the order was not available from the source. By linking with other tables dealing with census data, we were able to provide this information in the IW. Adding this extra work at the back end to add these custom fields has not only added analytical convenience and a much more friendly user environment, but has also sparked discoveries in areas that, otherwise, would never have been considered.
Data Extraction and Load
Figure 1 shows the basic architecture of the process of integrating the CPOE data with the IW. An automatic extract of CPOE data for discharged patients is sent daily to be incorporated in the IW. The data is first loaded into staging tables where the data is validated for business rules and, the custom fields, introduced in the data model, are derived and calculated. An automatic process then picks up the data from the staging tables to load the CPOE data in the IW database. To further facilitate the analysis, data is aggregated and loaded into summary tables.
FIGURE 1.
Refresh process of CPOE data
Data Access
Consolidating the CPOE data in the IW has allowed access to the data through multiple analytical tools. The tools available through the IW are Ad Hoc querying tools (ORACLE DiscovererTM, SQL), Online Analytical Processing programs (Crystal Decisions HolosTM), and Web Applications. These three applications provide a flexible, user-friendly method for accessing the CPOE data mart tool.
RESULTS
Since the time that the CPOE data has been in the IW, ordering trends for order sets have become apparent and, as shown through the following examples, are providing additional information for best practice guidelines and insights into the use of order sets. The examples presented also emphasize the different ways the data is accessible from the IW.
Variations in practice
Using the ad hoc query tool, the following example shows the practice variations across different hospital services as well as physicians, for a common diagnosis related grouping (DRG) of 143 (chest pain).
The guideline for chest pain recommends the use of one of three orders sets; ADM ACUTE MI, ADM ANGINA/ROMI/CAD, and ROMI SECONDARY DX. The analysis, based on order set usage, allows us to see if patients admitted for chest pain to a specialty care service, such as cardiology, receive care more in compliance with the defined best practice guidelines than those admitted to another service. Out of the 183 patients with DRG 143 in a given time period, Table 1 shows the breakdown of the use of the order sets, as dictated by the guideline, by the specialty service of the physician and hospital service to which the patient is admitted. As we can see from the results in Table 1, there is a wide range of variance of practice from one hospital service to another. Patients on the cardiology service, attended by physicians with cardiology specialty, as expected, received the order sets defined in the best practice guidelines more frequently than patients on other hospital services. Surprising, however, is the fact that, even in cardiology, these order sets are placed for less than 50% of the patients. Another observation that stands out from this analysis is the fact that the order set ADM ACUTE MI was never used for this DRG.
Table 1.
Percentage of compliance with best practice guidelines for patients with DRG 143(Chest Pain), broken down by attending physician service and ordering/discharge service
| Physician Specialty | Hospital Service | Total Patients | Patients With Guideline Order Set | Patients With Adm Angina/Ro mi/Cad | Patients With Romi Secondary DX | Patients with Adm Acute MI | Patients Without Guideline Order Set | Percentage of Total With Guideline Order Set |
|---|---|---|---|---|---|---|---|---|
| CARDIOLOGY | CARDIOLOGY | 32 | 15 | 15 | 0 | 0 | 17 | 47% |
| HEMOTOLOGY | HEMOTOLOGY | 3 | 1 | 1 | 0 | 0 | 2 | 33% |
| ENDOCRINOLOGY | ENDOCRINOLOGY | 41 | 12 | 3 | 9 | 0 | 29 | 29% |
| GENERAL MEDICINE | GENERAL MEDICINE | 81 | 13 | 10 | 3 | 0 | 68 | 16% |
| INSDIF | INSDIF | 9 | 1 | 1 | 0 | 0 | 8 | 11% |
| GENERAL MEDICINE | PULMONARY | 2 | 0 | 0 | 0 | 0 | 2 | 0% |
| NEPHROLOGY | NEPHROLOGY | 5 | 0 | 0 | 0 | 0 | 5 | 0% |
| PULMONARY | PULMONARY | 6 | 0 | 0 | 0 | 0 | 6 | 0% |
| MICU | PULMONARY | 2 | 0 | 0 | 0 | 0 | 2 | 0% |
| CT/SURGERY | CT/SURGERY | 1 | 0 | 0 | 0 | 0 | 1 | 0% |
| ONCOLOGY 1 | ONCOLOGY 1 | 1 | 0 | 0 | 0 | 0 | 1 | 0% |
The data in Table 1 provides a quick, quantitative analysis of where order sets are being used. From here, we can dig deeper to see why there is such variation. It’s possible that the guideline, as set up, does not sufficiently capture clinical requirements, or perhaps order sets have been inadequately defined. It’s possible that there may have been a specific medical condition for some patients where use of the three order sets is not warranted. Perhaps the physicians were not aware of the relevant order sets, or they were awkward to use. To understand these issues better, one must perform a detailed examination of how care is being provided.
To further investigate the ordering practices, especially for cardiology service, one can drill down, as shown in Table 2, and identify the physicians responsible for the patients in each service. From this table one can see variations in physician practice. With this analysis in hand, one could further drill down to the specific clinical information of these patients to determine whether the variances in practice result from unique patient condition or lack of physician education. Such analysis provides an opportunity to adapt our practice guidelines, alter the order sets to better reflect clinical requirements, or create new order sets that better serve the patient.
Table 2.
Percentage of compliance with best practice guidelines for patients with DRG 143 and attending physician in the Cardiology service
| Physicians From Heart Svc | Total Patients | Patients With A Guideline Order Set | Patients Without A Guideline Order Set | Percentage of total With Guideline Order Set |
|---|---|---|---|---|
| Physician 2 | 1 | 1 | 0 | 100% |
| Physician 3 | 1 | 1 | 0 | 100% |
| Physician 1 | 18 | 11 | 7 | 61% |
| Physician 7 | 2 | 1 | 1 | 50% |
| Physician 9 | 3 | 1 | 2 | 33% |
| Physician 4 | 1 | 0 | 1 | 0% |
| Physician 5 | 3 | 0 | 3 | 0% |
| Physician 6 | 1 | 0 | 1 | 0% |
| Physician 8 | 1 | 0 | 1 | 0% |
| Physician 10 | 1 | 0 | 1 | 0% |
One can also evaluate if the gender or age of the physician plays a role in their practice patterns.
Order set usage by hospital service
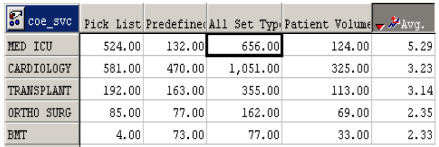
This example using the HolosTM OLAP tool demonstrates an intuitive way to analyze order set usage by hospital service. The first step of such an analysis is to determine which hospital services have the highest order set usage per patient. Figure 2 shows a screen print of one such view of the data. It shows the hospital services with the greatest average order sets per patient over a given period. One can just as easily see this information for services where the average is low. The worksheet also shows the breakdown of the order sets by format. At the OSUMC, the order sets are available in two formats: predefined and pick-list. In a predefined format every order in the set is included by default but the user has the option to deselect any orders they do not want. A pick list order set, on the other hand, gives the user the choice of selecting the appropriate order from a drop down list, instead of automatically selecting it for them3. This breakdown shown in Figure 2 has the potential to provide insights into the practice preferences of the health care providers for a particular format.
FIGURE 2.
Top 5 hospital services for order set usage during a month; ‘All types’ order sets include pick list and predefined order sets.
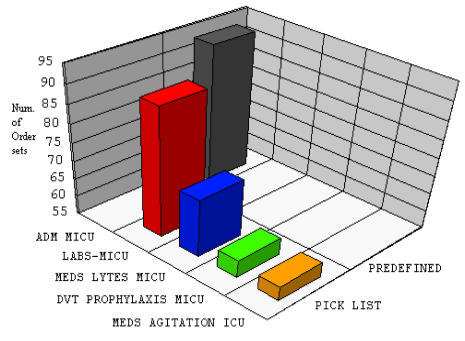
One can hypothesize that the use of these order sets has a large impact on utilization of hospital resources. The next obvious step of this analysis would be to identify what order sets comprise the aggregates in Figure 2. Figure 3 shows this type of drill down for the order sets most used in Med ICU service. One can further drill down to see which elements constitute each one of these order sets. It is these kinds of analysis that provides an efficient way of viewing statistics that can prompt the analyst to conduct more detailed and drill down studies into the data. One can take the insight gained from this information, and see exactly what orders constitute the ADM MICU or LABS-MICU order set. If one determines these truly are the high impact order sets, they can be fine-tuned by removing any redundancy and maximizing the efficiency of resource utilization.
FIGURE 3.
Drill down view of the Med ICU service of theTop 5 order sets used during a month.
Order Set Usage by DRG
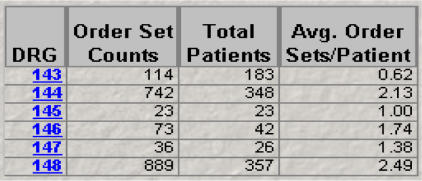
This example illustrates an easy way to analyze order set utilization by DRG. Figure 4, taken from our web application, displays the average order sets per patient grouped by DRGs. From this one can see on high level which DRGs are using the most resources by placing more order sets per patient. To see if this resource utilization stems from compliance with best practices or individual practice preferences of the caregiver, one needs to look at the detailed break down of the individual order sets used for each of the DRGs.
FIGURE 4.
Order Set usage for a group of DRGs in a given year.
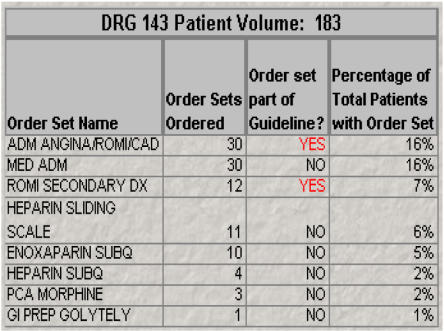
Since we have already discussed order set usage in compliance with best practices for DRG 143, as shown in Table 1, we will use the same DRG for this type of breakdown for this example. From Figure 5, we see a list of all order sets placed for DRG 143 and whether or not they are from the best practice guideline.
FIGURE 5.
Drill down of the order sets used with DRG 143.
As we might expect, the ADM ANGINA/ROMI/CAD order set is the most used order set for this DRG. Interesting, however, is the fact that there is an equally utilized order set, MEDADM, which is not in the guideline. Prompted by this observation, further comparisons of the orders constituting these order sets shows that majority of the orders in MED ADM and the guideline order sets overlap. This kind of information warrants further scrutiny to determine if the MED ADM order set should be included in the guideline or if its utilization is wasting valuable resources by activating non-essential patient care orders.
CONCLUSIONS
While the benefits of having a fully operational CPOE system are huge and well documented5, 6, 7, we have demonstrated that the presence of an on demand analysis conducive environment further augments the potential value of the system. We recommend that any implementation of a CPOE system be accompanied, even if in a small way, by the development of a method by which this data can easily be analyzed.
At the OSUMC, turning this vast amount of data into manageable information in the IW has opened a new paradigm for CPOE data analysis that allows, managers and physicians alike, to make business and clinical decisions based on analytical facts. The existence of the CPOE data in the IW now allows us to measure the changes in the outcomes related to the use of the CPOE system and to develop better practice guidelines by monitoring order set usage patterns. Analysis which once took days can now be performed in seconds. The knowledge discovery through this exclusive environment has given us the ability to manage more productively and better serve patients. The details obtained will be used to gain a better understanding of clinical guidelines, order sets and to iteratively refine the way in which order sets are defined and used. These types of analysis are improving our understanding of resource utilization patterns defined by DRG, service and physician. This understanding can only contribute to enhance systems and incorporate evidence based decision support systems into electronic means.
Acknowledgments
The authors are grateful to Asif Ahmad for his vision and leadership in facilitating the inclusion of CPOE data in the IW. We would also like to acknowledge the contributions of Dan Cowden, Mike Ostrander and Jennifer Santangelo in completing this paper.
REFERENCES
- 1.Best’s Review: New Technology Might Cut Medical Errors, Med-Mal Claims. Best Wire, Aug 2, 2002
- 2.Bates, Teich, Lee, Seger, Kuperman, Ma’Luf, et al. The Impact of Computerized Physician Order Entry on Medication Error Prevention. JAMIA. 1999 Aug;:313–21. doi: 10.1136/jamia.1999.00660313. [DOI] [PMC free article] [PubMed] [Google Scholar]
- 3.Ahmad, Teater, Bentley, Kuehn, Kumar, Thomas, et al. Key Attributes of a Successful Physician Order Entry Implementation in a Multi-Hospital Environment. JAMIA. 2002:15–24. doi: 10.1136/jamia.2002.0090016. [DOI] [PMC free article] [PubMed] [Google Scholar]
- 4.Mekhjian, Kumar, Kuehn, Bentley, Teater, Thomas, et al. Immediate Benefits Realized Following Implementation of Physician Order Entry at an Academic Medical Center. JAMIA. 2002 Oct;:529–39. doi: 10.1197/jamia.M1038. [DOI] [PMC free article] [PubMed] [Google Scholar]
- 5.Morrisey. Saved by the computer; Order-entry systems in docs' offices reduce injuries. Modern Health Care, Feb 17, 2003. 14 [PubMed]
- 6.Frabotta. Patient-safety debate revolves around computer-driven standards: computerized order entry has potential to catch medication errors, the most common type. Managed Healthcare Executive, Aug 2002.
- 7.Chan Increasing The Success Of Physician Order Entry Through Human Factors. Journal Of Healthcare Information Management Winter. 2002:71–8. [PubMed] [Google Scholar]


