Abstract
This paper reports the methods and evaluation of a computer-based system that recommends microarray experimental design for biologists — causal discovery in Gene Expression data using Expected Value of Experimentation (GEEVE). The GEEVE system uses causal Bayesian networks and generates a decision tree for recommendations.
To evaluate the GEEVE system, we first built an expression simulation model based on a gene regulation model assessed by an expert biologist. Using the simulation model, we conducted a controlled study that involved 10 biologists, some of whom used GEEVE and some of whom did not. The results show that biologists who used GEEVE reached correct causal assessments about gene regulation more often than did those biologists who did not use GEEVE.
INTRODUCTION
Systems biology emphasizes large scale discovery of the interactions of genes, proteins, and other cell elements. Systems biology is confronted with a huge number of interactions, not the least of which is the interaction of genes. There are challenges in designing high throughput experiments, such as cDNA microarrays, and for analyzing the high volume of data generated by those experiments in order to discover gene regulation networks. Intrinsically, these regulation networks are causal in nature.
Microarray technology has opened a new era in the study of gene regulation. It allows a relatively quick and easy way to assess the mRNA expression levels of many different genes. Large time-series datasets generated by microarray experiments can be informative about gene regulation. Microarray data have been analyzed using classification or clustering methods1 and gene pathway (network) methods2–4. de Jong5 and Smolen, et al.6 give good reviews of genetic networks.
Kitano7 views systems biology as an endless information exchange between dry experiments (simulation studies and/or data analyses) and wet experiments (actual wet lab experiments). Since high throughput data are relatively expensive to achieve, the role of dry experiments is important in systems biology. Since Fisher8 noted that the statistical analysis procedure and experiment design are merely two different aspects of the same whole, much research has concentrated on experiment design itself9. Recent notable publications of systems that recommend experiment design includes active learning of Bayesian networks10 and perturbation recommendation in systems biology studies using Boolean networks11.
In this paper, we use our previously published causal structure search method12 and introduce a computer system — causal discovery in Gene Expression data using Expected Value of Experimentation (GEEVE) — that recommends which gene-regulation experiments to perform next. Unlike the recently published systems that recommend experiment design10,11, GEEVE (1) uses a local search method12; (2) assumes no ordering among variables; (3) can model the possibility of a hidden common cause; (4) can model an experimenter’s prior knowledge of causal relationships; (5) incorporates a cost model; and (6) can recommend more than one experiment at a time.
To evaluate GEEVE we used a simulation model generated by an expert biologist and conducted a controlled study that involved 10 biologists, some of whom used GEEVE and some of whom did not.
METHODS
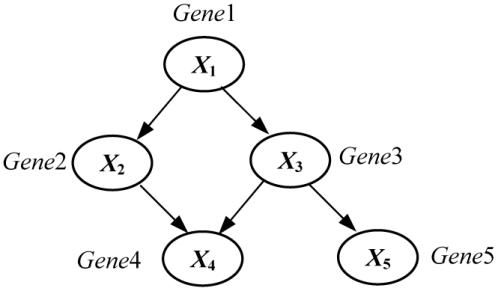
A Bayesian network is a directed acyclic graph in which each node represents a variable and each arc represents probabilistic influence. A causal Bayesian network (or causal network for short) is a Bayesian network in which each arc is interpreted as a direct causal influence between a parent node (variable) and a child node, relative to the other nodes in the network13. Figure 1 illustrates the structure of a hypothetical causal Bayesian network structure that contains five nodes. The probabilities associated with this causal network structure are not shown.
Figure 1.

A causal Bayesian network that represents a hypothetical gene-regulation pathway.
The causal network structure in Figure 1 indicates, for example, that the Gene1 can regulate (causally influence) the expression level of the Gene3, which in turn can regulate the expression level of Gene5.
The causal Markov condition gives the conditional independence relationships that are specified by a causal Bayesian network:
A node is independent of its non-descendants (i.e., non-effects) given its parents (i.e., its direct causes).
The causal Markov condition permits the joint distribution of the n variables in a causal Bayesian network to be factored as follows13:
 |
where xi denotes a state of variable Xi, πi denotes a joint state of the parents of Xi, and K denotes background knowledge.
We introduce 6 equivalence classes (E1 through E6) among the structures (Figure 2). The causal networks in an equivalence class are statistically indistinguishable for any observational and experimental data on X and Y. We denote an arbitrary pair of nodes in a given Bayesian network B as (X, Y). If there is at least one directed causal path from X to Y or from Y to X, we say that X and Y are causally related in B. If X and Y share a common ancestor, we say that X and Y are confounded in B. We understand that modeling all nodes may better represent the relationship among all the genes, but considering computational tractability, in this paper we concentrate on pairwise relationships between two nodes (X and Y) and a latent variable H.
Figure 2.
Six Local Causal Hypotheses
Let E={E1, E2, E3, E4, E5, E6} and let EiXY denote the node pair X and Y with causal relationship Ei. Let us consider the posterior probability that variable X causally influences variable Y given microarray gene expression data D. We can derive the posterior probability of EiXY as:
 |
where the sum is taken over all causal network structures that (1) contain just the nodes in a structure S, and (2) contain a structure EiXY. With appropriate assumptions, we can evaluate P(S|D,K) in Equation 2 in closed form14.
The GEEVE system.
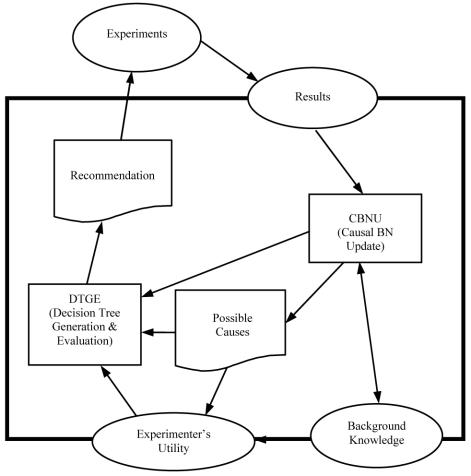
The GEEVE system consists of two modules called the causal Bayesian network update (CBNU) module and the decision tree generation and evaluation (DTGE) module (Figure 3). The CBNU module uses a heuristic scoring method called Local Implicit latent variable scoring Method (LIM)12 to causally analyze the current microarray data in light of the user’s prior beliefs about causal relationships among the genes under study. The DTGE module evaluates a decision tree that was generated based on the results of the CBNU module and the experimenter’s preferences, which are expressed with GEEVE as a utility function. DTGE also incorporates the cost to analyze a microarray chip. Finally (under assumptions) the best possible experiments are recommended to the experimenter. The experimenter then chooses the next experiment to perform, which may or may not be the one suggested by GEEVE. When the results are available, they can be submitted to the CBNU module for a new round of analysis.
Figure 3.
The GEEVE system. The box with the thick line represents the GEEVE system. Boxes in GEEVE represent system modules. Boxes with wavy lines represent outputs from GEEVE. The Experiments oval is an object that is outside of GEEVE. The ovals on the GEEVE border represent objects that communicate with GEEVE from the outside.
Let the expression U({P(Ei | ξj, D′, D, K), {P(Ei | D, K)}), represents the utility of obtaining an update on the probability of each of E1, E2, …, and E6 after performing an experiment ξj that has new results D′ in the context of prior results D and background knowledge K.. GEEVE provides a method that allows biologists to assess their utility15, but due to limited space, we do not explain it in detail. However, we can calculate the expected utility (EU) of ξj as:
 |
where here D′ denotes each possible result of the experiment ξ j. The optimal experiment is then:
 |
Although DTGE limits possible experiments (see the Study Design section), the large number of the experiments and their number of possible outcomes of the experiment make an exact evaluation of the decision tree intractable. Heuristic methods are used to generate D′ and calculate ξ optimal15.
High Throughput Data Simulator.
We used the Scheines and Ramsey16 simulator system (SR Simulator) to generate gene expression data. The SR simulator models genes within multiple cells and incorporates biological variance, such as that due to signal loss or gene mutation, as well as measurement error.
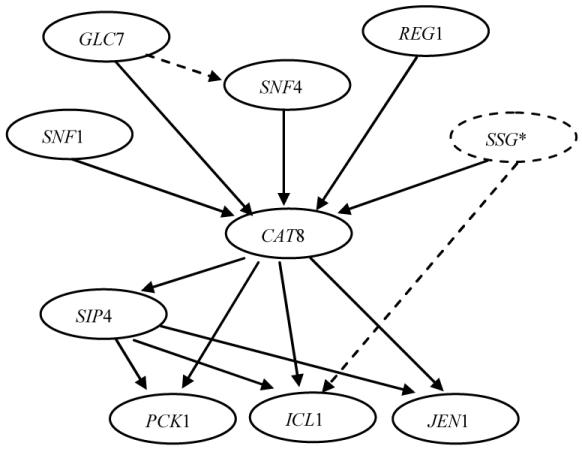
We created a simulator model (Figure 4) using the SR simulator that models a gene regulation pathway based on assessments from a molecular biologist at our university who has many years of research experience related to gene regulation pathways in yeast SNF1 protein kinease17. Regulation relationships (e.g, CAT8 promotes SIP4) and other parameters of the SR simulator were assessed from the biologist. We estimated the measurement error from published yeast microarray data18. GEEVE currently models gene expression levels using discrete variables only, although it could be extended to model with continuous variables as well. Thus, we discretized each gene’s expression level into three states (i.e., low, no change, and high) based on each gene’s expression level12.
Figure 4.

SNF1 simulation pathway model. Dotted lines represent the causal relationships that are biologically plausible, but need further investigation. SSG* represents a group of genes, i.e., SIP1, SIP2, and GAL83. SSG was modeled in the simulator but was hidden to the participants in the control study; i.e., the expression level of SSG was not provided to the participants
Study Design.
Ten biology faculty members, post-docs, and graduate students were recruited for this study and offered $50 per hour of participation. The biologists expressed at least some knowledge of the SNF1 protein kinease pathway. We stratified these study participants into two groups: (1) a control group that did not use GEEVE, and (2) an intervention group that used GEEVE. All participants were able to obtain the gene expressions levels for the nine genes (SSG was hidden from the participants) in Figure 4 under the following experimental conditions1):
- a wild-type experiment (i.e., no genes were knocked out);
- a knock-out experiment for which a single gene (selected from among the nine genes in
- Figure 4) was deleted.
The participants were asked to finish five phases in this study. Each phase consists of the following steps:
(1) the participant assesses his current beliefs about pairwise causal relationships among a predefined set of genes; (2) the participant requests up to 10 additional microarray experiments; (3) the simulator generates experimental results for the requested experiments; and (4) the participant views the results with or without GEEVE’s analysis and further recommendations for experiments to perform.
Evaluation Metrics.
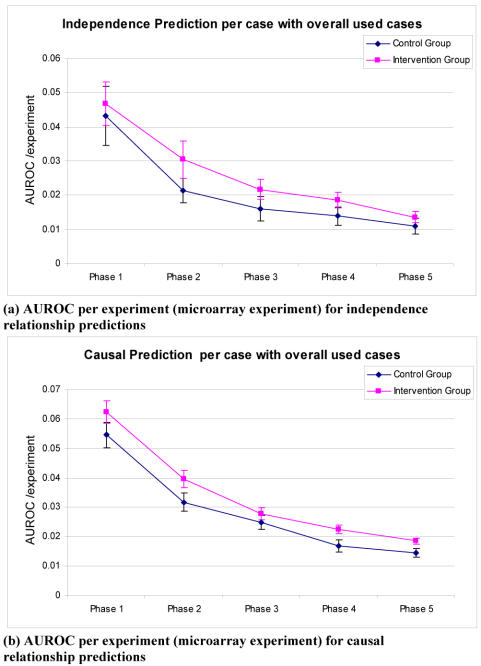
Out of the 36 possible gene pairs (Figure 4), ten gene pairs were preselected based on the preferences of an external expert biologists preference15. All participants were asked to take the given preferences as if they were their own. We calculated the area under ROC curve (AUROC) for all participants in each phase to characterize their discovery performance. Note that to calculate AUROC in Figure 5, we used non-confounded structures (i.e., relationships between X and Y in Figure 2 are grouped as (1) causally independent for E3 or E6; and (2) causally related for E1 or E4 (also E2 or E5). This is because SR simulator allows us to model microarray’s averaging effect of the mRNA level from millions cells and it is the averaging effect that makes the latent confounded structure discovery difficult if not impossible15,19. To calculate the AUROC, we measure how well each participant predicts the correct relationships among the ten genes in each phase. Thus (1) if E3 or E6 (independence of X and Y) is the true state (according to the generating model) for a given gene pair, then E1, E2, E4, and E5 are the false states; (2) if E1 or E4 (Y → X) is the true state then E2, E5, E3, and E6 are the false states; or (3) if E2 or E5 (X → Y) is the true state then E1, E3, E4, and E6 are the false states.
Figure 5.
Area under ROC (AUROC) per experiment for the control and intervention groups. Each bar represents a 95% confidence interval.
RESULTS
Table 1 shows more information about the participants in the control and intervention groups. The ten participants were selected based on their knowledge of the SNF1 pathway and cDNA microarray technology. Table 1 shows that participants were equally distributed based on their positions, knowledge of the SNF1 pathway, knowledge of cDNA microarray technology, and their expertise in computers. This is because we stratified the participants into the intervention and control groups in order to balance the dimensions in Table 1, especially focusing on participant’s knowledge in SNF1 pathway. There were three participants (group A) who rated themselves to be more knowledgeable of SNF1 pathway than the other seven participants (group B). Not to give an advantage to the intervention group, we assigned two participants (from group A) and three participants (from group B) to the control group.
Table 1.
Information about the Participants in the Intervention and Control Groups
| Professor | Post doc | Ph.D. student | Others* | Total | |
|---|---|---|---|---|---|
| Control Group | 1 | 0 | 3 | 1 | 5 |
| Intervention Group | 1 | 1 | 3 | 0 | 5 |
| (a) Positions. *Others is a technician with a Master’s degree in a field other than biology | |||||
| Understand Well | Understand Somewhat | Know only the genes | Totally Ignorant | Total | |
|---|---|---|---|---|---|
| Control Group | 0 | 2 | 3 | 0 | 5 |
| Intervention Group | 0 | 1 | 4 | 0 | 5 |
| (b) Knowledge in SNF1 pathway. | |||||
| Understand Well | Understand Somewhat | Totally Ignorant | Total | ||
|---|---|---|---|---|---|
| Control Group | 0 | 5 | 0 | 5 | |
| Intervention Group | 1 | 4 | 0 | 5 | |
| (c) Knowledge in cDNA microarray technology | |||||
| Average | Std. dev. | p value | |||
|---|---|---|---|---|---|
| Control Group | 0.56 | 0.13 | 0.34 | ||
| Intervention Group | 0.60 | 0.16 | |||
| (d) Subjective self-evaluation of computer expertise using the following values: 0=Novice, 0.5=Intermediate, 1.0=Expert. | |||||
Figure 5 plots the comparison of the two groups in each phase considering the number of microarray experiments that the participants in the two groups performed (via the SR Simulator). In particular, it displays the AUROC per microarray experiment (this unit represents the increased fraction of an AUROC that an experimenter would gain per microarray experiment) for each phase for the intervention and the control groups. The intervention group performed statistically significantly better than the control group (p ≤ 0.05) in Phase 2, Phase 4 and Phase 5 in making causal predictions [Figure 5(b)].
SUMMARY
We developed a system called GEEVE that incorporates an experimenter’s preferences regarding which genes to study in order to discover causal relationships among those genes. For genes of interest, GEEVE generates a model of their likely causal relationships, which is based on prior biological knowledge and experimental data.
We showed that most of the time the intervention group (that used GEEVE) performed better — although not always statistically significantly so — than the control group in predicting whether pairs of genes (of interest to the biologist study participant) act independently or have a causal relationship.
Future work includes modeling more general experiments, such as over-expression experiments, as well as multiple gene knock-outs that will allow GEEVE to incorporate more than pairwise relationships into the decision tree. It also will be important to perform more extensive testing of GEEVE using simulated and real microarray data.
Acknowledgments
We thank Dr. Martin Schmidt for his help in constructing the SNF1 simulator model. This research was supported by NSF grant IIS-9812021 and NASA grant NRA2-37143.
Footnotes
There could be other experimental conditions, such as over-expressing a gene, knocking out more than two genes at a time, or setting different environmental conditions, but this initial study is restricted to the experimental conditions listed.
REFERENCES
- 1.Spellman PT, Sherlock G, Zhang MQ, et al. Comprehensive Identification of Cell Cycle-regulated Genes of the Yeast Saccharomyces cerevisiae by Microarray Hybridization. Molecular Biology of the Cell. 1998;9:3273–3297. doi: 10.1091/mbc.9.12.3273. [DOI] [PMC free article] [PubMed] [Google Scholar]
- 2.D'haeseleer P, Liang S, Somogyi R. Genetic network inference: from co-expression clustering to reverse engineering. Bioinformatics. 2000;16:707–726. doi: 10.1093/bioinformatics/16.8.707. [DOI] [PubMed] [Google Scholar]
- 3.Friedman N, Linial M, Nachman I, Pe'er D. Using Bayesian networks to analyze expression data. Journal of Computational Biology 2000. [DOI] [PubMed]
- 4.Yoo C, Thorsson V, Cooper GF. Discovery of a gene-regulation pathway from a mixture of experimental and observational DNA microarray data, PSB, Maui, Hawaii, 2002. World Scientific. [DOI] [PubMed]
- 5.de Jong H. Modeling and simulation of genetic regulatory systems: a literature review. Journal of computational biology. 2002;9:67–103. doi: 10.1089/10665270252833208. [DOI] [PubMed] [Google Scholar]
- 6.Smolen P, Baxter DA, Byrne JH. Modeling transciptional control in gene networks - methods, recent results and future directions. Bulletin of Mathematical Biology. 2000;62:247–292. doi: 10.1006/bulm.1999.0155. [DOI] [PubMed] [Google Scholar]
- 7.Kitano H. Systems Biology: A Brief Overview, , March 1, 2002. Science. 2002;295:1662–1664. doi: 10.1126/science.1069492. [DOI] [PubMed] [Google Scholar]
- 8.Fisher RA. The design of experiments. New York: Hafner Publishing Company, 1971.
- 9.Chaloner K, Verdinelli I. Bayesian experimental design: A review. Statistical Science. 1995:273–304. [Google Scholar]
- 10.Tong S, Koller D. Active learning for structure in Bayesian networks, International Joint Conference on Artificial Intelligence, Seattle WA, 2001.
- 11.Ideker T, Thorsson V, Karp RM. Discovery of regulatory interactions through perturbation: inference and experimental design, Pacific Symposium Biocompution, 2000. [DOI] [PubMed]
- 12.Yoo C, Cooper G. Discovery of gene-regulation pathways using local causal search, AMIA, San Antonio, Texas, 2002. [PMC free article] [PubMed]
- 13.Pearl J. Probabilistic Reasoning in Intelligent Systems. In: Representation and Reasoning. San Mateo, CA: Morgan Kaufmann, 1988.
- 14.Cooper GF, Herskovits E. A Bayesian method for the induction of probabilistic networks from data. Machine Learning. 1992;9:309–347. [Google Scholar]
- 15.Yoo C. Expected Value of Experimentation in Causal Discovery from Gene Expression Studies. Ph.D. dissertation 2002.
- 16.Scheines R, Ramsey J. Gene simulator. Available at: http://www.phil.cmu.edu/tetrad/, 2001.
- 17.Schmidt M, McCartney R. beta-subunits of Snf1 kinase are required for kinase function and substrate definition. Embo Journal. 2000:4936–43. doi: 10.1093/emboj/19.18.4936. [DOI] [PMC free article] [PubMed] [Google Scholar]
- 18.Gasch A, Spellman P, Kao C, et al. Genomic expression programs in the response of yeast cells to environmental changes. Mol Biol Cell. 2000;11:4241–57. doi: 10.1091/mbc.11.12.4241. [DOI] [PMC free article] [PubMed] [Google Scholar]
- 19.Spirtes P, Glymour C, Scheines R. Constructing Bayesian network models of gene expression networks from microarray data, to appear in the Proceedings of the Atlantic Symposium on Computational Biology, Genome Information Systems and Technology, 2001.


