Abstract
Flow cytometric systems are useful for protein identification and expression analysis, especially characterizing particular lineage or sublineage of cells. We clustered flow cytometry data of bone marrow cells into subpopulations using a clustering algorithm with its physical characteristics (cell size and cell granularity) and different molecular composition (cell reactivity with monoclonal antibodies). To display the cell subpopulations, we created a colored map according to the mean of 5 flow cytometry parameters based on a cluster. Such a map can reveal subpopulation properties that are not evident in the widely used scatter plot.
Flow cytometry is the automatic and quantitative measurement of physical parameters of molecules using fluorescence induced by attached fluorescent dyes. It has been used increasingly in various branches of biomedical research and clinical practice. Major applications of flow cytometry include DNA histogram analysis for ploidy determination and immunophenotyping. Patterns of molecules expressed selectively by a particular cell type can serve as a marker for that cell type, thus enabling us to assign a cell to a lineage or sublineage of cells . In this study, we clustered cells using its physical characteristics (forward scatter (FSC, cell size) and side scatter (SSC, cell granularity)) and different molecular composition (cell reactivity with monoclonal antibodies) to recognize subpopulations in a sample. We also created a colored representation of the clusters and their characteristics.
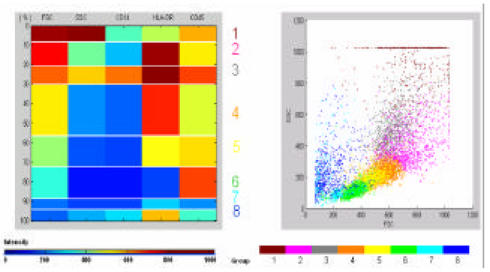
In leukemia testing, flow cytometry analyses are performed with an individual’s bone marrow aspirate cells . In our lab, 5 parameters are measured for each tube of samples: 2 light scatter parameters (FSC, SSC), and 3 fluorescence parameters (e.g. CD14 FITC, anti-HLA -DR PE, and CD45 PerCP). Total number of cells analyzed is around 10,000 for each tube. The fluorescence and the light scatter intensity are recorded in log-scale, 0 to 1023. The data are stored as FCS 2.0 listmode files. We used the Matlab software (version 6, The MathWorks, Inc., Natick, MA) for data extraction from listmode files, clustering analysis, and subpopulation representation. For clustering, we used competitive learning algorithm and neural network analysis for training. The trained network assigned the flow cytometry data into clusters, which we considered to be subpopulations of cells . We predetermined subpopulation number to be 8, empirically. We calculated the means for each of the 5 parameters of a subpopulation, and represented them in a colored map (Figure 1). The order of cluster group was first sorted in descending order of light scatter parameters, FSC and SSC, then sorted by the fluorescence parameters (e.g. CD14, HLA -DR, and CD45). Thus, the cluster with strongest expression of FSC was represented on the top. The size of cluster was presented as the width of cluster. We also plotted the subpopulation with different colors on a 2D scatter plot (Figure 1).
Figure 1.
Colored map with 5 parameters and scatter dot plot with 2 parameters, showing different clusters of flow cytometry data.
When shown to cytometrists, the identification and visual representation of subpopulations was found to be helpful for interpreting flow cytometry data comparing with the typical quatrain analysis of scatter dot plots. As Fu (1) pointed out that the competitive learning algorithm was relatively fast in clustering subpopulations. In our experiment, we also found that it did have the limitation of needing to predefine the number of clusters.
References
- 1.Fu L, Yang M, Braylan R, Benson N. Real-time adaptive clustering of flow cytometric data. Pattern recognition. 1993;26:365–73. [Google Scholar]


