

Abstract
The interplay of mechanical forces between the extracellular environment and the cytoskeleton drives development, repair, and senescence in many tissues. Quantitative definition of these forces is a vital step in understanding cellular mechanosensing. Microfabricated post array detectors (mPADs) provide direct measurements of cell-generated forces during cell adhesion to extracellular matrix. A new approach to mPAD post labeling, volumetric imaging, and an analysis of post bending mechanics determined that cells apply shear forces and not point moments at the matrix interface. In addition, these forces could be accurately resolved from post deflections by using images of post tops and bases. Image analysis tools were then developed to increase the precision and throughput of post centroid location. These studies resulted in an improved method of force measurement with broad applicability and concise execution using a fully automated force analysis system. The new method measures cell-generated forces with less than 5%error and less than 90 seconds of computational time. Using this approach, we demonstrated direct and distinct relationships between cellular traction force and spread cell surface area for fibroblasts, endothelial cells, epithelial cells and smooth muscle cells.
Keywords: cell adhesion; stress, mechanical; mechanosensors; cytoskeleton; focal adhesions; actomyosin; shear force; image analysis; PDMS; microfabricated post array detectors
1 Introduction
Cellular events are driven not only by molecular and biochemical cues, but also by their mechanical environment. Forces from the external environment regulate key physiologic events, such as the permeability of vascular endothelium (Bogatcheva, Garcia and Verin 2002) and the synthesis of extracellular matrix components (Wolf, Raiss and Steinmeyer 2003). While mechanical stresses can be transmitted to cells through numerous anatomical structures, adhesions formed between cells and their surrounding extracellular matrix are perhaps the most important (Jockusch, Bubeck, Giehl, Kroemker, Moschner, Rothkegel, Rudiger, Schluter, Stanke and Winkler 1995; Burridge and Chrzanowska-Wodnicka 1996; Yamada and Geiger 1997; Small, Rottner, Kaverina and Anderson 1998). These adhesions experience stresses that can result either from external loads applied to the extracellular matrix, or from traction forces - internal forces generated through actin-myosin contraction applied against the anchoring adhesions (Harris 1984; Galbraith and Sheetz 1997; Dembo and Wang 1999; Riveline, Zamir, Balaban, Schwarz, Ishizaki, Narumiya, Kam, Geiger and Bershadsky 2001). Interestingly, these traction forces appear to be important for the ability of soluble and adhesive factors to guide cell function (Huang, Chen and Ingber 1998; Chen, Tan and Tien 2004). As a result, numerous approaches have been taken to characterize these traction forces in single cells.
Cells transmit forces in the nanonewton (nN) range to the ECM (Dembo and Wang 1999; Balaban, Schwarz, Riveline, Goichberg, Tzur, Sabanay, Mahalu, Safran, Bershadsky, Addadi and Geiger 2001). These forces are transmitted to the ECM via focal adhesions with local stresses on the order of 5 nN m2 (Balaban, Schwarz, Riveline, Goichberg, Tzur, Sabanay, Mahalu, Safran, Bershadsky, Addadi and Geiger 2001). A number of methods have been developed to measure these forces.
The first of these methods involves plating cells onto a thin layer of polydimethylsiloxane (PDMS) (Harris 1984). Cells deform the substrate by applying traction forces and produce a wrinkled pattern on the substrate. This method yields a qualitative assessment of cell-generated traction forces, but even recent adaptations of the technique (Burton, Park and Taylor 1999) do not provide readily derived quantitative data. A more accessible quantitative method involves embedding particles into a polyacrylamide gel substrate (Lee, Leonard, Oliver, Ishihara and Jacobson 1994; Dembo and Wang 1999; Beningo, Dembo, Kaverina, Small and Wang 2001; Munevar, Wang and Dembo 2001; Wang, Dembo, Hanks and Wang 2001; Wang, Tolic-Norrelykke, Chen, Mijailovich, Butler, Fredberg and Stamenovic 2002). In this approach cells cultured on the flat substrates generate traction forces that deform the gel, which can be detected by movement of the embedded beads. One shortcoming of this method is that the gel surface must contain relatively uniform fluorescent bead densities, and this density ultimately determines the spatial resolution of the technique in estimating the traction force field. This has been addressed by lithographically arraying markers in a Cartesian grid on the surface of an elastomeric silicone substrate (Balaban, Schwarz, Riveline, Goichberg, Tzur, Sabanay, Mahalu, Safran, Bershadsky, Addadi and Geiger 2001).
Alternate methods of measuring traction forces using microfabricated cantilevers have also been developed (Galbraith and Sheetz 1997). In these approaches, cells attach to the tips of cantilevers that bend in response to traction forces. The first generation of these systems involved cells crawling over a single horizontal cantilever on a microchip. While this approach provides a direct measure of force applied at a local subcellular region, one could only observe forces applied in one region at a time. Recently, we described an approach to present large, high density arrays of vertically oriented elastomeric posts (Tan, Tien, Pirone, Gray, Bhadriraju and Chen 2003). Cells would attach and spread across the tips of the posts on these microfabricated post array detectors (mPADs). Since each mPAD post is discrete, analysis requires only a spring constant and a measured deflection from acquired images. These discrete methods differ from the earlier continuous, flat substrate-based methods in several important ways: A principal advantage is that the use of cantilevers does not require the complex mathematical methods used in the continuous system in order to report forces. One potential weakness of the mPAD approach is that it remains unclear whether cell adhesion, spreading, motility and mechanics might be fundamentally different on the mPADs versus on flat surfaces, such that one cannot apply insights from one experimental system to the other.
However, in the few cases where traction forces have been studied on both continuous and discontinuous surfaces, the data appear to be in agreement. For example, in both cantilever and hydrogel systems, the migration of fibroblasts was shown to be driven by traction stresses applied near the leading edge of cell, which in turn appeared to pull the apparently more passive rear of the cell forward (Galbraith and Sheetz 1997; Dembo and Wang 1999). Both approaches have also demonstrated that traction stresses play an important role in the maturation of focal adhesions (Balaban, Schwarz, Riveline, Goichberg, Tzur, Sabanay, Mahalu, Safran, Bershadsky, Addadi and Geiger 2001; Tan, Tien, Pirone, Gray, Bhadriraju and Chen 2003), and the stresses measured in all systems appear to be in the same range (Dembo and Wang 1999; Balaban, Schwarz, Riveline, Goichberg, Tzur, Sabanay, Mahalu, Safran, Bershadsky, Addadi and Geiger 2001; Tan, Tien, Pirone, Gray, Bhadriraju and Chen 2003). Interestingly, adhesion is not only regulated by traction forces but also can modulate the magnitude of these forces. Increasing smooth muscle cell adhesion and spreading against extracellular matrix increases the degree to which cells contract against continuous or cantilever-based substrates (Wang, Ostuni, Whitesides and Ingber 2002; Chen, Alonso, Ostuni, Whitesides and Ingber 2003). The concordance between these widely disparate techniques indicates that the cantilever-based systems such as the mPADs warrant further development.
The original method for determining post deflections on the mPADs involved comparing a single image of the tops of the posts with a regularly-spaced grid of coordinates representing the ideal undeflected positions of the posts. Here, we examined whether imaging the entire posts, from top to base, could provide additional information in measuring cellular traction forces. The entire surface of the mPAD post is imaged by coating the surface with fluorophore-conjugated bovine serum albumin (BSA). Using this approach to obtain the strains of the entire length of the posts, we demonstrate that one can distinguish whether cells apply point moments or shear forces to the posts. We also demonstrate that imaging of the entire lengths of the posts provides a more precise and accurate measure of post deflections. To automate the analysis based on this new approach, a fully automated Matlab-based code (available for download from www.hopkinsmedicine.org/anesthesiolog/research/mpadtools) is presented which allows for complete analysis of the traction forces applied to the mPADs, using an algorithm which determines the centroid of each post automatically for both the top and base mPAD post images. This improved method allows us to measure the traction forces generated by a single cell with minimal error and an average analysis time of ninety seconds. This package is demonstrated to compare the traction forces generated by numerous different cell types, including mouse embryo fibroblasts (MEFs), human umbilical vein endothelial cells (HUVECs), human mammary epithelial cells (MCF10As), and bovine aortic smooth muscle cells (SMCs). We find that the different cell types generate traction forces to varying degrees, and that cell spreading area affects total force in each. In summary, these findings suggest that volumetric imaging of mPADs adds significant benefit to the analysis of cellular traction forces.
2 Materials and Methods
2.1 mPAD Fabrication and Preparation
mPADs consist of uniformly spaced grids of deformable silicon posts. Fabrication of mPAD substrates was described previously (Tan, Tien, Pirone, Gray, Bhadriraju and Chen 2003). Briefly, an mPAD template was made by pouring PDMS over an array of posts lithographically generated on a 75 mm silicon wafer (Silicon Sense Inc., Nashua, NH) from an epoxy-type, near-UV photoresist (SU-8 2; Microchem Corp, Newton, MA). After developing the SU-8, the posts features are 3 microns in diameter, 11 microns tall, and spaced 9 microns apart. The mPAD template was cured overnight at 110 ° C, peeled from the SU-8 post array, oxidized for 1 min in a plasma etcher (SPI Plasma-Prep II, Structure Probes Inc, West Chester, PA), and treated with (tridecafluoro-1,1,2,2-tetrahydrooctyl)-1-trichlorosilane (United Chemical Technologies Inc., Bristol, PA) vapor overnight under vacuum to aid removal of mPADs from the template. mPADs were then made by pouring PDMS onto the template, degassing under vacuum, and curing overnight at 110 ° C. Surface-oxidized mPADs were then microcontact printed with fibronectin from a PDMS stamp pre-coated with 50 ug/ml fibronectin to promote cell adhesion to mPAD post top surfaces (Tan, Liu, Nelson, Raghavan and Chen 2004). For the T-I method (described below), mPADs were coated with 0.2% Pluronics F-127 (BASF, Ludwigshafen, Germany) to prevent cell adhesion to post surfaces other than the top surface. In the T-B method (described below), mPADs were coated first with 0.2% BSA-488 (Molecular Probes, Eugene, OR) to visualize posts, followed by 0.2% Pluronics F-127 to restrict cell adhesion to the post tops .
2.2 Cell Culture
Mouse embryo fibroblasts (MEFs; ATCC, Rockville, MD) were cultivated in DMEM with 10% fetal bovine serum. Human Umbilical Vein Endothelial Cells (HUVECs; VEC Technologies, Rochester, NY) were cultivated in standard medium from the same source. MCF10a cells (ATCC) were cultivated in DMEM with 5% horse serum as described in previous literature (Liberto, Cobrinik and Minden 2002). Bovine aortic smooth muscle cells (SMCs; gift from Donald Ingber, Harvard) were cultivated in DMEM with 10% calf serum. Bovine adrenal microvascular endothelial cells (BAMECs; VEC technologies) were cultured in low glucose DMEM (Gibco, Carlsbad, CA) with 10% FBS, 10ng/ml EGF (Invitrogen, Carlsbad, CA), 3ng/ml bFGF (Invitrogen), and 1% Glutamine/ Penicillin/ Streptomycin. Four hours prior to trypsinization, the cells were cultured in low glucose DMEM with 10% calf serum.
For most experiments, cells were plated onto fibronectin-printed mPAD arrays and cultured in standard serum-containing media. In some cases, cells were plated onto glass coverslips (thickness #0, Fisher, Vernon Hills, IL) that were either uncoated or incubated with fibronectin (50 μg/ml) at 37°C for one hour. Cells plated on coverslips were cultured with medium containing 10% calf serum.
2.3 Fluorescence labeling and image acquisition
Cells cultured on mPADs were fixed and permeabilized with 3% paraformaldehyde and 0.5% Triton X-100 in PBS, rinsed with PBS, incubated with polyclonal antisera against fibronectin (Abcam, Cambridge, MA) and/or monoclonal antibody against vinculin (gift of Alexey Belkin, Holland Labs), and then with fluorophoreconjugated isotype-specific and affinity cross-adsorbed anti-IgG antibodies (Chemicon, Temecula, CA). Filamentous actin was visualized by incubating samples with fluorophore-conjugated phalloidin (Molecular Probes). Images were acquired using either laser confocal microscopy (Ultraview, Perkin Elmer) or epifluorescence microscopy (Eclipse, Nikon) with a 60X objective. Confocal images were collected using ImagingSuite software (Perkin Elmer) and an LSI cooled 12-bit CCD camera (Perkin Elmer). Epifluorescence images were collected using Openlab software (Improvision, Lexington, MA) and an internally cooled 12-bit CCD camera (CoolSnapHQ, Photometrics, Tucson, AZ). 3D images of mPADs were generated by collecting images at 0.1 micron increments in the direction perpendicular to the mPAD surface. Image stacks were deconvolved and 3D volume images were generated using Volocity (Improvision, Lexington, MA).
2.4 Live cell imaging
BAMEC were plated on mPADs that were microcontact printed with fibronectin and imaged using a Nikon Eclipse TE2000-E microscope. Temperature and CO2 were maintained at 37 ° C and 10%, respectively, using a LIVECELL chamber (Neue Biosciences; Camp Hill, PA). Phase images were collected using IPLAB (Scanalytics, Inc.; Fairfax, VA) at a rate of 1 frame/minute for up to 4 hours.
2.5 Image analysis
Acquired images were exported as 16-bit TIFF images and read into an original Matlab code written by the authors and designed to analyze mPAD post deflections (described in detail in Results). Briefly, acquired images were imported, and a thresholding algorithm was used to determine cell area, detect cell edges, and define mPAD post centroids. We then calculated deflections (based on methods reported in Results) and generated vector plots of the resulting cell-generated forces. All analysis was performed using our original code in Matlab 6.5.1 on a 2.4 GHz Pentium 4 PC with 2 GB RAM.
3 Results
3.1 Cell spreading, matrix adhesion and motility on microfabricated post array detectors
Cell spreading, focal adhesion distribution, and motility were examined on mPADs and conventional surfaces in order to determine the impact of the discontinuous array of the extracellular matrix substrate on cell behavior. Mouse embryo fibroblasts were seeded onto one of three different surfaces and allowed to spread to a steady state for 24 hours: mPADs that were microcontact printed with fibronectin on the post tops; glass coverslips coated with fibronectin; or uncoated glass coverslips. The cell spreading data (Figure 1A) indicate that the three groups were essentially equivalent in both the average surface area and the variability and range of cell size examined (SD). Focal adhesion distribution was strikingly similar on mPADs to the pattern seen on fibronectin-coated glass, with both peripheral and internal constituents in an approximately 2:1 ratio (Figure 1B-E). In cells plated on uncoated glass, however, the percentage of focal adhesions that did not contact the cell periphery was quite small – adhesions were formed in a radial array of linear plaques. Time lapse analysis of BAMEC motility on mPADs (Figure 1F) revealed the following salient features: the formation of a classical morphology with a spreading lamellum at the leading edge and a retractile conical trailing tail; a curvilinear trajectory with visible pivoting of the cell body, and a velocity of 6 μm per hour. These data indicate that mammalian cells adhere, spread, and move normally on mPADs.
Figure 1.
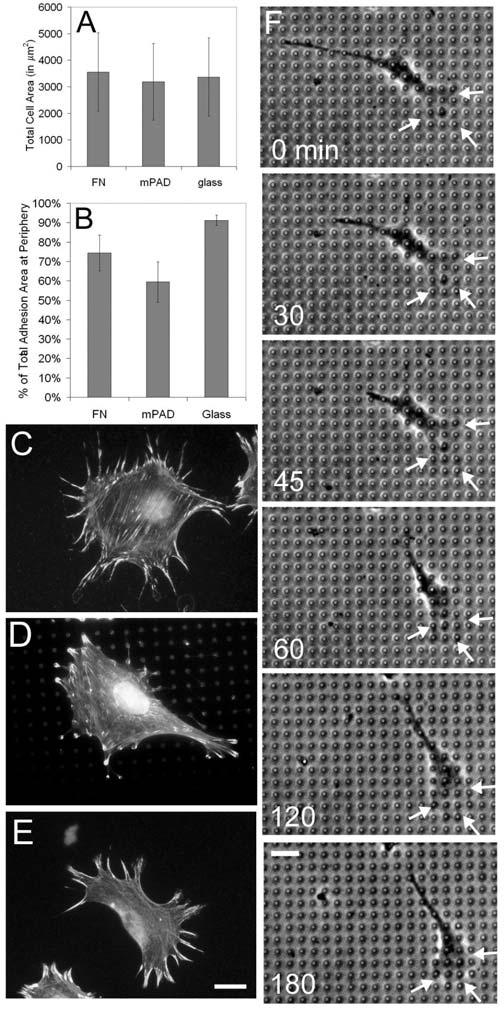
Cell spreading, focal adhesion distribution, and cell motility on the discontinuous mPAD surface. (A) Surface area data, and (B) Peripheral adhesion data, for MEF cultured on glass coverslips with adsorbed fibronectin, mPADs microcontact printed with fibronectin, and uncoated glass coverslips. (C-E) Composite Actin (dark) and Vinculin (bright) images from MEF cultured on glass coverslips with adsorbed fibronectin (C), mPADs microcontact printed with fibronectin (D), and uncoated glass coverslips (E). Scale bar for C,D,E = 20 μm. (F) A series of six time-lapse images of a BAMEC migrating on an mPAD. Scale bar for F = 20 μm.
3.2 Labeling mPAD posts to completely characterize post deflections
mPADs can be used to measure traction forces generated by cells. The top surfaces of the vertical posts are selectively coated with fibronectin such that cells plated on the mPAD surface attach to the tops of the uniformly spaced posts. Because the posts are flexible, they deflect as cells contract against the substrate (Fig. 2A). Using beam bending theory, these traction forces can be quantified by determining the deflections of each post. Deflections (δ) are converted to forces using the mechanical properties of the PDMS and the mPAD post geometry:
| (1) |
where E is Young's Modulus of PDMS, I is the moment of inertia of a circle, and L is the length of the mPAD post. Forces measured at cell-occupied posts are summed to determine the total cell-generated force magnitude:
| (2) |
as well as the force per post:
| (3) |
where Nop is the number of posts occupied by the cell.
Figure 2.

A new approach to post labeling. (A) A 3D-reconstruction of a cell plated onto an mPAD shows f-actin (dark gray, surface) and BSA-488 (light gray, posts). Each unit of the grid denotes 10 microns. (B) An immunofluorescence image of a cell plated on an mPAD shows f-actin (dark gray) and fibronectin (light gray) printed onto the top surface of mPAD posts. Note that immunofluorescence staining of fibronectin includes both microcontact-printed fibronectin and intracellular fibronectin. (C) In the T-I Method, unoccupied posts along the image edge (gray) are used to determine the linear edges (solid lines) of the ideal grid. Deflections of occupied posts (white) are calculated based on the differences between the actual centroids (center dot) and the theoretical undeflected centroids (intersections of dashed lines). (D) Schematic of new mPAD surface preparation.
The first method to determine post deflections involved labeling the top surface of posts and comparing post positions with a theoretical grid of undeflected positions (Fig. 2B). Thus, correctly estimating the theoretical position of the undeflected posts was critical to the accuracy of the method. In practice, the theoretical grid of undeflected centroids [C]I was placed in registration by mapping the grid onto the surrounding posts in the image that were not occupied by cells. The original undeflected position of all posts was estimated by using linear regression to identify a line that best fit the post positions for each of the 4 sides of the mPAD grid, and then finding the 4 intersections of those 4 lines. These 4 intersection points represented the corners of the ideal grid. We then used a two-dimensional linear interpolation and the known spacing of the posts to determine ideal centroids for posts in the interior of the grid ([C]I) (Fig. 2 C). For this method, referred to as the Top-Ideal Method (T-I), where centroids of the mPAD post top surfaces [C]T are determined from the fibronectin image, deflections [δ] were then calculated based on the difference between the top surface post centroids and ideal grid centroids:
| (4) |
The use of an ideal grid as the reference for the force measurements had several drawbacks. The linear interpolation used to determine the matrix of ideal centroids [C]I assumes uniform spacing between posts. Because the grid of real posts may have subtle variations in post-post spacing, a source of noise was introduced. In addition, any deviations from ideal in the unoccupied posts used to register the ideal grid to the real image biased [C]I, and thus introduced additional errors in the deflection matrix. This analysis method also required that images be acquired with at least one full row or column of unoccupied posts on each edge of the cell image to determine linear fit equations used in the calculation of [C]I.
In order to obviate the possible error sources in the original analysis technique that stem from using only the position of the post tops and an ideal grid, mPAD posts were coated with fluorophore such that the entire length of the post could be imaged (Fig. 2D). Fluorophore coating was done after microcontact printing, and addition of the fluorophore did not interfere with cell binding to the microcontact-printed fibronectin. Images could then be acquired along the length of the post by optical sectioning. Post deflections could then be calculated by using centroid positions at different points along a post's length.
3.3 Mechanical analysis of post deflections
In order to determine the optimal positions along the post length to image centroids for measurement of post deflections and cell traction forces, we optically sectioned fluorophore-coated mPAD posts and examined the mechanical aspects of mPAD post bending. Because cells generate different types of forces, such as shear, axial loading, torsion, and point moments, we measured post deflection as a function of post length and determined how it compared to predicted deflection patterns based on different force types. In addition, we quantified the range of forces that were measurable with the current mPAD system.
We first investigated whether cells generate different types of forces at the top surface of an mPAD post. We calculated the theoretical deflection pattern for the loading conditions that yield deformation perpendicular to the post: 1) shear force applied at the top surface; and 2) moment applied at the top surface (Fig.5B). Axial loading and torsion were not examined because these forces elongate or rotate the post but do not affect post bending. Theoretical deflections as a function of position along the post were calculated using the classical beam bending equation (Beer and Johnston 1981):
| (5) |
where M is the bending moment in the beam, E is the Young's Modulus, and I is the moment of inertia. Solving of this equation for the first case (a cantilever beam with an applied shear force at the free end) yields the following equation for deflection δp as a function of position along the post x:
| (6) |
where P is the applied force and L is the length of the post. Solving of Eq. 5 for the second case (a cantilever beam with a point moment at the top surface) yields the following equation for deflection δm as a function of position along the post x:
| (7) |
Figure 5.

Comparative analysis of approaches to identifying centroids of posts. An immunofluorescence image of the top surface of an mPAD (A) is analyzed using three different threshold algorithms: (B) the GT thresholding algorithm; (C) the LT1 algorithm; and (D) the LT2 algorithm. Lower arrows indicate an area of non-uniform illumination, which is not detected in the GT algorithm, but is detected in the LT1 and LT2 algorithms; upper arrows indicate an area of interfering fluorescence, which is not eliminated in the LT1 algorithm, but is eliminated in the GT and LT2 algorithms. Upper right boxes represent the size of the scanning-window used in the LT1 and LT2 algorithms. (E) Values of P (left y-axis), eccentricity (right y-axis), and change in centroid position (right y-axis) as functions of threshold, as calculated by the LT2 algorithm.
Using the characteristics of the mPAD, results from equations 5-7 indicated that there was a difference in bending patterns between the two cases (Fig. 3B). A maximal difference in deflection between the two cases was ∼200 nm and occurred at 70% of the post length.
Figure 3.
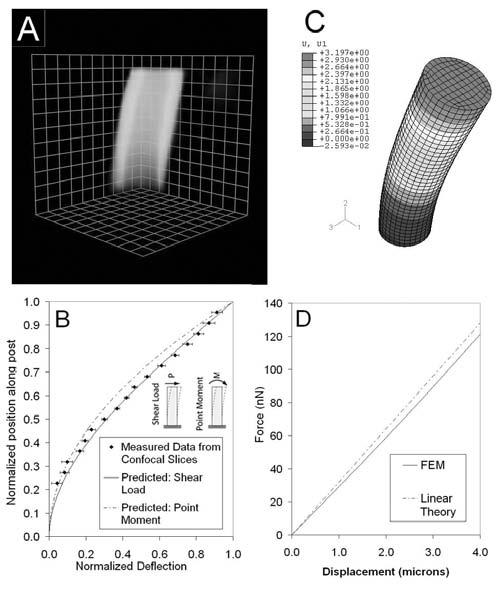
Mechanical analysis of post deflections. (A) A Volocity 3D-reconstruction of a deflected mPAD post. Measurements of centroids were calculated at 0.5 micron increments along the post length from the top surface to 1.5 microns above the base surface. Grid blocks are 1 micron × 1 micron. (B) Normalized deflection vs. normalized length along an mPAD post for 2 cases: post under shear load (solid), and post under top surface moment (dashed). Measured centroid positions from confocal slicing are shown as black diamonds. (C) An FEM model of a shear force applied to an mPAD post surface. (D) Applied force as a function of deflection for linear theory (dashed) and FEM analysis (solid).
We next determined the deflection pattern of mPAD posts by acquiring confocal image slices at 0.5 micron intervals along the post (Fig. 3A) and analyzing these images using the edge detection and centroid calculation methods discussed below (3.5). Centroid position along the length of the post was calculated for a set of deflected posts (n = 9); these data are plotted against the 2 predicted deflections discussed above (Fig. 3B). These results indicate that the mPAD post deflections can be measured with enough accuracy to differentiate between types of applied loads, and that the deflections closely follow the predicted bending pattern of a post under a shear load at the top surface.
In addition to examining the types of forces applied to the mPAD posts, we investigated the magnitudes of forces which can be measured using the current mPAD system. The current analysis of post deflections uses the solution of the classical beam bending equation for a cantilever beam under shear load at the top surface (Eq. 5). However, this equation is a linear approximation of the actual beam bending equation, and therefore does not hold true for larger deformations where the small angle deflection can no longer be assumed. In order to determine a range of deflections over which Eq. 5 holds, we compared the calculated mPAD post deflections to a force/deflection relationship derived from a finite element model (FEM) analysis (ABAQUS, Inc, Pawtucket, RI) (Fig. 3C). The post was discretized as a cylindrical cantilever with 3552 elements. The PDMS was modeled as a neohookian hyperelastic material with a modulus of elasticity of 3.75 MPa. The shear load was applied at the center node on the top surface and the other nodes on the top surface were restricted from relative displacement from the center node. The bottom surface was assigned fixed boundary conditions.
The results (Fig. 3D) indicate that the linear approximation underestimates the force for a given deflection as compared to the FEM data, but that the difference between the two methods is small and is less than 10% for deflections less than 4 microns. Therefore, equation 5 can be used as an accurate approximation of the applied force when deflections are small, as they are in the mPAD system (average post deflection is 0.5 microns). The results also indicate that the mPAD post does not need to be imaged along its entire length in order to calculate the force applied to the post. Since the actual deflection pattern of the post closely follows that predicted by Eq. 6, images are only necessary at the fixed end of the post (the base) and the free end of the post (the top) to calculate the total deflection and thus the applied force. (Figs 3B and 3D).
3.4 Comparative analysis of approaches to determine deflection of posts
Having verified that accurate determinations of post deflections could be made from a data set limited to images of post tops and bases, we developed a new analysis technique, referred to as the Top-Base Method (T-B). Images were acquired at both the top and the base of the mPAD posts by optical sectioning. The positions of the bases of the posts were used to represent the undeflected position of the post. The deflection of the posts [δ] were then calculated based on the difference between the centroid positions of the posts in the top image [C]T and base image [C]B:
| (8) |
A complete force vector map is shown in Fig. 4A and is merged with a composite image including f-actin (center), the mPAD top surface (light gray), and the mPAD base surface (dark gray). White arrows represent deflections of cell-occupied posts, whereas gray arrows represent deflections of unoccupied posts. All arrows in the image are scaled up by a factor of 10 to improve visibility.
Figure 4.

Comparison of accuracy of T-I method and T-B method. (A) The force map (arrows) result from the T-B method is shown superimposed with immunofluorescence images of f-actin, BSA-488 at the top surface of the mPAD (light gray), and BSA-488 at the base surface of the mPAD (dark gray). Deflections are calculated based on the difference in centroid position of each post ([C]T -[C]B) (arrows). White arrows represent deflections of cell-occupied posts, while gray arrows represent deflections of unoccupied posts. (B) Histogram of deflection magnitudes of unoccupied posts for T-I method (white) and T-B method (gray). Vertical lines represent 25 % of the average occupied post deflection (solid) and 50% of the average occupied post deflection (dashed). (C) Standard deviation from zero (σ) for deflections of unoccupied posts was calculated using the T-I method (35 images) and the T-B method (26 images).
The T-B method eliminated any error associated with variations in grid spacing and also eliminated the need to acquire images with at least one full row of unoccupied posts on each side. It did however still require that an image contained unoccupied posts. Unoccupied post deflections should theoretically be zero; therefore, the calculated deflections of these posts were used to confirm the accuracy of the measurement by calculating the standard deviation from zero of all unoccupied posts (σ). In addition, unoccupied posts were used to correct for any net full-field displacement. For example, when an mPAD is not perpendicular to the light path during image acquisition, each unoccupied post appeared deflected in the same direction and with the same magnitude. To correct for this, x- and y- components of the calculated force of unoccupied posts were summed (Σ[F]x and Σ[F]y) and averaged over the number of unoccupied posts. The resulting background vector was subtracted from all vectors:
| (9) |
| (10) |
To compare the accuracy of each of these methods (T-I and T-B), we examined the deflections calculated on unoccupied posts. A histogram of unoccupied post deflections (Fig. 4B) for both the T-I and T-B methods (n = 1168 and n = 1177, respectively) shows that the T-I method resulted in a larger population of unoccupied posts with high apparent deflections. On average, a cell-occupied post was deflected on the order of 0.5 microns. The solid vertical line in Fig. 4B represents a value of 25% of this average deflection, or 0.125 microns; the dashed vertical line represents a value of 50% of the average occupied post deflection, or 0.25 microns. The histogram indicates that for the T-I method, only 58.6% of the unoccupied post deflections are less than 0.125 microns, and 87.1% deflect less than 0.25 microns. For the T-B method, 82.2% of the unoccupied post deflections are less than 0.125 microns, and 98.6% deflect less than 0.25 microns. In addition, we also analyzed the unoccupied posts surrounding an individual cell of interest as a separate experimental group. The standard deviation from zero for a group of unoccupied posts (σ) was calculated for images analyzed using the T-I method (n = 35 images) or the T-B method (n = 26 images) (Fig. 4C). Results show that the mean value of σ for the T-B method (σTB = 0.095 +/− 0.031) was 35% lower than the mean value of σ for the T-I method (σTI = 0.149 +/− 0.079). Taken together, these analyses identified an important improvement in accuracy with the use of the T-B method.
3.5 Image analysis innovations for post centroid detection
Accuracy of mPAD image analysis relies heavily on the ability to determine the centroid position of posts in the top and base mPAD images ([C]T and [C]B, respectively). While well-illuminated, evenly stained substrates provide a clear image for identifying centroid position, in practice fluorescence images of the posts contain many potential sources of noise in detection of the posts and in centroid calculation. Many images did not have uniform illumination across the image. In addition, some images contained an interfering signal from the cell itself (Fig. 5A). For example, when the cell in question was stained with other fluorophore-conjugated antibodies, interference (“bleed-through”) from other spectral channels was occasionally observed. Here, we have investigated four strategies for post detection and evaluated the relative advantages and disadvantages of each. The first approach was a manual method, in which the location of each mPAD post in an image was determined by the user. The second approach was a global thresholding (GT) algorithm where a threshold value was applied to the entire fluorescence image, and posts were detected in the resulting black and white image (Fig. 5B). The third approach was a local thresholding (LT1) algorithm that determined a local threshold for each post separately based on the expected area of a post (Fig. 5C), instead of assigning one global threshold. The final approach was also a local thresholding (LT2) algorithm, which determined local thresholds not only on the basis of expected post area, but also eccentricity of the image as well as changes in area, eccentricity, and centroid position as functions of the threshold value (Fig. 5D). Finally, we quantitatively compared the four approaches by means of two indicators: standard deviation of unoccupied posts (σ) and the imbalance in force summation per total force generation (|Fnet|/Fmag).
The first approach to detect post edges was a manual method, in which the location of each mPAD post in an image was determined by the user. A circle was centered over the image of each post in both the top and base mPAD images. The resulting images of circles were exported, and the centroid of each circle was calculated by an edge detection module from IP Lab (Scanalytics, Fairfax, VA). This procedure was performed for both top and base mPAD images, resulting in the centroid matrices [C]T and [C]B. This resulted in accurate determination of post centroids, but was time-intensive and could be user biased, because the placement of the circle over each post image was done manually.
In order to reduce the analysis time and subjectivity of the manual method, we created the second approach, a global thresholding (GT) algorithm in Matlab (Matlab 6.5.1; Mathworks, Natick, MA). The concept of the algorithm was to import the raw fluorescence images of mPAD posts, calculate an appropriate threshold value TGT to identify posts, and generate a black and white image from the original image (pixels with values above TGT were assigned a value of 1, whereas pixels with values below TGT were assigned a value of 0). Edges of each post were then determined from the black and white image (Image Processing Toolbox 4, Matlab), and [C]T and [C]B were calculated from the detected post edges. Centroids were calculated using the regionprops function of the Matlab Image Processing Toolbox. This method required less time, as the Matlab program automatically calculated the appropriate threshold TGT, and then determined edges and centroids for each post. However, the method was easily skewed by low-quality images. For example, when illumination was not uniform across the mPAD, TGT was assigned a value between the brighter portions of the image and the dimmer portions of the image. Therefore, posts in the dimmer portion did not appear in the thresholded image at all, whereas posts in the brighter portion included surrounding pixels not associated with the post (Fig. 5B). In this situation, the automatically determined threshold was also not sufficient to differentiate between post-associated fluorescence and interfering fluorescence from other sources. These shortcomings prompted the third approach to detection of posts. Instead of determining one global threshold value for the entire image, a local thresholding algorithm (LT1) was created that scanned the image in small “windows” which contained only one post at a time, and threshold values (TLT1) were determined individually for each window based on the expected area (in pixels) (Pc) of each post. The number of pixels (P) with intensities above TLT1 was determined for all possible values of TLT1. An appropriate value of TLT1 where P was equal to Pc was selected. The LT1 algorithm resulted in improved edge detection of posts, and eliminated issues of defining posts in images with non-uniform illumination. However, there were still certain limitations of this method. Significant background interference led to a situation where Pc had been reached, but the resulting black and white image did not correspond with an accurate representation of the mPAD post. That is, the image had the appropriate number of pixels with intensities above TLT1, but did not appear as a uniform round circle and instead was marked by protrusions and/or missing voids in the circular image (Fig. 5C).
In order to improve on this approach, we developed a fourth method for detection of posts. This approach also used a local thresholding algorithm (LT2), but instead of tracking only P as a function of threshold value, we also tracked the eccentricity of the post image (E), the change in centroid position of the post as a function of threshold value , the change in P as a function of threshold value , and the change in eccentricity as a function of threshold value . An appropriate threshold value TLT2 was thus selected if it met the following criteria: the number of pixels (P) with intensities above TLT2 accurately corresponded to the expected post area (within user-defined limits); the eccentricity (E) was minimized, such that the resulting image was as close as possible to a uniform circle; the centroid position (C) did not change significantly with changes in threshold value (TLT2); the number of pixels (P) with intensities above the threshold value did not change significantly with changes in threshold value (TLT2); and the eccentricity (E) did not change significantly with changes in threshold value (TLT2). Values of P, E, and C as a function of TLT2 are shown for a representative mPAD post image (Fig. 5E). Centroid and eccentricity values for posts were calculated using the regionprops function of the Matlab Image Processing Toolbox. This approach was able to accurately identify post edges in images with either non-uniform illumination or interfering fluorescence (Fig. 5D).
The performance of each of the methods can be seen in the analysis of the fluorescence image in Fig. 5A, which contains both non-uniform illumination (lower arrows) and interfering fluorescence (upper arrows). Thresholding by the GT algorithm (Fig. 5B) did not detect posts in areas of low illumination. Thresholding by the LT1 algorithm (Fig. 5C) detected posts in both bright and dim regions of the image, but were not able to differentiate interfering fluorescence from post fluorescence. Thresholding by the LT2 algorithm (Fig. 5D) detected posts in non-uniformly illuminated areas as well as areas with interfering fluorescence. Scanning windows used for the LT1 and LT2 method are represented by the boxes in the upper right corner of the image.
In order to compare the relative merits of each of these four approaches (manual, GT, LT1, LT2) quantitatively, we analyzed 10 image sets (ranging from 48 to 132 posts per set). Each of these images was analyzed using the manual method, the GT algorithm, the LT1 algorithm, and the LT 2 algorithm. The accuracy of each method was assessed by way of two independent indicators. First, deflections of unoccupied posts were examined, and a standard deviation of deflections of unoccupied posts from zero (σ) was calculated. In addition, all force vectors associated with the cell-occupied posts should sum to zero. Therefore, a net force vector magnitude, |Fnet|, was calculated:
| (11) |
Values of |Fnet| were normalized by Fmag, resulting in a % force imbalance per total cell-generated force. Values of σ and |Fnet|/Fmag for each of the 4 methods are summarized in Tab. 1. The percentage of posts that failed to meet the criteria for each algorithm is also included, as is the total user time for each method. Results indicated that the LT2 method showed the lowest values for σ (0.085 +/− 0.012 μm) and |Fnet|/Fmag (9.6% +/− 5.6%). They also showed that a small percentage of posts fail to meet the LT2 criteria (1.5% +/− 1.9%). The GT algorithm resulted in reduced user time (106.6 +/− 10.4 s) as compared to the LT2 method (124.4 +/− 26.9 s), but was complicated by significantly higher values for σ (0.119 +/− 0.040 μm) (p < 0.01) and force imbalance (22.1 % +/− 29.7%) (p < 0.1). Results showed slight improvement in σ, force imbalance, and user time by the LT2 algorithm over the LT1 algorithm. A comparison of the LT2 algorithm to the manual method showed a greater than 90% reduction in analysis time and improvements in both σ (p < 0.05) and force imbalance.
Table 1.
mPAD analysis by four methods (n=10 images, ∼ 700 posts per method). Manual, GT Algorithm, LT(1) algorithm, and LT(2) algorithm methods were used. Standard deviation of unoccupied posts (σup), % net force imbalance (Fnet/Fmag), user time, and % posts excluded are shown.
| Method | σup | Fnet/Fmag | User Time | % of Posts Excluded |
|---|---|---|---|---|
| Manual | 0.101 μm +/− 0.017 μm*,# | 12.5 % +/− 7.3% | 1395.7 s +/− 437.9 s | N/A |
| GT | 0.119 μm +/− 0.040 μm#,§ | 22.1 % +/− 29.7%¶ | 106.6 s +/− 10.4 s | 24.8 % +/− 25.5 % |
| LT 1 | 0.092 μm +/− 0.011 μm | 10.4% +/− 5.1 % | 134.4 s +/− 21.4 s | 0.0% +/− 0.0% |
| LT 2 | 0.085 μm +/− 0.012 μm*,§ | 9.6 % +/− 5.6 %¶ | 124.4 s +/− 26.9 s | 1.5 % +/− 1.9% |
Levels of significance from ANOVA of data pairs marked with identical symbols:
p < 0.05
p < 0.05
p < 0.01
p < 0.1
3.6 Fully automated force analysis package
An analysis package has been written for Matlab which allows for complete analysis of mPAD post data. This program allows for fast, efficient, uniform analysis of images acquired from mPADs and is available for download at www.hopkinsmedicine.org/anesthesiology/research/mpadtools. Here we describe the methodology used to import and adjust fluorescence images, calculate mPAD post deflections, separate cell-occupied posts from unoccupied posts, and report indicators of accuracy and measured data.
The fully automated analysis program requires three 16-bit TIFF-format images as an input: one image of the top of the mPAD posts, one image of the base of the mPAD posts, and one image that represents the cell outline (e.g., an f-actin fluorescence image). The cell outline image is displayed, and the user is prompted to manually select a threshold which results in a binary image of the cell outline. A composite of the three images is then displayed, and the user is given the opportunity to rotate and crop the images so that only the cell(s) of interest remain(s).
These cropped images are then analyzed using the previously described algorithm for mPAD post detection and centroid determination described above (LT2). If the program scans all potential threshold values and is unable to find a value which meets the specified criteria for a given post, it displays the original image of that post and prompts the user to determine an appropriate threshold value manually. In the current version, posts failing to meet the specified criteria at any threshold value are less than 2% of the total post populations that we have examined. The resulting centroids are then sorted into two matrices containing the centroid for each post in the top and the base images. Displacement vectors [δ] TB are calculated by subtracting the base image centroids from the top image centroids (Eq. 8). The resulting vectors are then converted from pixels to microns using an image scaling factor (based on objective magnification and CCD camera specifications), and then converted to force vectors ([F]x and [F]y) using the measured spring constant of the mPAD posts.
mPAD posts are then separated into cell-occupied posts and unoccupied posts. Cell-occupied posts are used to calculate cell-related data, such as the net force imbalance |Fnet| and the total cell-generated force Fmag. Deflections of unoccupied posts are used as a measure of uncertainty (σ) and as a means of eliminating net full-field displacements, as discussed above. Occupied posts are separated from unoccupied posts by comparing the top mPAD image and the binary cell outline image. Both images are scanned in windows such that only one mPAD post is visible in each window. Any window that is occupied by portions of the top mPAD image and portions of the cell outline image is labeled as occupied. Otherwise posts are labeled as unoccupied.
After mPAD post deflections have been calculated for each post and the posts are separated into cell-occupied and unoccupied posts, deflections are corrected by subtracting the mean displacement vector of unoccupied posts from all deflections. This removes any global noise, such as that which occurs if the mPAD is not perpendicular to the light path. The program then calculates a number of measures of uncertainty, including the net force imbalance Fnet and the standard deviation of unoccupied posts σ, as well as a number of summarized data values, including the total cell- generated force Fmag, the total cell area, and the average force per post. Finally, force vectors are displayed as merged images with the mPAD top image and the cell outline image. Force vectors appear white for cell-occupied posts and red for unoccupied posts and are all scaled up in size by a factor of ten for ready visibility.
3.7 The relationship between surface area and force generation in various cell types
The mechanical force analysis, and the innovations in computational and image analysis detailed above provided a tool for the accurate and high throughput analysis of mPAD data from a large number of cells of four different lineages in order to determine the relationship between cell surface area and cell traction force. Data were analyzed from forces produced by fibroblasts (MEF), endothelial cells (HUVEC), mammary epithelial cells (MCF10a), and smooth muscle cells (SMC). Cells were seeded on mPADs that were prepared by microcontact printing with fibronectin, and allowed to spread to a steady state. Analysis was done after 24 hours in culture, as was done for the cells presented in Fig. 1. Fig. 6A-D show representative cells of each type, respectively, merged with the mPAD-calculated force vectors.
Figure 6.

Comparison of cell-generated force for four cell types. Representative force analysis for (A) mouse embryo fibroblasts (MEF); (B) human umbilical vein endothelial cells (HUVEC); (C) human mammary epithelial cells (MCF10a); and (D) bovine aortic smooth muscle cells (SMC). (E) Total force (nN) per cell for each of the four cell types. (F) Total force (nN) as a function of total cell area (μm2) for the four cell types.
Fig. 6E summarizes the total force generated for each cell line. SMCs generated the largest forces of the four cell types; MCF10a cells generated the least total cell force. Both HUVEC and MEF cells generated approximately the same level of total force. The comparison of total cell-generated force indicated differences between the four cell lines. However, the standard deviations indicate that there are large variations in these data. There are also large variations in total cell area in these cells; therefore, we compared the varying cell lines by plotting total cell-generated force against the total cell area (Fig. 6F). These results indicate a positive correlation between cell force and cell size. MCF10a cells tend to be small and generate little force, while HUVECs and MEFs have a much wider variation in total force and cell area. MCF10as, HUVECs, and MEFs all have similar but not identical force/area relationships, whereas SMCs have a much larger force to cell surface area ratio.
4 Discussion
In the current study, we have examined the bending pattern of mPAD posts and found that shear force is the dominant force type applied by cells. While previous studies have made this assumption ab initio, our experimental results provide evidence to support this model. We have also shown that total cell force is different in different cell lines. While the basis for these differences remains to be determined, we have found that the magnitude of force generally correlates with the area of cell spreading in a variety of cell lines, and that the ratio of force to cell area is similar for HUVEC and MEF cells, but is much larger for SMC. This conclusion is in agreement with previously published data. A study of force generation in BALB/c 3T3 fibroblasts plated on collagen (Gaudet, Marganski, Kim, Brown, Gunderia, Dembo and Wong 2003) demonstrated that these cells generated force/area ratios of 0.26-6.0 nN/μm2, depending on collagen density. Cells in that study ranged in size from 1000 to 2500 μm2. Over the same range of areas, our data for MEF shows a force/area relationship of 0.29 nN/μm2. In addition, studies using smooth muscle cells also showed a positive correlation between cell traction and cell size (Wang, Ostuni, Whitesides and Ingber 2002). The molecular basis for this relationship remains to be determined. The considerable difference in the force to cell area ratio for SMC may be attributable to calponin-enhanced stability of actin cross-bridges and force generation in these cells (Takahashi and Yamamura 2003; Szymanski 2004).
The ability to accurately measure cell-generated forces with straightforward computational methods can lead to significant advances in our understanding of the physical interactions of cells and their surroundings. Here we have presented a technique for accurately and quickly quantifying cell-generated forces through use of an mPAD system and novel image processing techniques. The use of an mPAD system allows for discrete measurements of force which greatly simplify calculations, because each mPAD post acts as a cantilever beam under shear force. The new method consists of fluorescently-labeling the entire mPAD post. This simplifies the measurement of deflection to a subtraction between centroids of each post in the top and base images. In addition, the new method consists of an image processing routine which scans each image as a series of discrete regions and determines an optimal threshold value for edge detection and centroid calculation for each post. This thresholding algorithm allows for automation of the mPAD analysis which dramatically decreases the analysis time.
Using this improved technique we have achieved a 4-fold reduction in background noise. Detection of traction forces above this limit for individual adhesions is sufficient to monitor the contractile behavior of cells. Further improvement in force resolution using the mPAD system will be required for the study of mechanical processes below this detection limit, such as the dynamic linking of adhesion receptors to the underlying cortical cytoskeleton. Another issue that remains unresolved in this and all traction force systems is to what extent the geometries, mechanical properties, and measurement approaches themselves may affect the traction forces being measured, although the data presented here in Figure 1 suggest that cell spreading, adhesion, and motility are normal on the mPAD surface. Several studies have suggested that cells actively respond to the mechanical conditions and history that exist between cells and their substrates (Geiger and Bershadsky 2001; Riveline, Zamir, Balaban, Schwarz, Ishizaki, Narumiya, Kam, Geiger and Bershadsky 2001; Chen, Tan and Tien 2004). Detailed studies characterizing these reactive processes remain to be completed.
Quantification of cell-generated forces could lead to significant insights into the molecular mechanisms of force generation, cell motility, and cell remodeling of the extracellular matrix. The traction forces studied here are generated by the acto-myosin machinery to clusters of trans-membrane integrin-mediated adhesive links with extracellular matrix that are termed focal adhesions (Rajfur, Roy, Otey, Romer and Jacobson 2002; Bershadsky, Balaban and Geiger 2003). Numerous molecular systems are involved in regulating these forces, including those that alter the linkages in the actin-integrin network, as well as those that modulate myosin activity, both of which are modulated by the Rho GTPases (Zhong, Chrzanowska-Wodnicka, Brown, Shaub, Belkin and Burridge 1998; Zamir and Geiger 2001; Tan, Tien, Pirone, Gray, Bhadriraju and Chen 2003). Importantly, forces are not merely a product of these molecular signals – forces themselves also directly generate and modulate signaling events. Individual adhesions respond to traction forces by altering their structure, and induce changes in numerous molecular signals, including FAK, and mDia-1 (Balaban, Schwarz, Riveline, Goichberg, Tzur, Sabanay, Mahalu, Safran, Bershadsky, Addadi and Geiger 2001; Riveline, Zamir, Balaban, Schwarz, Ishizaki, Narumiya, Kam, Geiger and Bershadsky 2001; Li, Butler, Wang, Hu, Han, Usami, Guan and Chien 2002; Bershadsky, Balaban and Geiger 2003; Danciu, Adam, Naruse, Freeman and Hauschka 2003; Graff and Lee 2003; Lee and Koh 2003). Thus, forces are both an end-product and critical intermediary in numerous signaling processes. Providing a direct measure for these forces with subcellular resolution is critical to defining these mechanotransduction pathways, and the role of these pathways in cellular processes such as migration, morphogenesis, and ECM remodeling, and in tissue processes such as wound healing, tumor invasion, and angiogenesis (Young, Richman, Ketchum and Kiehart 1993; Kiehart, Galbraith, Edwards, Rickoll and Montague 2000; Vogel and Baneyx 2003; Friedl, Hegerfeldt and Tusch 2004; Sottile 2004).
Acknowledgement
The authors thank Fumin Chang for helpful suggestions and discussions, and Wendy Liu for technical assistance. This work was supported in part by the Whitaker Foundation (CL, JT, SAR), the Ruth Kirschstein National Research Service Award Fellowship (NS), the Department of Defense Multidisciplinary University Research Initiative (CC), the NIH (DE13079 and HL058064 to LR, and EB00262 and HL073305 to CC), and the Johns Hopkins University Fund for Medical Discovery (to LR and CC).
References
- Balaban NQ, Schwarz US, Riveline D, Goichberg P, Tzur G, Sabanay I, Mahalu D, Safran S, Bershadsky A, Addadi L, Geiger B. Force and focal adhesion assembly: a close relationship studied using elastic micropatterned substrates. Nat Cell Biol. 2001;3(5):466–72. doi: 10.1038/35074532. [DOI] [PubMed] [Google Scholar]
- Beer F, Johnston E. Mechanics of Materials. McGraw-Hill, Inc.; 1981. [Google Scholar]
- Beningo KA, Dembo M, Kaverina I, Small JV, Wang YL. Nascent focal adhesions are responsible for the generation of strong propulsive forces in migrating fibroblasts. J Cell Biol. 2001;153(4):881–8. doi: 10.1083/jcb.153.4.881. [DOI] [PMC free article] [PubMed] [Google Scholar]
- Bershadsky AD, Balaban NQ, Geiger B. Adhesion-dependent cell mechanosensitivity. Annu Rev Cell Dev Biol. 2003;19:677–95. doi: 10.1146/annurev.cellbio.19.111301.153011. [DOI] [PubMed] [Google Scholar]
- Bogatcheva NV, Garcia JG, Verin AD. Molecular mechanisms of thrombin-induced endothelial cell permeability. Biochemistry (Mosc) 2002;67(1):75–84. doi: 10.1023/a:1013904231324. [DOI] [PubMed] [Google Scholar]
- Burridge K, Chrzanowska-Wodnicka M. Focal adhesions, contractility, and signaling. Annu Rev Cell Dev Biol. 1996;12:463–518. doi: 10.1146/annurev.cellbio.12.1.463. [DOI] [PubMed] [Google Scholar]
- Burton K, Park JH, Taylor DL. Keratocytes generate traction forces in two phases. Mol Biol Cell. 1999;10(11):3745–69. doi: 10.1091/mbc.10.11.3745. [DOI] [PMC free article] [PubMed] [Google Scholar]
- Chen CS, Alonso JL, Ostuni E, Whitesides GM, Ingber DE. Cell shape provides global control of focal adhesion assembly. Biochem Biophys Res Commun. 2003;307(2):355–61. doi: 10.1016/s0006-291x(03)01165-3. [DOI] [PubMed] [Google Scholar]
- Chen CS, Tan J, Tien J. Mechanotransduction at cell-matrix and cell-cell contacts. Annu Rev Biomed Eng. 2004;6:275–302. doi: 10.1146/annurev.bioeng.6.040803.140040. [DOI] [PubMed] [Google Scholar]
- Danciu TE, Adam RM, Naruse K, Freeman MR, Hauschka PV. Calcium regulates the PI3K-Akt pathway in stretched osteoblasts. FEBS Lett. 2003;536(13):193–7. doi: 10.1016/s0014-5793(03)00055-3. [DOI] [PubMed] [Google Scholar]
- Dembo M, Wang YL. Stresses at the cell-to-substrate interface during locomotion of fibroblasts. Biophys J. 1999;76(4):2307–16. doi: 10.1016/S0006-3495(99)77386-8. [DOI] [PMC free article] [PubMed] [Google Scholar]
- Friedl P, Hegerfeldt Y, Tusch M. Collective cell migration in morphogenesis and cancer. Int J Dev Biol. 2004;48(56):441–9. doi: 10.1387/ijdb.041821pf. [DOI] [PubMed] [Google Scholar]
- Galbraith CG, Sheetz MP. A micromachined device provides a new bend on fibroblast traction forces. Proc Natl Acad Sci U S A. 1997;94(17):9114–8. doi: 10.1073/pnas.94.17.9114. [DOI] [PMC free article] [PubMed] [Google Scholar]
- Gaudet C, Marganski WA, Kim S, Brown CT, Gunderia V, Dembo M, Wong JY. Influence of type I collagen surface density on fibroblast spreading, motility, and contractility. Biophys J. 2003;85(5):3329–35. doi: 10.1016/S0006-3495(03)74752-3. [DOI] [PMC free article] [PubMed] [Google Scholar]
- Geiger B, Bershadsky A. Assembly and mechanosensory function of focal contacts. Curr Opin Cell Biol. 2001;13(5):584–92. doi: 10.1016/s0955-0674(00)00255-6. [DOI] [PubMed] [Google Scholar]
- Graff RD, Lee GM. Microplate live cell assay system for early events in mechanotransduction. Anal Biochem. 2003;318(2):181–6. doi: 10.1016/s0003-2697(03)00212-4. [DOI] [PubMed] [Google Scholar]
- Harris AK., Jr. Tissue culture cells on deformable substrata: biomechanical implications. J Biomech Eng. 1984;106(1):19–24. doi: 10.1115/1.3138449. [DOI] [PubMed] [Google Scholar]
- Huang S, Chen CS, Ingber DE. Control of cyclin D1, p27(Kip1), and cell cycle progression in human capillary endothelial cells by cell shape and cytoskeletal tension. Mol Biol Cell. 1998;9(11):3179–93. doi: 10.1091/mbc.9.11.3179. [DOI] [PMC free article] [PubMed] [Google Scholar]
- Jockusch BM, Bubeck P, Giehl K, Kroemker M, Moschner J, Rothkegel M, Rudiger M, Schluter K, Stanke G, Winkler J. The molecular architecture of focal adhesions. Annu Rev Cell Dev Biol. 1995;11:379–416. doi: 10.1146/annurev.cb.11.110195.002115. [DOI] [PubMed] [Google Scholar]
- Kiehart DP, Galbraith CG, Edwards KA, Rickoll WL, Montague RA. Multiple forces contribute to cell sheet morphogenesis for dorsal closure in Drosophila. J Cell Biol. 2000;149(2):471–90. doi: 10.1083/jcb.149.2.471. [DOI] [PMC free article] [PubMed] [Google Scholar]
- Lee HJ, Koh GY. Shear stress activates Tie2 receptor tyrosine kinase in human endothelial cells. Biochem Biophys Res Commun. 2003;304(2):399–404. doi: 10.1016/s0006-291x(03)00592-8. [DOI] [PubMed] [Google Scholar]
- Lee J, Leonard M, Oliver T, Ishihara A, Jacobson K. Traction forces generated by locomoting keratocytes. J. Cell Biol. 1994;127(6):1957–1964. doi: 10.1083/jcb.127.6.1957. [DOI] [PMC free article] [PubMed] [Google Scholar]
- Li S, Butler P, Wang Y, Hu Y, Han DC, Usami S, Guan JL, Chien S. The role of the dynamics of focal adhesion kinase in the mechanotaxis of endothelial cells. Proc Natl Acad Sci U S A. 2002;99(6):3546–51. doi: 10.1073/pnas.052018099. [DOI] [PMC free article] [PubMed] [Google Scholar]
- Liberto M, Cobrinik D, Minden A. Rho regulates p21(CIP1), cyclin D1, and checkpoint control in mammary epithelial cells. Oncogene. 2002;21(10):1590–9. doi: 10.1038/sj.onc.1205242. [DOI] [PubMed] [Google Scholar]
- Munevar S, Wang YL, Dembo M. Distinct roles of frontal and rear cell-substrate adhesions in fibroblast migration. Mol Biol Cell. 2001;12(12):3947–54. doi: 10.1091/mbc.12.12.3947. [DOI] [PMC free article] [PubMed] [Google Scholar]
- Rajfur Z, Roy P, Otey C, Romer L, Jacobson K. Dissecting the link between stress fibres and focal adhesions by CALI with EGFP fusion proteins. Nat Cell Biol. 2002;4(4):286–93. doi: 10.1038/ncb772. [DOI] [PubMed] [Google Scholar]
- Riveline D, Zamir E, Balaban NQ, Schwarz US, Ishizaki T, Narumiya S, Kam Z, Geiger B, Bershadsky AD. Focal contacts as mechanosensors: externally applied local mechanical force induces growth of focal contacts by an mDia1-dependent and ROCK-independent mechanism. J Cell Biol. 2001;153(6):1175–86. doi: 10.1083/jcb.153.6.1175. [DOI] [PMC free article] [PubMed] [Google Scholar]
- Small JV, Rottner K, Kaverina I, Anderson KI. Assembling an actin cytoskeleton for cell attachment and movement. Biochim Biophys Acta. 1998;1404(3):271–81. doi: 10.1016/s0167-4889(98)00080-9. [DOI] [PubMed] [Google Scholar]
- Sottile J. Regulation of angiogenesis by extracellular matrix. Biochim Biophys Acta. 2004;1654(1):13–22. doi: 10.1016/j.bbcan.2003.07.002. [DOI] [PubMed] [Google Scholar]
- Szymanski PT. Calponin (CaP) as a latch-bridge protein–a new concept in regulation of contractility in smooth muscles. J Muscle Res Cell Motil. 2004;25(1):7–19. doi: 10.1023/b:jure.0000021349.47697.bf. [DOI] [PubMed] [Google Scholar]
- Takahashi K, Yamamura H. Studies and perspectives of calponin in smooth muscle regulation and cancer gene therapy. Adv Biophys. 2003;37:91–111. doi: 10.1016/s0065-227x(03)80004-7. [DOI] [PubMed] [Google Scholar]
- Tan JL, Liu W, Nelson CM, Raghavan S, Chen CS. Simple approach to micropattern cells on common culture substrates by tuning substrate wettability. Tissue Eng. 2004;10:5–6. doi: 10.1089/1076327041348365. pp. 865-72. [DOI] [PubMed] [Google Scholar]
- Tan JL, Tien J, Pirone DM, Gray DS, Bhadriraju K, Chen CS. Cells lying on a bed of microneedles: an approach to isolate mechanical force. Proc Natl Acad Sci U S A. 2003;100(4):1484–9. doi: 10.1073/pnas.0235407100. [DOI] [PMC free article] [PubMed] [Google Scholar]
- Vogel V, Baneyx G. The tissue engineering puzzle: a molecular perspective. Annu Rev Biomed Eng. 2003;5:441–63. doi: 10.1146/annurev.bioeng.5.040202.121615. [DOI] [PubMed] [Google Scholar]
- Wang HB, Dembo M, Hanks SK, Wang Y. Focal adhesion kinase is involved in mechanosensing during fibroblast migration. Proc Natl Acad Sci U S A. 2001;98(20):11295–300. doi: 10.1073/pnas.201201198. [DOI] [PMC free article] [PubMed] [Google Scholar]
- Wang N, Ostuni E, Whitesides GM, Ingber DE. Micropatterning tractional forces in living cells. Cell Motil Cytoskeleton. 2002;52(2):97–106. doi: 10.1002/cm.10037. [DOI] [PubMed] [Google Scholar]
- Wang N, Tolic-Norrelykke IM, Chen J, Mijailovich SM, Butler JP, Fredberg JJ, Stamenovic D. Cell prestress. I. Stiffness and prestress are closely associated in adherent contractile cells. Am J Physiol Cell Physiol. 2002;282(3):C606–16. doi: 10.1152/ajpcell.00269.2001. [DOI] [PubMed] [Google Scholar]
- Wolf A, Raiss RX, Steinmeyer J. Fibronectin metabolism of cartilage explants in response to the frequency of intermittent loading. J Orthop Res. 2003;21(6):1081–9. doi: 10.1016/S0736-0266(03)00064-0. [DOI] [PubMed] [Google Scholar]
- Yamada KM, Geiger B. Molecular interactions in cell adhesion complexes. Curr Opin Cell Biol. 1997;9(1):76–85. doi: 10.1016/s0955-0674(97)80155-x. [DOI] [PubMed] [Google Scholar]
- Young PE, Richman AM, Ketchum AS, Kiehart DP. Morphogenesis in Drosophila requires nonmuscle myosin heavy chain function. Genes Dev. 1993;7(1):29–41. doi: 10.1101/gad.7.1.29. [DOI] [PubMed] [Google Scholar]
- Zamir E, Geiger B. Molecular complexity and dynamics of cell-matrix adhesions. J Cell Sci. 2001;114(Pt 20):3583–90. doi: 10.1242/jcs.114.20.3583. [DOI] [PubMed] [Google Scholar]
- Zhong C, Chrzanowska-Wodnicka M, Brown J, Shaub A, Belkin AM, Burridge K. Rho-mediated contractility exposes a cryptic site in fibronectin and induces fibronectin matrix assembly. J Cell Biol. 1998;141(2):539–51. doi: 10.1083/jcb.141.2.539. [DOI] [PMC free article] [PubMed] [Google Scholar]