Abstract
Bistability arises within a wide range of biological systems from the λ phage switch in bacteria to cellular signal transduction pathways in mammalian cells. Changes in regulatory mechanisms may result in genetic switching in a bistable system. Recently, more and more experimental evidence in the form of bimodal population distributions indicates that noise plays a very important role in the switching of bistable systems. Although deterministic models have been used for studying the existence of bistability properties under various system conditions, these models cannot realize cell-to-cell fluctuations in genetic switching. However, there is a lag in the development of stochastic models for studying the impact of noise in bistable systems because of the lack of detailed knowledge of biochemical reactions, kinetic rates, and molecular numbers. In this work, we develop a previously undescribed general technique for developing quantitative stochastic models for large-scale genetic regulatory networks by introducing Poisson random variables into deterministic models described by ordinary differential equations. Two stochastic models have been proposed for the genetic toggle switch interfaced with either the SOS signaling pathway or a quorum-sensing signaling pathway, and we have successfully realized experimental results showing bimodal population distributions. Because the introduced stochastic models are based on widely used ordinary differential equation models, the success of this work suggests that this approach is a very promising one for studying noise in large-scale genetic regulatory networks.
Keywords: genetic regulatory network, stochastic modeling, stochastic simulation, noise
One of the major challenges in systems biology is the development of quantitative mathematical models for studying regulatory mechanisms in complex biological systems. Bistability is a fundamental behavior of biological systems and has been studied extensively through experiments, theoretical analysis, and numerical simulations (1–5). A bistable system has two distinct steady states, and any initial setting of a system state will eventually lead the system into one of the steady states. Biological examples of bistable systems include the λ phage lysis–lysogeny switch (6–9), the genetic toggle switch (10–12), the lactose operon repressor system (13–15), cellular signal transduction pathways (16–19), and the system of cell-cycle control (20). In contrast to monostable systems, regulatory mechanisms are the key in realizing switching of bistable systems. Regulatory mechanisms in bistable biological systems include inhibition/activation, positive feedback, double-negative feedback, and multisite phosphorylation (19). A bistable system can switch from one steady state to the other by increasing stimulation or inhibition or by changing other regulatory mechanisms. Recent studies through biological experiments have indicated that noise plays a very important role in the dynamic behavior of bistable systems. For example, bimodal population distributions have been observed in the genetic switching of bistable systems such as the genetic toggle switch and lactose operon system (10, 11, 15).
Deterministic models have been widely used for analyzing bistability properties of biological systems in terms of regulatory mechanisms and kinetic parameters (10, 11, 15, 16, 21). Although bifurcation analysis can clearly indicate the existence of bistability properties under various system conditions, a deterministic model can only describe the averaged behavior of a system based on large populations but cannot realize fluctuations of the system behavior in different cells, such as the case of the bimodal population distributions in bistable systems. Recently, there has been an accelerating interest in the investigation of the effect of noise in genetic regulations through stochastic modeling (1, 2, 7–9, 21–27). Stochastic models have been developed based on detailed knowledge of biochemical reactions, molecular numbers, and kinetic rates and have realized important characteristics of biological systems in genetic switching of the λ phage lysis-lysogeny system and in robustness of circadian rhythms. However, data availability and regulatory information usually cannot provide a comprehensive picture of biological regulations, and although a number of methods have been proposed for the study of noise in large-scale genetic regulatory networks, such as stochastic Boolean models (28, 29) and probabilistic hybrid approach (30), there is not a realistic, common approach for studying kinetic dynamics of large-scale genetic regulatory networks in a stochastic setting.
Here we introduce a previously undescribed general technique for the development of quantitative stochastic models based on widely used deterministic ordinary differential equation (ODE) models. Instead of studying noise from detailed information of biochemical reactions, we will develop stochastic models by using macroscopic variables at some intermediate levels. Based on recent progress in stochastic simulation, the key idea is to use Poisson random variables to represent chance events in protein synthesis, degradation, molecular diffusion, and other biological processes in genetic regulatory networks. The proposed technique is also consistent with the stochastic model in ref. 27 where Poisson random variables have been used for realizing the chance events in transcription and translation.
We demonstrate the power of this technique by analyzing the stochastic behavior of the genetic toggle switch interfaced with either the SOS signal pathway or the quorum-sensing signal pathway. The genetic toggle switch, which is the first engineered switching network implemented on plasmids in Escherichia coli (10, 11) and in mammalian cells (12), is a robust bistable system comprising two genes and regulated by a double-negative feedback loop. Although the noise-induced transitions between the steady states are rare (11), transitions can be induced by a signal such as the SOS or the quorum-sensing signal pathways, and noise has significant impact on the dynamic behavior of the bistable systems in transitions. Based on successful numerical realization of experimental results showing bimodal population distributions, insights are obtained for the role of noise in the transitions of the genetic toggle switches.
Discussion
In this work, we have discussed the development of stochastic models based on widely used deterministic ODE models with macromolecular variables. The motivation is to study the stochastic dynamics of biological systems when the detailed information of biochemical reactions is not available. The theoretical background of this approach comes from the τ-leap methods that link the stochastic simulation of biochemical reaction systems to the Euler method for solving ODEs via the mean. Compared with probabilistic Boolean models and hybrid models, this approach is one step further toward the quantitative descriptions of the stochastic dynamics of biological systems. In addition, this approach gives an appropriate technique for introducing noise into deterministic models to study robustness properties (sensitivity) of deterministic models. We have proposed two stochastic models that have been used to realize experimental results with bimodal population distributions for the toggle switch system that is interfaced with either the SOS or the quorum-sensing signaling pathway.
Two mechanisms were adopted in experiments to realize switching in the genetic toggle switch: to decrease high protein expression level by introducing the SOS signaling pathway or to increase the low protein expression level by introducing the quorum-sensing signaling pathway. In both cases, the induction, either by the activation of protein RecA or the expression of LacR from the sensor plasmid, will shift the system from one of the steady states to an intermediate state. In deterministic simulations, the system just stays at these intermediate states, and no switching occurs at all. However, intrinsic noise in stochastic simulations can switch the system from the intermediate state to the other steady state. Different intermediate states, which are determined by different strengths of the induction, will lead to different probabilities of the transitions between the two steady states. Simulation results predict the ultrasensitive response of the genetic switching in the system of the genetic toggle switch that is interfaced with either the SOS or a quorum-sensing signaling pathway. Two implementations, in which cell volume is either a constant or a function of time (see Supporting Text and Figs. 7–10, which are published as supporting information on the PNAS web site), make strikingly similar predictions for the ultrasensitive response of the genetic switching. However, it is impossible for intrinsic noise in numerical simulations to switch the system from one steady state to the other if the system stays in one of the steady states. These simulation results are consistent with experimental observations, namely that the genetic toggle switch is a robust bistable system and that noise-induced transitions are rare (10, 11).
There are a few ways that external noise can be added to our modeling framework. We note that if the numbers of molecules are relatively large, then we can adopt the Langevin approach, which gives a stochastic differential equation, and then represent external noise effects by the addition of simple scaled noise processes such as additive noise or multiplicative noise based on Wiener processes (9, 21). An alternative approach is to maintain the discrete nature and allow some of the key elements to be perturbed by external noise. We can assume that some parameters such as the plasmid copy numbers are fixed in each cell but can vary from cell to cell within a certain distribution, and we can use stochastic reaction rates to represent external noise (31). Or we can assume that external noise can affect key regulatory processes, so that they only execute faithfully some percentage of the time. We then could investigate switching behavior as a function of this percentage and compare experimentally. These issues are beyond the scope of this work, but it would be interesting to see how much external noise is needed to cause transitions and relate to experimental results.
Methods
The proposed modeling technique is based on the Poisson τ-leap method (32) that can be regarded as a bridge linking deterministic and stochastic models. This method was designed to improve the computational efficiency of the stochastic simulation algorithm, a pioneering work of Gillespie (33) for simulating the evolution of molecular numbers in a well stirred biochemical reaction system. Here, it is assumed that a well stirred biochemical reaction system contains N molecular species {S1, …, SN} with number Xi(t) of the species Si at time t. These species of molecules chemically interact inside a volume Ω at a constant temperature through reaction channels {R1, …, RM}. For each reaction Rj(j = 1, …, M), a propensity function aj(x) is defined in a given state X(t) = (X1(t), …, XN(t))T = x, and aj(x)dt represents the probability that one reaction Rj will occur inside Ω in the infinitesimal time interval [t, t + dt). In addition, a state change vector νj is defined to characterize reaction channel Rj. The element νij of νj represents the change in the number of species Si due to reaction Rj.
The stochastic simulation algorithm is a statistically exact procedure for generating the time and index of the next occurring reaction in accordance with the current values of the propensity functions. However, the bottleneck in the application of this method is the large computing time because of the possibility of having very small stepsizes. In the Poisson τ-leap method, it is assumed that there are a number of reactions firing in a relatively larger time interval [t, t + τ). The reaction number of channel Rj is a sample value generated from a Poisson random variable P(aj(x)τ) with mean aj(x)τ (32). After generating a sample value for each reaction channel, the system is updated by
 |
We can find the relationship between a stochastic model, simulated by the Poisson τ-leap method, with the corresponding deterministic ODE model simulated by the Euler method. Consider a simple system with two reactions, given by
 |
By using the Poisson τ-leap method, the number of S3 molecules within the time interval [t, t + τ) is updated by
The mean x̄i (= E(xi)) of molecular numbers in the above Poisson τ-leap method can be obtained by the Euler method for solving the ODE with respect to x̄3, given by
namely, x̄3(t + τ) = x̄3(t) + τ[c1x̄1(t)x̄2(t) − c2x̄3(t)] (assuming independence of x1 and x2).
A further example is the enzymatic reaction
 |
with enzyme E and substrate S. The quasi-steady-state assumption can be applied to approximate the concentration of the enzyme–substrate complex ES under certain conditions. Then the three reactions in this enzymatic reaction can be simplified into one single reaction
where c = Vmax/(Km + s), Vmax = k2(E + ES) and Km = (k−1 + k2)/k1, and the stochastic simulation algorithm (SSA) was applied to simulate this simplified reaction (34). Applying the Poisson τ-leap method to the one single reaction in Eq. 1, the system is updated by
If the dynamics of the enzymatic reaction is described by an equation with the Michaelis–Menten function, given by
the mean s̄ of the substrate number obtained by the Poisson τ-leap method in Eq. 2 is well approximated by the Euler method for solving the above differential equation.
These two examples indicate that we can construct stochastic models for biochemical reaction systems from well defined deterministic ODE models. Each item in the deterministic model for a biological process can be replaced by a Poisson random variable. Consider a system containing N species and described by the following deterministic model:
where fi(x̄1, …, x̄N) and gi(x̄1, …, x̄N) represent the increase and decrease processes in the value x̄i of species Si, respectively. Here x̄i normally represents the concentration of species Si, whereas in stochastic models we use xi to represent the molecular number of species Si. It is assumed that the increase and decrease of the molecular number xi in a time interval [t, t + τ) are samples of the Poisson random variables with mean fi(x1, …, xN)τ and gi(x1, …, xN)τ, respectively, and the system is updated by
 |
Note that Poisson random variables in the above model can be approximated by binomial random variables to avoid negative molecular numbers in simulations and to improve the computational efficiency (35).
If the increase process fi(x) = fi(x1, …, xN) contains a number of macroscopic reactions, so that fi(x) can be written as fi(x) = fi1(x) + … + fik(x) [here fij(x) ≥ 0 represents a process in which species Si is involved], then the Poisson random variable P(fi(x)τ) can be replaced by P(fi1(x)τ) + … + P(fik(x)τ). This replacement is valid because the sum of two Poisson random variables P(λ1) and P(λ2) is also Poisson P(λ1 + λ2). Similar considerations can be applied to the decrease process gi(x1, …, xN).
We reemphasize that, although our computational method is based on the existing Poisson τ-leap method of Gillespie (32), the modeling insight is that we do not have to go back to detailed first-principle biochemical reactions to develop stochastic models. Rather, we can take existing robust ODE models that may encapsulate detailed chemical kinetics by various Hill functions and quasi-steady-state assumptions and apply the Poisson τ-leap method in the way described. This approach is not purely computational but gives a general methodology for introducing intrinsic noise into robust deterministic models in a very simple manner.
Toggle Switch with the SOS Pathway.
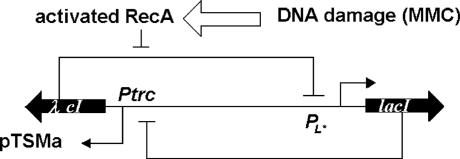
The genetic toggle switches consist of two genes, lacI and λ cI, that encode the transcriptional regulator proteins LacR and λ CI, respectively (10, 11). In Fig. 1, the lacI gene is expressed from the promoter PL that is repressed by λ CI, whereas the λ cI gene is expressed from the promoter Ptrc that is repressed by LacR. This system has two distinct bistable states. The expression of lacI is low when λ cI has high expression level, or vice versa. Transitions between the steady states can be induced by a signal that temporarily moves the system out of the bistable region.
Fig. 1.
The genetic toggle switch interfaced with the SOS signaling pathway.
To evaluate the ability of the genetic toggle switch in responding to the activation of the SOS pathway, E. coli cells were exposed to various concentrations of mitomycin C (MMC). The application of MMC causes DNA damage that leads to the activation of protein RecA. Activated RecA cleaves the λ CI repressor protein, resulting in the increase of the expression of gene lacI. Changes in gene expression levels will create an environment for cells to transfer from one steady state with high λ cI expression level to the other steady state with high lacI expression level. Transitions between the steady states were measured by the quantitative GFP expression in single cells 3–6 h after the exposure of cells to various concentrations of MMC for 15 h (11). In the absence of MMC, all cells exhibited little or no GFP expression. Nearly all of the cells expressed GFP after treatment with 500 ng/ml MMC. Bimodal population distributions were observed at intermediate MMC concentrations for the cell numbers with different GFP expression levels.
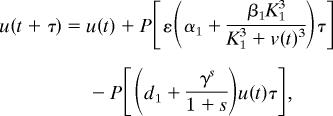
A deterministic model has been proposed for studying the existence of bistability properties of the genetic toggle switch (10, 11). Although this deterministic model can realize two distinct steady states and genetic switching, it cannot realize experimental results with different genetic switching in different cells under the same experimental conditions. Based on this deterministic model, we propose a stochastic model to realize experimental results with bimodal population distributions with regard to the expression levels of LacR. The system is updated by the generated Poisson samples, given by
 |
 |
where u and v are molecular numbers of λ CI and LacR, respectively; α1 and α1 + β1 represent the basal and maximal synthesis rates of λ CI, respectively; and α2 and α2 + β2 are the equivalent parameters for LacR expression. In addition, ε is associated with the copy number of the toggle switch plasmid, s represents the effect of MMC on the degradation of λ CI, and d2 is the degradation rate of LacR. Reaction data are α1 = α2 = 0.2 μM·min−1, β1 = β2 = 4 μM·min−1, ε = 1, d1 = d2 = 1 min−1, K1 = K2 = 1 μM, and γ = 1 min−1 (11). It has been estimated that ≈500 molecules per cell in E. coli leads to a concentration of 1 μM (36). The initial molecular numbers are u(0) = 2,125 and v(0) = 125 (11). The time unit is selected to be consistent with that in the model discussed in the next section. We have tested the kinetic rates in the time unit of hours and also obtained numerical bimodal population distributions (data not shown). Different time units in the kinetic rates imply different values of the degradation parameter s. In addition, it is assumed above that the volume of the cell is a constant. We discuss another implementation of this stochastic model in Supporting Text by considering the processes of cell growth and cell division. Both implementations make similar predictions of the ultrasensitive response of the genetic switching in terms of different values of s in a number of experimental conditions (see Supporting Text and Figs. 7–10 for details).
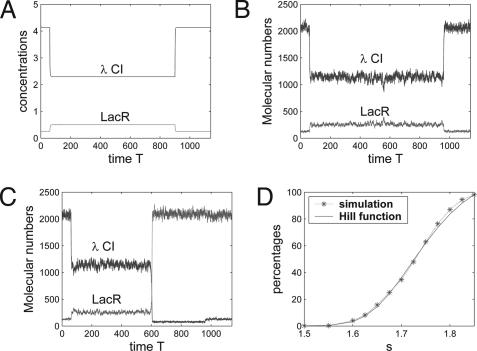
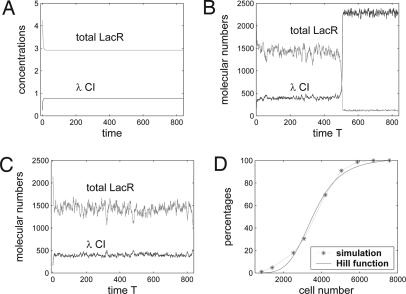
As cells were exposed to various concentrations of MMC for 15 h (11), the degradation rate of λ CI is d1 = 1 when t ∈ [0, 60] and t ≥ 960, but d1 + γs/(1 + s) in t ∈ [60, 960]. This large degradation in deterministic simulations will shift the system from the steady state to an intermediate state, and genetic switching will happen only if the concentration of λ CI is below a threshold value. In the deterministic model, there is no switching for s ≤ 2.0, but switching can occur for s > 2.0 (Fig. 2A; s = 1.7). However, the situation with stochastic simulations is entirely different. Fig. 2 gives two simulations for an unsuccessful transition in Fig. 2B and a successful transition in Fig. 2C with the same degradation parameter s = 1.7. In both simulations, the decrease of λ CI shifts the system from the steady state with high λ CI expression level to an intermediate unstable state with λ CI ≈ 1,140 and LacR ≈ 255. Intrinsic noise also may switch the system from this intermediate unstable state to the other steady state with λ CI ≈ 130 and LacR ≈ 2,050. If the transition between the steady states does not happen during t ∈ [60, 960], the system will bounce back to the initial steady state.
Fig. 2.
Simulations of the genetic toggle switch interfaced with the SOS signaling pathway. (A) A deterministic simulation of unsuccessful switching (s = 1.7). (B) A stochastic simulation of unsuccessful switching based on s = 1.7. (C) A stochastic simulation of successful switching also based on s = 1.7. (D) Percentages of switched cells in stochastic simulations based on different degradation parameter s and percentages obtained by a Hill function p(s) = 1.2364 × (s − s0)4/(0.254 + (s − s0)4) × 100%, where 1.2364 is used to match the simulated percentage when s = 1.85.
When a different value of the degradation parameter s is used, the system will shift from the steady state with high λ CI expression level to an intermediate state with slightly different gene expression levels. This difference in expression levels does not have much impact on the dynamic behavior of the system in deterministic simulations unless the expression of λ CI is below a threshold value for switching. However, the difference in molecular numbers in stochastic simulations has significant influence on the system dynamics and can result in different probabilities for intrinsic noise to switch the system from the intermediate state to the other steady state. Fig. 2D shows the percentages of switched cells based on different values of s. These percentages can be approximated by a Hill function, and we can use a Hill coefficient 4 to best fit the simulated percentages. The protein number of LacR was measured at t = 1140. We also have measured the LacR number at subsequent time points, and there is little change in the percentages of switched cells. This result is consistent with the experimental observations and indicates that the genetic toggle switch is a robust bistable system, so that noise-induced transitions are rare (10, 11).
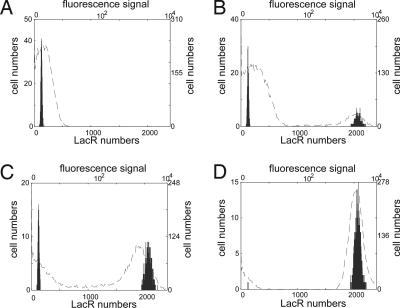
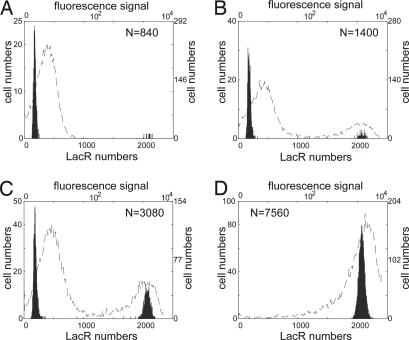
Fig. 3 gives four bimodal distributions for the number of cells with different LacR molecular numbers when the degradation parameter s is 1.3, 1.7, 1.75, and 2, respectively. These simulated bimodal distributions are compared with experimental results that are derived from figure 3B in ref. 11 by using the software imagej (http://rsb.info.nih.gov/ij). Qualitative comparisons in Fig. 3 indicate that simulation results are consistent with experimental results in terms of the percentages of switched cells. We note, however, that the simulated bimodal distributions are spiky, whereas the experimental distributions are noisier and wider. This result may be due to the fact that cell numbers in the simulations are much smaller than those in experiments or that there are additional external noise factors.
Fig. 3.
Comparison of simulation results with experimental observations for the genetic toggle switch interfaced with the SOS signaling pathway. Numbers of cells with different LacR molecular numbers are based on 1,000 simulations, and experimental observations in fluorescence signal are derived from figure 3B in ref. 11 using the top and right labels. (A) s = 1.3; no cell has high LacR expression level, and no MMC was applied in experiments. (B) s = 1.7; 35.9% of cells have high LacR expression levels, and 1 ng/ml MMC was applied. (C) s = 1.75; 67.1% of cells have high LacR expression level, and 10 ng/ml MMC was applied. (D) s = 2.0; all cells have high LacR expression levels, and 500 ng/ml MMC was applied.
Toggle Switch with a Quorum-Sensing Signaling Pathway.
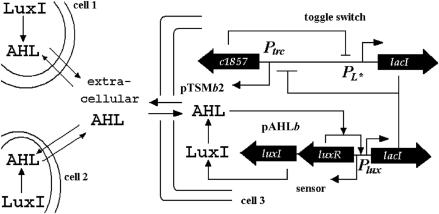
The second stochastic model describes the dynamics of the genetic toggle switch interfaced with a quorum-sensing signaling pathway. In this system, acyl-homoserine lactone (AHL) in Gram-negative bacteria is a signal protein to coordinate cellular activities in the culture with different cell population densities. Kobayashi et al. (11) have constructed an engineered gene network containing three different plasmids, namely a sensor plasmid containing three genes luxI, luxR, and lacI; the toggle switch plasmid for the expression of LacR and λ CI; and an output plasmid with the reporter gene gfp. In Fig. 4, protein LuxI from the sensor plasmid is a synthetase that converts common precusor metabolites into AHL. The signal molecule AHL diffuses between the culture and cells, results in different concentrations of AHL in the extracellular culture due to different cell population densities, and regulates the transcription of lacI in the sensor plasmid by the AHL–LuxR dimer. The expression of LacR in the toggle switch plasmid is negatively regulated by λ CI, whereas the expression of λ CI is negatively regulated by the total LacR expressed from the sensor plasmid and the toggle switch plasmid. As with the model discussed in the previous section, the reporter gene gfp is not included in the mathematical model, and we use the LacR expression levels as an indicator of the GFP expressions.
Fig. 4.
The genetic toggle switch interfaced by a quorum-sensing signaling pathway.
A deterministic model is developed first for this system that contains N cells in the culture. In each cell, we will study the dynamics of proteins AHL, LacR, and λ CI. Because the number of cells in the culture is very large, two constitutively expressed genes, luxI and luxR, are excluded in the model for simplicity. The dynamics in each cell is described by the following system of ODEs of dimension 4N + 1, given by
for i = 1, …, N, and the dynamics of AHL in the culture is governed by
 |
where x̄1i and x̄e are the concentrations of AHL in the ith cell and culture, respectively; x̄2i and x̄3i are the concentrations of LacR that are expressed from the sensor plasmid and toggle switch plasmid, respectively; and x̄4i is the concentration of λ CI. In addition, ε1 and ε2 are associated with the copy numbers of the sensor plasmid and toggle switch plasmid, respectively. The synthesis rate b1 of AHL is a combination of the expression rate of the housekeeping gene luxI and the synthesis rate of AHL from LuxI. The expression of lacI in the sensor plasmid is activated by the AHL–LuxR dimer formed by two AHL and two LuxR proteins (37). The activated expression of LacR in the sensor plasmid is realized by a function with Hill coefficient n = 2. The expression of LacR and λ CI in the toggle switch plasmid follows the same equations as in the model discussed in the previous section. The expression of λ CI is negatively regulated by the total concentration of LacR (x̄2i + x̄3i) in each cell. In addition, the diffusion rates of AHL across the cell membrane are μ1 = δ/Vc and μ2 = δ/Vext. Here δ represents the membrane permease ability of AHL, Vc is the volume of a cell, and Vext is the total extracellular volume (38).
There is no switching in the deterministic setting (see Fig. 5A). To realize bimodal population distributions observed experimentally, we introduce Poisson random variables into the deterministic model
Fig. 5.
Simulations of the genetic toggle switch interfaced by the quorum-sensing signaling pathway. (A) A deterministic simulation with 3,080 cells. (B) A stochastic simulation of successful switching with 3,080 cells. (C) A stochastic simulation of unsuccessful switching with 3,080 cells. (D) Percentages of switched cells obtained by simulations or from a Hill function p(c) = 1.0232 × c5/(3,5605 + c5) × 100%, where c is the cell number and 1.0232 is used to ensure p(7,560) = 100%.
 |
 |
Here xji = xji(t) are molecular numbers, x̄e and x̄1i are concentrations, and k1 (= 500) and k2 (= 500·Vext/Vc) are factors for calculating molecular numbers from concentrations in cell and in culture, respectively. Note that the volume factor Vc/Vext should be considered when calculating the AHL concentration in the culture. Here the diffusion mechanism is based on the fact that AHL is freely diffusible across the cell membrane (39).
Kinetic rates are based on those in the model for the genetic toggle switch, namely b2 = b3 = b4 = 0.2 μM·min−1, β2 = β3 = 4 μM·min−1, d2 = d3 = 1 min−1, and K2 = K3 = 1 μM (11). In experiments, the copy numbers of the sensor, the toggle switch, and the reporter plasmids are low, medium, and high, respectively (11). It is assumed that the copy number of the sensor plasmid is half of that of the toggle switch plasmid. Thus, ε1 = 0.5 based on ε2 = 1. Because the expression of LacR from the sensor plasmid is determined by the values of ε1b2 and ε1β1, different assumptions on the value of ε1 will lead to different values of β1 to match experimental results. The AHL degradation rate in the cell and diffusion rate out of the cell are d1 = 1 min−1 and μ1 = 2 min−1 (37). There is a linear relationship between the absorbance at 600 nm (A600) and cell number in the culture (40). Cell numbers in the culture are very large based on the volume of culture (10 μl) in experiments (11). Here the cell numbers are assumed to be 840 and 7,560 when the values of A600 are 0.06 and 0.54, respectively, to reduce the computational time. The volume factor Vext/Vc = 3.5 × 10⁶ is calculated from the assumed cell numbers and the volume of E. coli (36). The AHL degradation rate de = 0.01 and synthesis rate b1 = 0.45 μM·min−1 are estimated from simulations so that the AHL concentrations in the culture are ≈20∼50 nM, which was indicated in the experiment of Strain B1 in ref. 11. In addition, β1 = 0.97 μM and K1 = 0.11 μM are estimated from simulations so that nearly all cells have low LacR expression levels when N = 840, and all cells have high LacR expression levels when N = 7560. The simulation time is 14 h [the growth time in experiment (11)], and the initial condition is (x1i, x2i, x3i, x4i, xe)|t=0 = (0, 0, 125, 2125, 0), which is similar to that in the first model.
Fig. 5A gives a deterministic simulation with 3,080 cells. The system stays at an intermediate state where both LacR and λ CI are constant. Fig. 5 B and C give two stochastic simulations with cell number N = 3,080 in the culture for successful and unsuccessful switching, respectively. In both simulations, the system shifts from the steady state with high λ CI expression level to an intermediate state because of the negative feedback from LacR that is expressed from the sensor plasmid. Intrinsic noise in the system then may switch the system from the intermediate state to the other steady state with low λ CI expression level. Fig. 5D gives the percentages of switched cells based on different cell numbers in the culture. These percentages can be approximated by a Hill function, and we can use a Hill coefficient of 5 to best fit the simulated percentages. We have used other parameter sets for b1, β1, and K1, and simulation results also predicted the ultrasensitive response for the genetic switching (data not shown).
The expression levels of LacR and λ CI are determined by the cell population density in the culture, and different cell population densities will determine different probabilities of genetic switching. Fig. 6gives experimental results that are derived from figure 6B in ref. 11 by using the software imagej and numerical bimodal distributions for the numbers of cells with different molecular numbers of LacR that is expressed from the genetic toggle switch with different cell population densities. Again, because the original experimental results are qualitative rather than quantitative, we can only give a qualitative comparison in Fig. 6 that indicates the simulation results are consistent with experimental results in terms of the percentages of switched cells. As before, the difference between the simulated bimodal distributions and experimental results may be due to the difference in cell numbers and some additional external noise factors.
Fig. 6.
Comparison of simulation results with experimental observations for the genetic toggle switch interfaced by the quorum-sensing signaling pathway. Numbers of cells with different molecular numbers of LacR are based on simulations with different cell population densities in the culture, and experimental observations in fluorescence signal are derived from figure 6B in ref. 11 using the top and right labels. (A) n = 840; only nine cells have high LacR expression levels, and A600 = 0.06. (B) n = 1,400; 68 cells have high LacR expression levels, and A600 = 0.10. (C) n = 3,080; 1,042 cells have high LacR expression levels, and A600 = 0.22. (D) n = 7,560; all cells have high LacR expression levels, and A600 = 0.54.
Supplementary Material
Acknowledgments
K.B. was supported by an Australian Research Council Federation Fellowship.
Abbreviations
- AHL
acyl-homoserine lactone
- MMC
mitomycin C
- ODE
ordinary differential equation.
Footnotes
Conflict of interest statement: No conflicts declared.
This paper was submitted directly (Track II) to the PNAS office.
References
- 1.Hasty J., McMillen D., Isaacs F., Collins J. J. Nat. Rev. Genet. 2001;2:268–279. doi: 10.1038/35066056. [DOI] [PubMed] [Google Scholar]
- 2.Kærn M., Elston T. C., Blake W. J., Collins J. J. Nat. Rev. Genet. 2005;6:451–464. doi: 10.1038/nrg1615. [DOI] [PubMed] [Google Scholar]
- 3.Smolen P., Baxter D. A., Byrne J. H. Neuron. 2000;26:567–580. doi: 10.1016/s0896-6273(00)81194-0. [DOI] [PubMed] [Google Scholar]
- 4.Ferrell J. E., Jr. Curr. Opin. Cell Biol. 2002;14:140–148. doi: 10.1016/s0955-0674(02)00314-9. [DOI] [PubMed] [Google Scholar]
- 5.Slepchenko B. M., Terasaki M. Curr. Opin. Genet. Dev. 2004;14:428–434. doi: 10.1016/j.gde.2004.05.001. [DOI] [PubMed] [Google Scholar]
- 6.Ptashne M. A Genetic Switch: Phage λ and Higher Organisms. Cambridge, MA: Cell; 1992. [Google Scholar]
- 7.McAdams H. H., Arkin A. Proc. Natl. Acad. Sci. USA. 1997;94:814–819. doi: 10.1073/pnas.94.3.814. [DOI] [PMC free article] [PubMed] [Google Scholar]
- 8.Arkin A., Ross J., McAdams H. H. Genetics. 1998;149:1633–1648. doi: 10.1093/genetics/149.4.1633. [DOI] [PMC free article] [PubMed] [Google Scholar]
- 9.Issacs F. J., Hasty J., Cantor C. R., Collins J. J. Proc. Natl. Acad. Sci. USA. 2003;100:7714–7719. doi: 10.1073/pnas.1332628100. [DOI] [PMC free article] [PubMed] [Google Scholar]
- 10.Gardner T. S., Cantor C. R., Collins J. J. Nature. 2000;403:339–342. doi: 10.1038/35002131. [DOI] [PubMed] [Google Scholar]
- 11.Kobayashi H., Kærn M., Araki M., Chung K., Gardner T. S., Cantor C. R., Collins J. J. Proc. Natl. Acad. Sci. USA. 2004;101:8414–8419. doi: 10.1073/pnas.0402940101. [DOI] [PMC free article] [PubMed] [Google Scholar]
- 12.Kramer B. P., Viretta A. U., El Baba M. D., Aubel D., Weber W., Fussenegger M. Nat. Genet. 2004;22:867–870. doi: 10.1038/nbt980. [DOI] [PubMed] [Google Scholar]
- 13.Novick A., Wiener M. Proc. Natl. Acad. Sci. USA. 1957;43:553–566. doi: 10.1073/pnas.43.7.553. [DOI] [PMC free article] [PubMed] [Google Scholar]
- 14.Vilar J. M. G., Guet C. C., Leibler S. J. Cell Biol. 2003;161:471–476. doi: 10.1083/jcb.200301125. [DOI] [PMC free article] [PubMed] [Google Scholar]
- 15.Ozbudak E. M., Thattai M., Lim H. N., Shraiman B. I., van Oudenaarden A. Nature. 2004;427:737–740. doi: 10.1038/nature02298. [DOI] [PubMed] [Google Scholar]
- 16.Xiong W., Ferrell J. E., Jr. Nature. 2003;426:460–464. doi: 10.1038/nature02089. [DOI] [PubMed] [Google Scholar]
- 17.Bagowski C. P, Ferrell J. E. Curr. Biol. 2001;11:1176–1182. doi: 10.1016/s0960-9822(01)00330-x. [DOI] [PubMed] [Google Scholar]
- 18.Harding A., Tian T., Westbury E., Frische E, Hancock J. F. Curr. Biol. 2005;15:869–873. doi: 10.1016/j.cub.2005.04.020. [DOI] [PubMed] [Google Scholar]
- 19.Markevich N. I., Hoek J. B., Kholodenko B. N. J. Cell Biol. 2004;164:353–359. doi: 10.1083/jcb.200308060. [DOI] [PMC free article] [PubMed] [Google Scholar]
- 20.Pomerening J. R., Sontag E. D., Ferrell J. E., Jr. Nat. Cell Biol. 2003;5:346–351. doi: 10.1038/ncb954. [DOI] [PubMed] [Google Scholar]
- 21.Hasty J., Pradines J., Dolnik M., Collins J. J. Proc. Natl. Acad. Sci. USA. 2000;97:2075–2080. doi: 10.1073/pnas.040411297. [DOI] [PMC free article] [PubMed] [Google Scholar]
- 22.Swain P. S., Elowitz M. B., Siggia E. D. Proc. Natl. Acad. Sci. USA. 2002;99:12795–12800. doi: 10.1073/pnas.162041399. [DOI] [PMC free article] [PubMed] [Google Scholar]
- 23.Barkai N., Leibler S. Nature. 1997;387:913–917. doi: 10.1038/43199. [DOI] [PubMed] [Google Scholar]
- 24.Gonze D., Halloy J., Goldbeter A. Proc. Natl. Acad. Sci. USA. 2002;99:673–678. doi: 10.1073/pnas.022628299. [DOI] [PMC free article] [PubMed] [Google Scholar]
- 25.Puchalka J., Kierzek A. M. Biophys. J. 2004;86:1357–1372. doi: 10.1016/S0006-3495(04)74207-1. [DOI] [PMC free article] [PubMed] [Google Scholar]
- 26.Tian T., Burrage K. J. Theor. Biol. 2004;227:229–237. doi: 10.1016/j.jtbi.2003.11.003. [DOI] [PubMed] [Google Scholar]
- 27.Thattai M., van Oudenaarden A. Proc. Natl. Acad. Sci. USA. 2001;98:8614–8619. doi: 10.1073/pnas.151588598. [DOI] [PMC free article] [PubMed] [Google Scholar]
- 28.Akutsu T., Miyano S., Kuhara S. Bioinformatics. 2000;16:727–734. doi: 10.1093/bioinformatics/16.8.727. [DOI] [PubMed] [Google Scholar]
- 29.Shmulevich I., Dougherty E. R., Kim S., Zhang W. Bioinformatics. 2002;18:261–274. doi: 10.1093/bioinformatics/18.2.261. [DOI] [PubMed] [Google Scholar]
- 30.Mao L., Resat H. Bioinformatics. 2004;20:2258–2269. doi: 10.1093/bioinformatics/bth236. [DOI] [PubMed] [Google Scholar]
- 31.Pedraza J. M., van Oudenaarden A. Science. 2005;307:1965–1969. doi: 10.1126/science.1109090. [DOI] [PubMed] [Google Scholar]
- 32.Gillespie D. T. J. Chem. Phys. 2001;115:1716–1733. [Google Scholar]
- 33.Gillespie D. T. J. Phys. Chem. 1977;81:2340–2361. [Google Scholar]
- 34.Rao C., Arkin A. J. Chem. Phys. 2003;118:4999–5010. [Google Scholar]
- 35.Tian T., Burrage K. J. Chem. Phys. 2004;121:10356–10364. doi: 10.1063/1.1810475. [DOI] [PubMed] [Google Scholar]
- 36.Santillán M, Mackey M. C. Biophys. J. 2004;86:1282–1292. doi: 10.1016/S0006-3495(04)74202-2. [DOI] [PMC free article] [PubMed] [Google Scholar]
- 37.Basu S., Mehreja R., Thiberge S., Chen M., Weiss R. Proc. Natl. Acad. Sci. USA. 2004;101:6355–6360. doi: 10.1073/pnas.0307571101. [DOI] [PMC free article] [PubMed] [Google Scholar]
- 38.Garcia-Ojalvo J., Elowitz M. B., Strogatz S. H. Proc. Natl. Acad. Sci. USA. 2004;101:10955–10960. doi: 10.1073/pnas.0307095101. [DOI] [PMC free article] [PubMed] [Google Scholar]
- 39.Miller M. B., Bassler B. L. Annu. Rev. Microbiol. 2001;55:165–199. doi: 10.1146/annurev.micro.55.1.165. [DOI] [PubMed] [Google Scholar]
- 40.Samuels D. S. In: Electroporation Protocols for Microorganisms. Nickoloff J. A., editor. Clifton, NJ: Humana; 1995. pp. 253–259. [Google Scholar]
Associated Data
This section collects any data citations, data availability statements, or supplementary materials included in this article.


