Abstract
Homology between p63 and p53 has suggested that these proteins might function similarly. However, the majority of data from human tumors have not supported a similar role for p63 in tumor suppression. To investigate this issue, we studied spontaneous tumorigenesis in p63+/− mice in both WT and p53-compromised backgrounds. We found that p63+/− mice were not tumor prone and mice heterozygous for both p63 and p53 had fewer tumors than p53+/− mice. The rare tumors that developed in mice with compromised p63 were also distinct from those of p53+/− mice. Furthermore, p63+/− mice were not prone to chemically induced tumorigenesis, and p63 expression was maintained in carcinomas. These findings demonstrate that, in agreement with data from human tumors, p63 plays a markedly different biological role in cancer than p53.
Keywords: mouse model, p53, tumor suppressor, cancer
The p63 protein is a member of the p53 family that includes p53, p63, and p73, which share extensive homology within the core DNA binding domain (DBD) (reviewed in ref. 1). A well established feature of p53 is that it is frequently lost or inactivated in a variety of human cancers (2). Although some evidence suggests that p63 may perform biological roles analogous to those of p53 (3, 4), p63 is rarely mutated, and p63 expression is often retained in human tumors (reviewed in ref. 5). Although mutations in human p63 have been identified, these mutations cause severe birth anomalies, and tumor susceptibility is not a typical feature of these syndromes (1). In contrast to p53's ubiquitous pattern of expression, p63 is most readily detectable in proliferating cells of stratified squamous epithelia such as the skin, the precursor cell type for the majority of human cancers. Interactions between p63 and p53 and subsequent degradation of p63 can occur when p53 contains tumor-derived missense mutations, suggesting that p63 could affect the tumor-suppressive capabilities of p53 (6). Thus, p63's role in modulating tumor-suppressive mechanisms in vivo has not been fully evaluated.
To investigate whether p63 functions as a tumor suppressor in the intact organism, we evaluated spontaneous and chemically induced tumorigenesis in mice with decreased levels of p63. In addition, spontaneous tumors were monitored in mice that had reduced levels of p63 in combination with compromised levels of p53 to assess whether combined p63 and p53 deficiency affects tumorigenesis in vivo.
Results
p63+/− Mice Are Not Predisposed to Spontaneous Tumors.
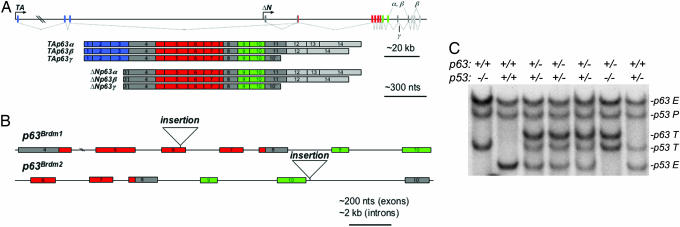
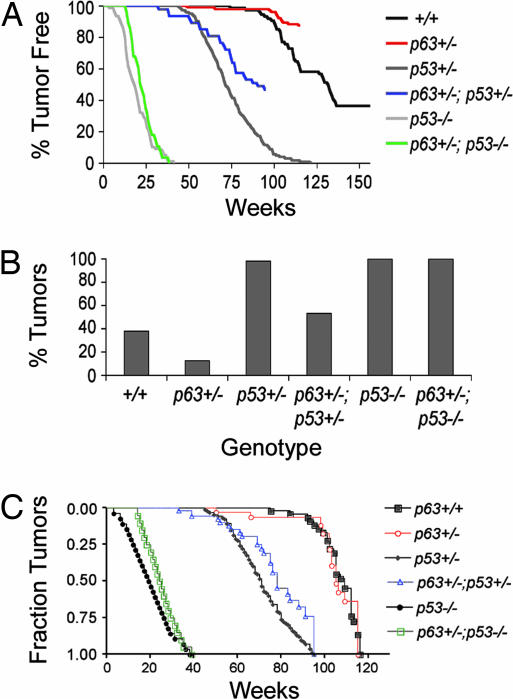
p53−/− and p53+/− mice are highly tumor-prone with the majority of mice developing spontaneous tumors by 10 months and 2 years, respectively (7, 8). To determine the impact of compromised p63 on tumorigenesis, we performed a spontaneous tumor study of 153 p63+/− mice and sibling controls for >2 years. Mice lacking p63 die shortly after birth (9, 10), and therefore the effect of germ-line deficiency of p63 in cancer could not be evaluated in p63−/− mice. We had previously disrupted the endogenous p63 locus and generated two distinct p63 null alleles, p63Brdm1 and p63Brdm2 (9) (Fig. 1A and B). While characterizing the endogenous p63 allele, we discovered that the previously reported genomic structure (4) was incorrect; the relative position of the exons (and hence the splicing pattern) was not accurately depicted (Fig. 1A). Because endogenous p63 transcripts were not detected in mice homozygous for either p63Brdm1 or p63Brdm2, both of these alleles are presumably functionally null and therefore deficient for all functional p63 isoforms. To avoid the possibility of founder effects, the p63+/− cohort was derived from three independently targeted embryonic stem cell clones. Mice were monitored for spontaneous tumors twice weekly, and those that had palpable lesions or were moribund were killed and subjected to macroscopic analysis. Detailed histopathology was performed on 104 p63+/− mice and 18 WT sibling controls. In addition, an archival tumor study of 56 WT control mice conducted in the same facility was included for reference. Details on the genetic background for these cohorts are shown in Table 2, which is published as supporting information on the PNAS web site. By the 115-week time point, only a small percentage (13%) of p63+/− mice developed tumors, significantly fewer than WT controls (38%) (P < 0.001) (Fig. 2A and B). At the end of the study, a total of 36 neoplasms were characterized from the WT cohort (n = 74). In contrast, only 13 neoplasms developed in 104 p63+/− mice. The tumor class, age of onset, body site affected, and the particular null p63 allele in the tumor-bearing p63+/− mice are shown in Table 3, which is published as supporting information on the PNAS web site. Neither p63Brdm1/+ nor p63Brdm2/+ mice developed the early tumors typical of p53+/− mice, although the majority of the p63+/− cohort consisted of mice heterozygous for the p63Brdm2 allele. Thus, mice with haploid levels of p63 are distinct from p53+/− mice; they are not predisposed to spontaneous tumors.
Fig. 1.
p63 mouse models. (A) Schematic diagram of p63 with exons (rectangles) encoding the transactivating domain (blue), DBD (red), oligomerization domain (green), and sterile α motif (light gray) (GenBank accession no. AF533892). In contrast to previous reports the last exon of the γ isoform, exon 10′ (previously referred to as exon 15) is located between exons 10 and 11, which is also the case for human p63 (data not shown). (B) Structure of the previously generated p63Brdm1 and p63Brdm2 null alleles is shown (9). (C) Genotyping by Southern blot analysis identifies endogenous (E) and targeted (T) alleles for both p63 and p53. P denotes the p53 pseudogene.
Fig. 2.
Spontaneous tumor incidence is reduced by p63 heterozygosity. (A) The percentage of tumor-free WT, p63+/−, p53+/−, p63+/−;p53+/−, p53−/−, and p63+/−;p53−/− mice is shown. (B) Tumor incidence at 115 weeks is dramatically reduced in mice haploid for p63. The numbers of mice subjected to detailed histopathology were: p63+/+, 74; p63+/−, 104; p53+/−, 225; p63+/−;p53+/−, 47; p53−/−, 78; and p63+/−;p53−/−, 28. (C) Tumor onset depicted by using the Kaplan–Meier format. Note that even though overall tumor onset of p63+/− and p63+/+ cohorts appears similar when nontumor deaths are excluded, p63+/− mice develop significantly fewer tumors than WT mice. In addition, tumor onset is significantly delayed in mice heterozygous for both p63 and p53 relative to p53+/− mice.
p63+/− Mice Develop Nonmalignant Pathology.
During the course of this tumor study, we found that p63+/− mice often developed nonmalignant pathology consistent with features of accelerated aging (11). Although this phenotype often suggested malignancy, the majority of p63+/− animals were free of tumors upon autopsy and histological analyses. Epithelial hyperplasia was frequently observed; however, these lesions did not progress to tumors. To account for nontumor-related deaths, Kaplan–Meier analysis was performed on the entire cohort, with censoring of animals that were tumor free (Fig. 2C). This analysis further shows that the rare tumors that develop in p63+/− mice do not have a significantly earlier onset than tumors in WT mice, and that these mice do not exhibit the high tumor incidence characteristic of p53+/− mice (7, 8). In addition to epithelial hyperplasia, reactive inflammatory disease affecting the spleen, salivary glands, lymph nodes, and liver was observed in 77% (n = 82) of the p63+/− mice. This pathology involved chronic inflammation and reactive hyperplasia of lymphoid tissues, including myeloid hyperplasia, plasma cell proliferation, and varying degrees of lymphoid atypia. Because of their unique pathology, these lesions could easily be misdiagnosed as lymphomas.
p63 Heterozygosity Decreases Tumor Incidence in p53+/− Mice.
To determine whether p63 heterozygosity could affect tumorigenesis in a p53-compromised background, cohorts of p63+/− mice in a p53+/− (n = 47) or p53−/− (n = 28) background and p53-compromised sibling controls (n = 14) were generated (Fig. 1C) and monitored for spontaneous tumors. Archival tumor data from p53+/− (n = 217) and p53−/− (n = 72) mice conducted in the same facility were included for reference. For genetic background see Table 2. A comparison of tumor incidence of p63+/− mice with both the p53+/− and p63+/−;p53+/− cohorts was statistically significant (P < 0.001 and 0.01, respectively) (Fig. 2 A and B). At 72 weeks, ≈50% of the p53+/− cohort had developed tumors, but <2% of p63+/− mice and only 28% of p63+/−;p53+/− mice had developed tumors at the same time point. Using Kaplan–Meier analysis to factor in nontumor-related deaths, the difference between p63+/− or p63+/−;p53+/− and the p53+/− cohorts was significantly different (P < 0.0001 and 0.0009 respectively). These data indicate that combined p63 and p53 deficiency does not exacerbate tumor incidence; instead it appears that p63 heterozygosity reduces tumorigenesis in mice with compromised levels of p53.
The Tumor Spectrum of p63+/− Mice Is Distinct from That of p53 Compromised Mice.
The most common tumor types in p53+/− and p53−/− mice are sarcoma and lymphoma, respectively (7, 8). To investigate whether p63 deficiency would generate similar types of tumors, we analyzed the tumor spectrum in mice of different genotypes (Table 1). WT mice developed lymphomas most frequently; from 36 of the characterized neoplasms, 67% were lymphomas (n = 24), 14% were sarcomas (n = 5), and 19% were carcinomas (n = 7). In the 13 neoplasms that developed in p63+/− mice, 39% were lymphomas (n = 5), 15% were sarcomas (n = 2), and 39% were carcinomas (n = 5). When taken as a percentage of the total cohort, all tumor types occurred less frequently in p63+/− mice relative to WT controls (Table 1). Consistent with previous reports, we found sarcomas and lymphomas in the majority of p53+/− (59%) and p53−/− (64%) mice, respectively. However, mice with combined p63 and p53 deficiency developed a distinct spectrum of tumors. In the p63+/−;p53+/− cohort there were 19% lymphomas (n = 5), 63% sarcomas (n = 17), and 19% carcinomas (n = 5). In contrast to the predominance of lymphomas characteristic of p53−/− mice, sarcomas were most frequent in p63+/−;p53−/− mice; of 32 neoplasms, 44% were lymphomas (n = 14) and 56% were sarcomas (n = 18). Carcinomas were not observed in the p63+/−;p53−/− cohort, a result consistent with the low percentage (1%) of carcinomas in p53−/− mice. Thus, not only was there a decrease in the total number of malignancies that developed in p63+/− mice, the tumor spectrum was distinct from p53-deficient mice.
Table 1.
Spontaneous tumor spectra in mice with compromised p63 in WT and p53-deficient backgrounds
| Genotype | Tumor type | |||||||||||
|---|---|---|---|---|---|---|---|---|---|---|---|---|
| Lymphomas | Sarcomas | Carcinomas | Other | |||||||||
| No. of tumors | % of total tumors | % of total cohort | No. of tumors | % of total tumors | % of total cohort | No. of tumors | % of total tumors | % of total cohort | No. of tumors | % of total tumors | % of total cohort | |
| +/+* | 24 | 67 | 32 | 5 | 14 | 7 | 7 | 19 | 10 | 0 | 0 | 0 |
| p63+/− | 5 | 39 | 5 | 2 | 15 | 2 | 5 | 39 | 5 | 1 | 8 | 1 |
| p53+/−† | 28 | 30 | 12 | 55 | 59 | 24 | 7 | 8 | 3 | 3 | 3 | 1 |
| p63+/−; p53+/− | 5 | 19 | 11 | 17 | 63 | 36 | 5 | 19 | 11 | 0 | 0 | 0 |
| p53−/−‡ | 61 | 64 | 78 | 27 | 28 | 35 | 1 | 1 | 1 | 7 | 7 | 9 |
| p63+/−; p53−/−‡ | 14 | 44 | 50 | 18 | 56 | 64 | 0 | 0 | 0 | 0 | 0 | 0 |
Tumors Arising in p63+/− Mice Are Distinct from Those of p53 Compromised Mice.
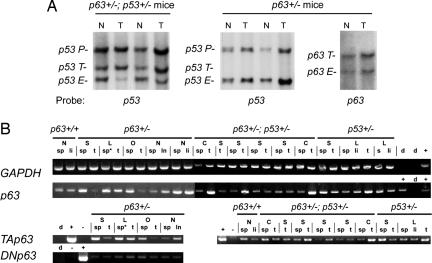
A frequent event in tumors that develop in p53+/− mice is loss of the WT p53 allele (12). To determine whether loss of p63 or p53 contributed to tumorigenesis, we evaluated tumors for loss of heterozygosity (LOH) at the p63 and p53 loci. A total of 12 lesions were analyzed for LOH at the p63 locus (3 tumors plus 2 reactive inflammatory lesions from p63+/− mice, and 7 p63+/−;p53+/− tumors); 13 tumors were analyzed for LOH at the p53 locus (2 p53+/− tumors and 11 p63+/−;p53+/− tumors). Loss of the endogenous p53 locus was observed in ≈50% of the tumors obtained from p53+/− mice (data not shown), an observation consistent with results of previous studies. Similarly, the WT p53 allele was lost in ≈50% (5/11) of the tumors from p63+/−;p53+/− mice. However, the p53 locus was retained in tumors that arose in p63+/− mice, and loss of the endogenous p63 locus was not observed in the tumors obtained from either p63+/− or p63+/−;p53+/− mice (Fig. 3A and data not shown). RT-PCR analysis indicated that tumors from p63+/− mice maintained expression of TAp63 and ΔNp63 isoforms (Fig. 3B). At the protein level, p63 was most readily detected in carcinomas, an observation consistent with p63's well documented expression in stratified epithelia (Fig. 7, which is published as supporting information on the PNAS web site). Thus, loss or inactivation of the WT p63 allele does not appear to accompany tumorigenesis in p63+/− mice, in striking contrast with loss of the WT p53 locus in tumors of p53+/− mice.
Fig. 3.
Tumors from p63 mice do not exhibit LOH and retain expression of p63. (A) LOH analysis indicates that the p53 locus is frequently lost in tumors of p63+/−;p53+/− mice, whereas both p63 and p53 WT alleles are retained in tumors of p63+/− mice. Endogenous (E) and targeted (T) alleles for both p63 and p53 are shown. P denotes the p53 pseudogene. (B) Tumors were analyzed for expression of GAPDH and p63 by RT-PCR using primers common to all p63 transcripts. In addition, transcripts encoding TAp63 and ΔNp63 isoforms were detectable in all tumors analyzed. N, nonneoplastic; S, sarcoma; L, lymphoma; C, carcinoma; O, other. Controls: d, water; +, positive control (cDNA library was used for GAPDH and p63; plasmids containing cDNAs for either TAp63 or ΔNp63 isoforms were used as positive controls for specific transcript classes); −, negative controls (plasmids containing cDNA encoding the opposite p63 isoform). Total RNA was prepared from: sp, spleen; li, liver; t, tumor; ln, lymph node; ∗ indicates malignancy.
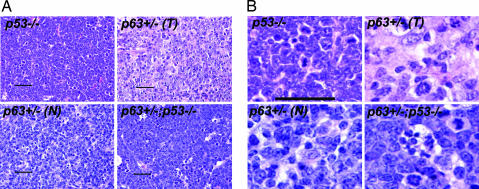
We next examined the histopathology of tumors arising in p63+/− mice to compare those tumors with p53-deficient tumors. Because lymphomas developed spontaneously in mice of each genotype (although only five lymphomas were found in the p63+/− cohort) we focused on them. Three of five lymphomas from the p63+/− cohort had pathology similar to the high-grade large cell lymphomas characteristic of p53-deficient mice (Table 3); two lesions were of lower grade, bordering on the atypical lymphoid hyperplasia seen in many (77%) of the p63+/− mice (Fig. 4). This analysis revealed that a subset of tumors in p63+/− mice had a distinct pathology, in clear contrast to the unambiguous pathology of malignant lymphomas obliterating the p53-deficient splenic or nodal tissue.
Fig. 4.
Histopathology of lymphomas. Tumors of p53-compromised mice have marked cytological atypia and a high mitotic rate, similar to some lymphomas (T) from p63+/− mice; other lesions were nonneoplastic (N) lymphoid proliferations. Lymphomas that developed in p63+/−;p53+/− mice had a large number of mitotic figures and apoptotic cells. (Scale bar: 100 μm.)
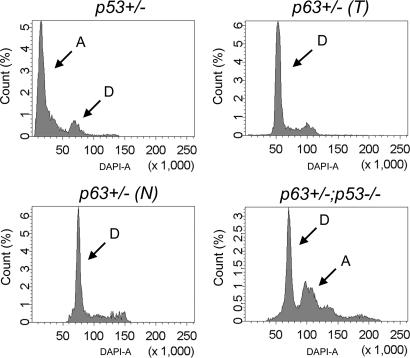
As genomic instability is a common feature of tumors from p53+/− and p53−/− mice (12), we used flow cytometry to assay for genomic instability in lymphomas in p63+/− mice. Whereas the genomes of tumors from p53+/− and p53−/− mice were often aneuploid (Fig. 5 and data not shown), genomic instability was not detected in malignant lymphomas from p63+/− mice, even in tumors with histopathology most closely resembling that of the high-grade tumors of p53+/− mice; these cells appeared diploid, as did the nonneoplastic lesions from p63+/− mice. Thus, tumors from p63+/− mice do not have the same degree of genomic instability as those developing in p53+/− mice. In contrast with the diploid nature of p63+/− lymphomas, those obtained from p63+/−;p53+/− and p63+/−;p53−/− mice had detectable genomic instability (data not shown and Fig. 5), consistent with the large number of mitotic figures observed histologically (see Fig. 4).
Fig. 5.
Genomic instability is not increased in lymphomas of p63-compromised mice. Flow cytometry indicates that p53+/− tumors are aneuploid (A), whereas both tumors (T) and nonneoplastic lesions (N) from p63+/− mice are diploid (D). In contrast, tumors from p63+/−;p53−/− mice are aneuploid.
p63+/− Mice Are Not Susceptible to Chemical Carcinogenesis.
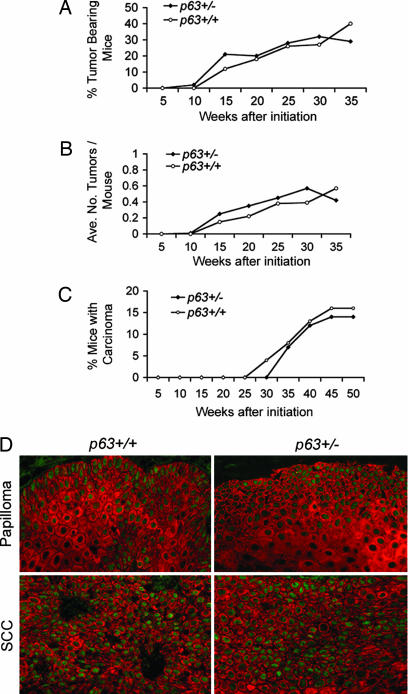
We next examined whether the well established two-stage chemical carcinogenesis protocol (13) would enhance tumorigenesis in p63+/− mice. This treatment causes benign papillomas in normal mouse skin and a proportion of these progress to squamous cell carcinoma (SCC). In a blinded study, a cohort of 38 p63Brdm2/+ mice and 29 p63+/+ sibling controls were treated with dimethylbenz[a]anthracene/tetradecanoyl-phorbol-13-acetate and monitored weekly for tumor formation, size, and number. The first tumors in this model appeared at 10 and 12 weeks after initiation for p63+/− and p63+/+ cohorts, respectively. The percentage of p63+/− mice developing tumors was approximately the same as that of the WT cohort (P = 0.19) (Fig. 6A). The average number of tumors per mouse was not statistically different between p63+/− and p63+/+ mice over the course of the study (Fig. 6B; P = 0.46). The tumors were monitored weekly for signs of malignant conversion. In contrast to p53+/− mice that had been exposed to the two-stage chemical carcinogenesis protocol (14), tumors of p63+/− mice did not undergo malignant conversion at an accelerated rate relative to WT controls (Fig. 6C; P = 0.07). These data indicate that p63+/− mice are no more susceptible than WT mice to chemically induced skin tumors.
Fig. 6.
p63+/− mice are not predisposed to chemically induced skin tumors. p63+/+ and p63+/− mice treated with dimethylbenz[a]anthracene/tetradecanoyl-phorbol-13-acetate were monitored for tumorigenesis. (A–C) The percentage of tumor-bearing mice (A), average number of tumors per mouse (B), and percentage of mice with carcinomas (C) indicate that p63+/− mice are not predisposed to skin tumors. (D) Papillomas and SCCs retain p63 expression, indicating that p63 does not function as a tumor suppressor in this setting. Shown is expression of K14 (red) and p63 (green).
Given the robust expression of p63 in the skin, we evaluated whether p63 expression is maintained in skin tumors. Sections from papillomas and SCCs that developed in p63+/+ and p63+/− mice were immunofluorescently costained for keratin 14 and p63. Papillomas from WT and p63+/− mice expressed p63 in a similar nuclear pattern, and even papillomas that converted to malignant SCC maintained robust levels of p63. Thus, loss of p63 does not accompany tumorigenesis, even in tissues that normally express high levels of endogenous p63.
Discussion
As p53 is the most frequently mutated gene in human cancer (2) the discovery of the two related proteins, p63 and p73, led to speculation that these proteins would function similarly in tumor suppression. However, most studies have not supported a similar mechanism for p63 loss or inactivation, and p63 mutations have been reported in only a few cancers (refs. 15–18 and reviewed in ref. 5). In fact, robust expression of p63 or amplification of the p63 locus is common in many epithelial tumors (19–34). Although missense mutations in human p63 that correlate with hot-spot mutations in p53 have been identified, these mutations cause developmental syndromes, rather than a predisposition to cancer (reviewed in ref. 1).
In this study, we sought to explore the physiological role of p63 in spontaneous cancer development. While investigating the hypothesis that p63 might function as a tumor suppressor, we found that p63 heterozygosity does not accelerate tumorigenesis, even when p53 is compromised. At the end of an extensive tumor study, the percentage of p63+/− mice bearing tumors was reduced ≈3-fold compared with WT mice. Similarly, overall tumor incidence was reduced nearly 2-fold when a single p63 heterozygous null allele was placed in the context of a tumor-prone p53-compromised background. So, p63 deficiency does not appear to enhance cancer risk in the context of the whole organism, at least when p63 heterozygosity is the initiating genetic event. Conversely, p63 deficiency may even confer tumor protection. To take this one step further, we investigated whether a well characterized chemical carcinogenic insult might uncover a tumor predisposition in p63+/− mice that was not evident from evaluation of spontaneous tumorigenesis. Although previous reports demonstrate that p53-compromised mice are particularly prone to conversion to malignant SCC in response to this two-stage chemical carcinogenesis protocol (14), we found that p63+/− mice were no more susceptible to this treatment than were their WT sibling controls. In addition, robust expression of p63 is retained in both premalignant papillomas and SCC's of p63+/− mice, indicating that p63 does not function as a tumor suppressor in the skin.
The lack of spontaneous tumors in p63+/− mice is in agreement with the role of p63 in physiological settings. Much of our understanding of p63 comes from loss-of-function studies that highlight an embryological role for p63 in orchestrating the morphogenesis of stratified epithelia (9, 10). More recent work emphasizes p63's role in both cell fate determination in the embryo and maintaining proliferative potential in mature skin (11, 35, 36). A current view of p63 function and an emerging list of downstream targets implicate p63 as a positive regulator of cell proliferation and cell fate, consistent with a proposed oncogenic role in human cancers (37, 38). Thus, depending on tumor type and the initiating lesion, compromised levels of p63 may offset the balance of cell-cycle promoters and inhibitors, which translates to a tumor-suppressive effect in vivo.
Recently, an independent analysis of the role of p63 in spontaneous tumorigenesis concluded that p63 functions as a tumor suppressor (39). Although our results support the opposite conclusion, it should be noted that distinct p63 models were used in these two studies. In any of these p63 models, it is formally possible that partially functional p63 proteins endowed with a gain-of-function, dominant-negative, or even hypomorphic function are expressed. Perhaps the original differences in the phenotypes of p63-deficient mice (40) can be explained by the distinct p63 alleles that were generated by different laboratories. Our study used mice heterozygous for p63 alleles that disrupt all p63 isoforms; therefore, we cannot exclude the possibility that individual p63 proteins may function in tumor suppression, or that p63 could even have a tumor-suppressive role in certain cellular contexts or in cooperation with particular oncogenes [e.g., E1A (41)]. Nonetheless, it should be noted that in addition to the two models used in this current study, we have not detected tumors in mice heterozygous for p63Brdm3 (a third allele with a deletion of the DBD) (42), or when p63 is ablated specifically within stratified epithelia (11). In addition, these data are in agreement with an independent study of a defined experimental setting concluding that heterozygosity for the p63Brdm2 allele in both WT and p53-compromised backgrounds are not susceptible to γ irradiation-induced lymphomagenesis (43). The lack of tumors in p63+/− mice is consistent with a large number of studies of human cancers and in vivo data indicating that p63 deficiency plays a key role in modulating tumor suppressive mechanisms such as senescence (11), highlighting a unique role for p63 in tumorigenesis.
Experimental Procedures
Mouse Strains.
p63Brdm1 and p63Brdm2 mice (9) were generated in a mixed C57BL/6J × 129S5 genetic background (see Table 2); p63Brdm2 mice were crossed to the p53+/− mice (7). Southern blot analysis of BamHI-digested DNA with a 3.7-kb EcoRI probe was used to identify p63 alleles; p53 alleles were identified by using a p53 cDNA as described (7). LOH analysis was performed by using the same strategy used for genotyping, except that loss of the WT p63 allele was assessed by Southern blot analysis of HpaI-digested genomic DNA.
Spontaneous Tumor Study.
A cohort of 331 mice [p63+/− (n = 153), p63+/−;p53+/− (n = 64), p63+/−;p53−/− (n = 51), p53+/− (n = 10), p53−/− (n = 21), and p53+/+ (n = 32)] was monitored for tumors twice weekly for >2.2 years. Tumor data from 345 mice (WT, p53+/−, and p53−/− mice) from an archival study conducted in the same facility were included for reference. Mice that were moribund, developed severe skin lesions, or had palpable lesions were killed and subjected to necroscopy. Statistical analysis, shown in Fig. 2A, was performed with one-way ANOVA with Tukey's multiple comparison test. Data in Fig. 2C were plotted by using the Kaplan–Meier format with log-rank statistical analysis.
Chemical Carcinogenesis.
Mice were shaved 2 days before initial treatment at 8 weeks of age and as needed throughout the study. The carcinogen dimethylbenz[a]anthracene (DMBA; Sigma) was applied at a single subcarcinogenic dose of 50 μg in 100 μl of acetone per mouse. The tumor promoter, tetradecanoyl-phorbol-13-acetate (Sigma), was applied beginning 1 week after initiation with DMBA, 5 μg in 100 μl of acetone per mouse, once a week for 25 weeks. Mice were monitored weekly for tumor formation, size, and number.
Histology.
Histological analysis of multiple tissues was performed on a total of 211 mice. Tissues were fixed in 10% buffered formalin, dehydrated, embedded in paraffin, and sectioned at 5-μm thickness. Paraffin was removed, and the sections were rehydrated, stained in hematoxylin, counterstained in eosin, and dehydrated in an ethanol series ending in xylene. Pathology was assessed by H.V.
Immunofluorescence and Western Blotting.
For Western blotting, protein samples were prepared in Laemmli buffer, and protein concentration was determined by Bradford protein assay (Bio-Rad). Thirty micrograms of protein was loaded in each lane. p63 was detected by using the 4A4 anti-p63 antibody (1:800; Santa Cruz Biotechnology), and the same blot was reprobed with actin (anti-β-actin, Sigma; 1:10,000). Tumor sections were subjected to immunofluorescent analysis using the 4A4 anti-p63 antibody (1:500; a gift from Frank McKeon, Harvard Medical School, Boston) and guinea pig anti-K14 (44) antibodies. Primary antibodies were detected by using Alexa-conjugated fluorochromes 594 goat anti-guinea pig and 488 goat anti-mouse (Molecular Probes).
RT-PCR.
Total RNA was isolated from frozen tumors by using Trizol reagent (Invitrogen) and a Tissue-Tek homogenizer (Brinkman). RT-PCR was performed on 0.5 μg of total RNA by using a Superscript first-strand cDNA synthesis kit (Invitrogen), and cDNA was amplified by PCR using the following primers: GAPDH1, 5′-AAGGTCGGTGTGAACGGATT-3′; GAPDH2, 5′-TGGTGGTGCAGGATGCATTG-3′; p63ΔN-1, 5′-TTGTACCTGGAAAACAATG-3′; p63ΔN-2, 5′-GCATCGTTTCACAACCTCG-3′; p63TA-1, 5′-AACCCCAGCTCATTTCTC-3′; p63TA-2, 5′- GGCCCGGGTAATCTGTGTTGG-3′; p63DBD-1, 5′-ATGGACCAGCAGATTCAGAACGG-3′; and p63DBD-2, 5′-GCATCGTTTCACAACCTCG-3′. PCR was performed with a MasterCycler gradient thermocycler (Eppendorf). Reaction products were resolved on a 4% agarose gel.
DNA Content Analysis.
Sections of 50 μm were cut from each tumor, paraffin was removed in xylene, and tissues were rehydrated in an ethanol series. After overnight incubation in 100 μg/ml RNaseA in PBS, nuclei were treated with 5 mg/ml trypsin for 3 h and washed in 70% ethanol. The isolated nuclei were stained with 0.5 μg/ml DAPI for 30 min. To determine the diploid cell population within each tumor sample, cycling mouse embryonic fibroblasts (MEFs) were used as an internal control. Samples were analyzed on the BD LSRII cell analyzer (BD Biosystems) before and after addition of paraformaldehyde-fixed MEFs, and data were analyzed by facs diva software (BD Biosystems).
Supplementary Material
Acknowledgments
We thank Alex Gann for critical reading of the manuscript, Larry Donehower for archival tumor data, Mike Hemann and Allan Balmain for helpful discussions, and Ying Wu for technical assistance. This work was supported by National Institutes of Health Grants CA52607 and CA105491 (to D.R.R.) and National Institutes of Health Grant AR47898 (to A.A.M. and D.R.R.).
Abbreviations
- DBD
DNA binding domain
- LOH
loss of heterozygosity
- SCC
squamous cell carcinoma.
Footnotes
Conflict of interest statement: No conflicts declared.
Data deposition: The sequence reported in this paper has been deposited in the GenBank database (accession no. AF533892).
References
- 1.Murray-Zmijewski F., Lane D. P., Bourdon J. C. Cell Death Differ. 2006 doi: 10.1038/sj.cdd.4401914. in press. [DOI] [PubMed] [Google Scholar]
- 2.Hollstein M., Sidransky D., Vogelstein B., Harris C. C. Science. 1991;253:49–53. doi: 10.1126/science.1905840. [DOI] [PubMed] [Google Scholar]
- 3.Wu G., Nomoto S., Hoque M. O., Dracheva T., Osada M., Lee C. C., Dong S. M., Guo Z., Benoit N., Cohen Y., et al. Cancer Res. 2003;63:2351–2357. [PubMed] [Google Scholar]
- 4.Yang A., Kaghad M., Wang Y., Gillett E., Fleming M. D., Dotsch V., Andrews N. C., Caput D., McKeon F. Mol. Cell. 1998;2:305–316. doi: 10.1016/s1097-2765(00)80275-0. [DOI] [PubMed] [Google Scholar]
- 5.Moll U. M., Slade N. Mol. Cancer Res. 2004;2:371–386. [PubMed] [Google Scholar]
- 6.Gaiddon C., Lokshin M., Ahn J., Zhang T., Prives C. Mol. Cell Biol. 2001;21:1874–1887. doi: 10.1128/MCB.21.5.1874-1887.2001. [DOI] [PMC free article] [PubMed] [Google Scholar]
- 7.Donehower L. A., Harvey M., Slagle B. L., McArthur M. J., Montgomery C. A., Jr., Butel J. S., Bradley A. Nature. 1992;356:215–221. doi: 10.1038/356215a0. [DOI] [PubMed] [Google Scholar]
- 8.Jacks T., Remington L., Williams B. O., Schmitt E. M., Halachmi S., Bronson R. T., Weinberg R. A. Curr. Biol. 1994;4:1–7. doi: 10.1016/s0960-9822(00)00002-6. [DOI] [PubMed] [Google Scholar]
- 9.Mills A. A., Zheng B., Wang X. J., Vogel H., Roop D. R., Bradley A. Nature. 1999;398:708–713. doi: 10.1038/19531. [DOI] [PubMed] [Google Scholar]
- 10.Yang A., Schweitzer R., Sun D., Kaghad M., Walker N., Bronson R. T., Tabin C., Sharpe A., Caput D., Crum C., McKeon F. Nature. 1999;398:714–718. doi: 10.1038/19539. [DOI] [PubMed] [Google Scholar]
- 11.Keyes W. M., Wu Y., Vogel H., Guo X., Lowe S. W., Mills A. A. Genes Dev. 2005;19:1986–1999. doi: 10.1101/gad.342305. [DOI] [PMC free article] [PubMed] [Google Scholar]
- 12.Venkatachalam S., Shi Y. P., Jones S. N., Vogel H., Bradley A., Pinkel D., Donehower L. A. EMBO J. 1998;17:4657–4667. doi: 10.1093/emboj/17.16.4657. [DOI] [PMC free article] [PubMed] [Google Scholar]
- 13.DiGiovanni J. Pharmacol. Ther. 1992;54:63–128. doi: 10.1016/0163-7258(92)90051-z. [DOI] [PubMed] [Google Scholar]
- 14.Kemp C. J., Donehower L. A., Bradley A., Balmain A. Cell. 1993;74:813–822. doi: 10.1016/0092-8674(93)90461-x. [DOI] [PubMed] [Google Scholar]
- 15.Osada M., Ohba M., Kawahara C., Ishioka C., Kanamaru R., Katoh I., Ikawa Y., Nimura Y., Nakagawara A., Obinata M., Ikawa S. Nat. Med. 1998;4:839–843. doi: 10.1038/nm0798-839. [DOI] [PubMed] [Google Scholar]
- 16.Ikawa S., Nakagawara A., Ikawa Y. Cell Death Differ. 1999;6:1154–1161. doi: 10.1038/sj.cdd.4400631. [DOI] [PubMed] [Google Scholar]
- 17.Nishi H., Isaka K., Sagawa Y., Usuda S., Fujito A., Ito H., Senoo M., Kato H., Takayama M. Int. J. Oncol. 1999;15:1149–1153. doi: 10.3892/ijo.15.6.1149. [DOI] [PubMed] [Google Scholar]
- 18.Sunahara M., Shishikura T., Takahashi M., Todo S., Yamamoto N., Kimura H., Kato S., Ishioka C., Ikawa S., Ikawa Y., Nakagawara A. Oncogene. 1999;18:3761–3765. doi: 10.1038/sj.onc.1202972. [DOI] [PubMed] [Google Scholar]
- 19.Crook T., Nicholls J. M., Brooks L., O'Nions J., Allday M. J. Oncogene. 2000;19:3439–3444. doi: 10.1038/sj.onc.1203656. [DOI] [PubMed] [Google Scholar]
- 20.Hibi K., Trink B., Patturajan M., Westra W. H., Caballero O. L., Hill D. E., Ratovitski E. A., Jen J., Sidransky D. Proc. Natl. Acad. Sci. USA. 2000;97:5462–5467. doi: 10.1073/pnas.97.10.5462. [DOI] [PMC free article] [PubMed] [Google Scholar]
- 21.Yamaguchi K., Wu L., Caballero O. L., Hibi K., Trink B., Resto V., Cairns P., Okami K., Koch W. M., Sidransky D., Jen J. Int. J. Cancer. 2000;86:684–689. doi: 10.1002/(sici)1097-0215(20000601)86:5<684::aid-ijc13>3.0.co;2-m. [DOI] [PubMed] [Google Scholar]
- 22.Ito Y., Takeda T., Wakasa K., Tsujimoto M., Sakon M., Matsuura N. Int. J. Mol. Med. 2001;8:67–71. doi: 10.3892/ijmm.8.1.67. [DOI] [PubMed] [Google Scholar]
- 23.Quade B. J., Yang A., Wang Y., Sun D., Park J., Sheets E. E., Cviko A., Federschneider J. M., Peters R., McKeon F. D., Crum C. P. Gynecol. Oncol. 2001;80:24–29. doi: 10.1006/gyno.2000.5953. [DOI] [PubMed] [Google Scholar]
- 24.Wang T. Y., Chen B. F., Yang Y. C., Chen H., Wang Y., Cviko A., Quade B. J., Sun D., Yang A., McKeon F. D., Crum C. P. Hum. Pathol. 2001;32:479–486. doi: 10.1053/hupa.2001.24324. [DOI] [PubMed] [Google Scholar]
- 25.Choi H. R., Batsakis J. G., Zhan F., Sturgis E., Luna M. A., El-Naggar A. K. Hum. Pathol. 2002;33:158–164. doi: 10.1053/hupa.2002.30722. [DOI] [PubMed] [Google Scholar]
- 26.Di Como C. J., Urist M. J., Babayan I., Drobnjak M., Hedvat C. V., Teruya-Feldstein J., Pohar K., Hoos A., Cordon-Cardo C. Clin. Cancer Res. 2002;8:494–501. [PubMed] [Google Scholar]
- 27.Reis-Filho J. S., Torio B., Albergaria A., Schmitt F. C. J. Cutan. Pathol. 2002;29:517–523. doi: 10.1034/j.1600-0560.2002.290902.x. [DOI] [PubMed] [Google Scholar]
- 28.Hu H., Xia S. H., Li A. D., Xu X., Cai Y., Han Y. L., Wei F., Chen B. S., Huang X. P., Han Y. S., et al. Int. J. Cancer. 2002;102:580–583. doi: 10.1002/ijc.10739. [DOI] [PubMed] [Google Scholar]
- 29.Patturajan M., Nomoto S., Sommer M., Fomenkov A., Hibi K., Zangen R., Poliak N., Califano J., Trink B., Ratovitski E., Sidransky D. Cancer Cell. 2002;1:369–379. doi: 10.1016/s1535-6108(02)00057-0. [DOI] [PubMed] [Google Scholar]
- 30.Wang B. Y., Gil J., Kaufman D., Gan L., Kohtz D. S., Burstein D. E. Hum. Pathol. 2002;33:921–926. doi: 10.1053/hupa.2002.126878. [DOI] [PubMed] [Google Scholar]
- 31.Massion P. P., Taflan P. M., Jamshedur Rahman S. M., Yildiz P., Shyr Y., Edgerton M. E., Westfall M. D., Roberts J. R., Pietenpol J. A., Carbone D. P., Gonzalez A. L. Cancer Res. 2003;63:7113–7121. [PubMed] [Google Scholar]
- 32.Reis-Filho J. S., Simpson P. T., Martins A., Preto A., Gartner F., Schmitt F. C. Virchows Arch. 2003;443:122–132. doi: 10.1007/s00428-003-0859-2. [DOI] [PubMed] [Google Scholar]
- 33.Pruneri G., Fabris S., Dell'Orto P., Biasi M. O., Valentini S., Del Curto B., Laszlo D., Cattaneo L., Fasani R., Rossini L., et al. J. Pathol. 2005;206:337–345. doi: 10.1002/path.1787. [DOI] [PubMed] [Google Scholar]
- 34.Tonon G., Wong K. K., Maulik G., Brennan C., Feng B., Zhang Y., Khatry D. B., Protopopov A., You M. J., Aguirre A. J., et al. Proc. Natl. Acad. Sci. USA. 2005;102:9625–9630. doi: 10.1073/pnas.0504126102. [DOI] [PMC free article] [PubMed] [Google Scholar]
- 35.Koster M. I., Kim S., Mills A. A., DeMayo F. J., Roop D. R. Genes Dev. 2004;18:126–131. doi: 10.1101/gad.1165104. [DOI] [PMC free article] [PubMed] [Google Scholar]
- 36.Kurita T., Mills A. A., Cunha G. R. Development (Cambridge, U.K.) 2004;131:1639–1649. doi: 10.1242/dev.01038. [DOI] [PubMed] [Google Scholar]
- 37.Keyes W. M., Mills A. A. Cell Cycle. 2006;5:260–265. doi: 10.4161/cc.5.3.2415. [DOI] [PubMed] [Google Scholar]
- 38.Koster M. I., Lu S. L., White L. D., Wang X. J., Roop D. R. Cancer Res. 2006;66:3981–3986. doi: 10.1158/0008-5472.CAN-06-0027. [DOI] [PubMed] [Google Scholar]
- 39.Flores E. R., Sengupta S., Miller J. B., Newman J. J., Bronson R., Crowley D., Yang A., McKeon F., Jacks T. Cancer Cell. 2005;7:363–373. doi: 10.1016/j.ccr.2005.02.019. [DOI] [PubMed] [Google Scholar]
- 40.McKeon F. Genes Dev. 2004;18:465–469. doi: 10.1101/gad.1190504. [DOI] [PubMed] [Google Scholar]
- 41.Flores E. R., Tsai K. Y., Crowley D., Sengupta S., Yang A., McKeon F., Jacks T. Nature. 2002;416:560–564. doi: 10.1038/416560a. [DOI] [PubMed] [Google Scholar]
- 42.Mills A. A., Qi Y., Bradley A. Genesis. 2002;32:138–141. doi: 10.1002/gene.10067. [DOI] [PubMed] [Google Scholar]
- 43.Perez-Losada J., Wu D., DelRosario R., Balmain A., Mao J. H. Oncogene. 2005;24:5521–5524. doi: 10.1038/sj.onc.1208799. [DOI] [PubMed] [Google Scholar]
- 44.Yuspa S. H., Kilkenny A. E., Steinert P. M., Roop D. R. J. Cell Biol. 1989;109:1207–1217. doi: 10.1083/jcb.109.3.1207. [DOI] [PMC free article] [PubMed] [Google Scholar]
Associated Data
This section collects any data citations, data availability statements, or supplementary materials included in this article.


