Abstract
The underlying causes of late-Holocene climate variability in the tropics are incompletely understood. Here we report a 1,500-year reconstruction of climate history and glaciation in the Venezuelan Andes using lake sediments. Four glacial advances occurred between anno Domini (A.D.) 1250 and 1810, coincident with solar-activity minima. Temperature declines of −3.2 ± 1.4°C and precipitation increases of ≈20% are required to produce the observed glacial responses. These results highlight the sensitivity of high-altitude tropical regions to relatively small changes in radiative forcing, implying even greater probable responses to future anthropogenic forcing.
Keywords: climate forcing, glacier reconstruction, moisture balance, Venezuela
During the past millennium, significant climatic fluctuations have occurred. Prominent among these is the Little Ice Age (LIA), recognized in historical records (e.g., ref. 1) and documented in proxy climate records from many locations (2). Although the LIA was a significant global event (3), its causes and regional differences in the timing and climatic response remain unclear (2, 4). This uncertainty is particularly true in the tropics, where well dated records with sufficient temporal resolution to resolve decadal changes in climate are sparse (2). Better knowledge of tropical climate during the LIA will help determine its causes and aid in the prediction of future climatic change.
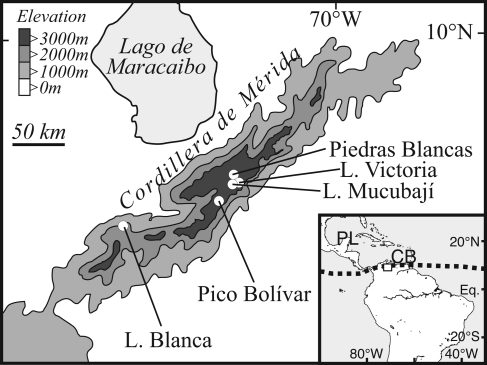
It is hypothesized that variations in the sun's energy output played a role in climatic change during the LIA (4). However, although the tropics receive 47% of the planetary insolation, their response to solar irradiance variability is uncertain. Here we present evidence that climatic change in the Venezuelan Andes is linked to changes in solar activity during the LIA. Venezuela is situated near the northern limit of the annual migration of the intertropical convergence zone (ITCZ) (Fig. 1). The annual migration of the ITCZ between hemispheres leads to pronounced seasonality in rainfall at the latitudinal extremes of this trajectory. Thus, Venezuela is particularly sensitive to changes in the position and strength of the ITCZ (5), which are expressed as changes in the amplitude of the annual cycle (6). The annual cycle is a function of the intensity and zonal migration of maximum solar insolation received at the earth's surface. Therefore, variations in solar energy can be expected to cause changes in the strength of the ITCZ, leading to precipitation and temperature anomalies in Venezuela.
Fig. 1.
Map showing the location of L. Mucubají [8° 47’N, 70° 50’W, 3,570 m above sea level (a.s.l.)], L. Blanca (8° 20’N, 71° 47’W, 1,620 m a.s.l.), and other locations mentioned in the text (PL, Punta Laguna, Mexico; CB, Cariaco Basin). Pollen records are from the Piedras Blancas peat bog and L. Victoria (15 and 1 km from L. Mucubají, respectively). (Inset) The dashed line shows the approximate position of the ITCZ during the Northern Hemisphere summer.
Tropical glaciers respond rapidly to precipitation and temperature variations and, hence, are faithful recorders of climatic variability (7–9). In this study we use glacier fluctuations and paleoclimatic records of precipitation and moisture balance to reconstruct Venezuelan climate during the past 1,500 yr. Prior studies in the Cordillera de Mérida have documented the extent of glaciers during the Last Glacial Maximum and their rapid retreat at the beginning of the Holocene (10, 11). During most of the past 10,000 yr, glaciers were absent from all but the highest peaks in the Cordillera de Mérida (11). Evidence for recent glacier advances comes from unweathered moraines and other glacial landforms. These features have been correlated with the LIA (12); however, they have not been dated, and thus the timing of recent advances remains unknown.
Here we present continuous decadal-scale lake-sediment records of glacier activity and moisture balance in the Venezuelan Andes during the past 1,500 yr. The continuous nature of the glacial record allows us to resolve multiple advances and determine the timing of these events. Because glaciers are sensitive to both temperature and precipitation changes, we present independent reconstructions of precipitation and moisture balance that allow a more accurate determination of the climate during the LIA. Mapping of the paleoglacier and modeling of the glacier response to precipitation and temperature variations provide a quantitative estimate of climatic change during the LIA. Comparison of these glacial and climatic records from Venezuela with regional and global proxy data as well as probable forcing variables allows us to infer potential causes for the glacier advances.
Study Sites
Sediment records from two watersheds were analyzed to reconstruct the timing of glacial advances and regional changes in precipitation/evaporation (P/E) balance for the past 1,500 yr. Laguna (L.) Mucubají (Fig. 1) is situated in a north-facing catchment with a maximum elevation of 4,616 m. By comparison, the only four remaining glaciated peaks in Venezuela have elevations of 4,979 m (Pico Bolívar), 4,922 m (Pico La Concha), 4,942 m (Pico Humboldt), and 4,883 m (Pico Bonpland). The presence of glaciers in the L. Mucubají watershed increased the flux of inorganic sediment to the lake, producing a continuous lake-sediment record of glacier activity. The Mucubají record is corroborated by analysis of sediments from L. Blanca (Fig. 1), a small, closed-basin lake at 1,620 m in unglaciated terrain. At this site, the flux of inorganic sediment to the lake increases during wet periods, producing a distinctive signature in the sediments that contrasts with drier periods. Both records are subsequently compared with nearby pollen histories that chronicle vegetation change in response to climate during the LIA (13).
Results and Discussion
Chronology of Glacial Advances.
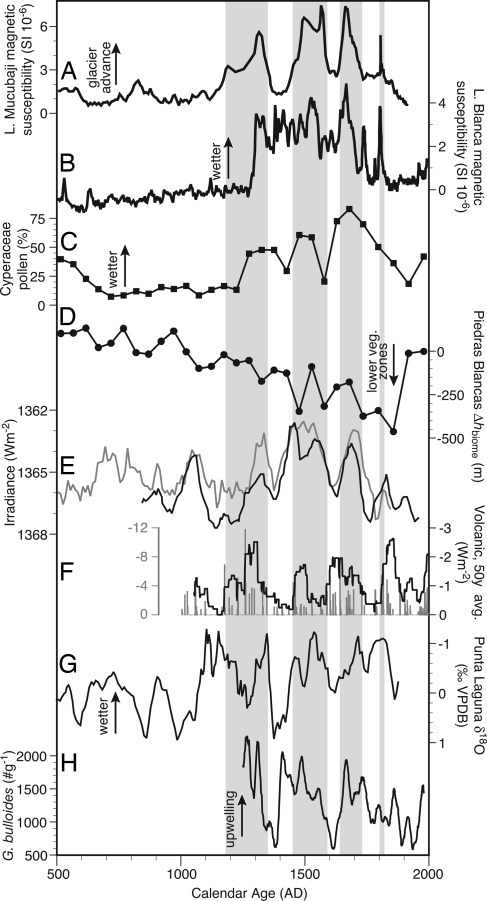
Increased catchment glacierization enhances clastic sedimentation in proglacial lakes, leading to higher concentrations of fine-grained magnetic minerals that can be identified visually by color changes and quantified by magnetic susceptibility (MS) measurements (9, 14). In L. Mucubají, the clastic sediment concentration is significantly correlated with the MS of the sediment throughout the past 6,000 yr (r = 0.74; P < 0.0001) and yields a high-resolution record of clastic sediment concentration (continuous 0.25-cm samples representing 2–6 yr per sample). The MS record has low values before anno Domini (A.D.) 1150, followed by four peaks (A.D. 1180–1350, 1450–1590, 1640–1730, and 1800–1820) and decreasing values from A.D. 1820 to the present (Fig. 2A). The onset and cessation of recent glacial activity in L. Mucubají (A.D. 1180 and 1820, respectively) occurs at times similar to those of other late Neoglacial advances and retreats throughout the South American Andes (14, 21, 22), and corresponds to the Andean expression of the LIA.
Fig. 2.
Lake-sediment records from the Venezuelan Andes compared with indices of solar activity and additional tropical paleoclimate proxies. (A–C) Glacial advances, indicated by increases of sediment MS in L. Mucubají (A) (vertical gray shading), coincide with an increase in precipitation, shown by higher MS in L. Blanca (B) and higher abundances of Cyperaceae (sedge) pollen in the Piedras Blancas peat bog located near to L. Mucubají (C) (13). (D) Lowering of ecological zones and colder/wetter climate during the LIA is indicated by the Δhbiome (equivalent to the minimum estimated departure in ref. 15) from the Piedras Blancas site. (E) Minima in reconstructed solar irradiance (black line) (16) using the scaling of ref. 17 or maxima in Δ14C (gray line, inverted scale) (18) are coeval with glacier advances. The Δ14C record reflects solar modulation of the 14C production rate and is scaled to the reconstructed irradiance curve of ref. 16. (F) Annual record of latitude-weighted volcanic aerosol forcing (gray bars and left axis) (4) and 50-yr averages (line and right axis, multiplied by 4 to scale with the reconstructed solar irradiance and plotted at youngest age of the 50-yr window). (G) Wetter conditions are supported by the Punta Laguna, Mexico, δ18O record of higher P/E during Mucubají glacial advances (19). (H) Abundances of the foraminifer Globigerina bulloides in Cariaco Basin sediments are higher during glacial advances indicating stronger trade winds (20).
Comparison of the LIA history of glacier activity with reconstructions of solar and volcanic forcing suggest that solar variability is the primary underlying cause of the glacier fluctuations. The peaks and troughs in the susceptibility records match fluctuations of solar irradiance reconstructed from 10Be (16) and Δ14C (18) measurements (Fig. 2E). Spectral analysis shows significant peaks at 227 and 125 yr in both the irradiance and MS records, closely matching the de Vreis and Gleissberg oscillations identified from solar irradiance reconstructions. The LIA period in Mucubají occurs during an extended interval of low solar activity (23, 24), which likely promoted the growth of glaciers in the watershed. On the basis of the L. Mucubají sediment record, the establishment of an active glacier occurred at approximately A.D. 1150. The lack of sediment MS response to earlier irradiance minima at A.D. 750 and 1050 is attributable to the absence of a glacier in the watershed before approximately A.D. 1100 (Fig. 2).
Although the shielding effect of volcanic aerosols likely contributed to glacier growth, it is difficult to differentiate the effects of solar and volcanic forcing because they are correlated during the past 1,000 yr (4). However, solar and volcanic forcing are uncorrelated between A.D. 1520 and 1650, and the MS record follows the solar-irradiance reconstruction during this interval (Fig. 2F). This observation suggests that solar forcing is an important underlying cause of variations in glacier activity during the LIA.
Sediment Record of Moisture Balance.
L. Blanca (Fig. 1) contains a nonglacial record of catchment erosion associated with increased P/E balance. Watershed streambeds that are currently vegetated and inactive were occupied during the LIA, increasing the supply of clastic sediment to the lake. The MS of the sediments reveals a low concentration of clastic sediment before 1250 followed by high values A.D. 1300–1550, 1640–1710, 1730–1750, 1780–1790, and 1795–1820 (Fig. 2B). These peaks indicate higher P/E during the glacial advances identified in L. Mucubají. This conclusion is supported by higher abundances of Cyperaceae (sedge) pollen in the Piedras Blancas peat bog (Fig. 1) during the glacial period. Maxima of Cyperaceae occur during glacial advances (Fig. 2C and ref. 13) indicating a marshy environment, corroborating the L. Blanca MS record.
Climatic Inferences from Glaciers.
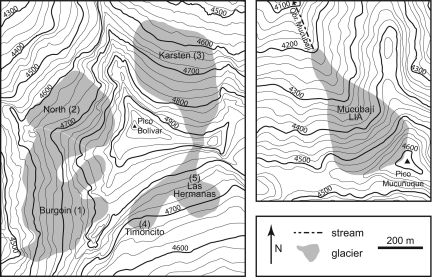
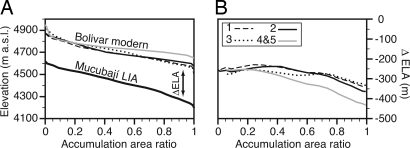
The response of glaciers to both temperature and precipitation changes must be assessed to fully interpret the glacial record (8). This assessment is accomplished by reconstructing changes in glacial extent and then calculating the temperature and precipitation changes needed to support the new glacier size. Fig. 3 shows the modern and reconstructed LIA glacier extent. From these maps, cumulative area-elevation profiles for the LIA and modern glaciers were developed (Fig. 4A). We use the equilibrium-line altitude (ELA; the elevation of the dividing line between the glacier accumulation and ablation areas) as a climatically sensitive measure to document variations in glacier extent. If the glacier accumulation–area ratio (AAR; the ratio of accumulation area to total glacier area) is known, these profiles can be used to determine the ELA. The vertical difference between the LIA and modern ELA (ΔELA) as a function of the AAR value is shown in Fig. 4B. Theoretical AAR values for tropical glaciers are ≈0.82 (26), whereas an average AAR from 78 modern tropical glaciers is 0.69 (27). The ΔELA does not change significantly with the AAR; thus, values of 0.69–0.82 give an estimated ΔELA of approximately ≈300 m. However, modern glaciers on Pico Bolívar have been rapidly retreating since at least A.D. 1870 (12); thus, −300 m represents a minimum estimate of the ΔELA. Accelerated melting since A.D. 1972 has caused two glaciers to disappear completely (12), suggesting that late-20th-century ELAs are actually nearer to the elevation of Pico Bolívar (4,979 m), and the ΔELA may be as much as −500 m.
Fig. 3.
Maps of modern glaciers on Pico Bolívar (Left) and the reconstructed LIA glacier in the Mucubají watershed (Right). The modern glaciers are from mapping by ref. 25 and represent the glacier extent circa A.D. 1972. Accelerated melting since 1972 has caused Las Hermanas and Timoncito glaciers to disappear completely (12).
Fig. 4.
Relationship between normalized cumulative glacier area (AAR) and altitude for modern and LIA glaciers (A) and the ELA depression (ΔELA) of the LIA glacier (B). (A) Altitude profiles of AAR for the Mucubají LIA glacier and modern glaciers on Pico Bolívar. Numbers refer to different glaciers on Pico Bolívar; glaciers 2 and 3 are the best comparison with the Mucubají glacier because these cirques have aspects and morphologies similar to the Mucubají cirque (Fig. 4). (B) The ΔELA of the LIA glacier from the modern glaciers on Pico Bolívar is the difference between the AAR profiles of the Mucubají and modern glaciers in A.
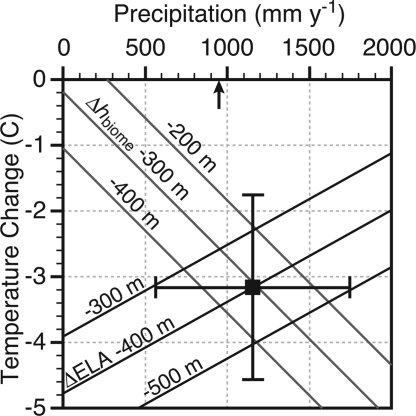
The temperature and precipitation changes associated with this ELA lowering can be estimated by combining equations for the mass and heat balances of a glacier. This method is more accurate than simply multiplying the atmospheric lapse rate by the change in ELA because the elevation gradients of precipitation and humidity cause changes in the sensible and latent heat transfers at the glacier surface and affect the magnitude of the estimated temperature depression. The relationship between temperature depression, precipitation, and ELA lowering was calculated with the combined energy-balance and mass-balance model of ref. 28 after ref. 29. Vertical gradients in temperature, atmospheric humidity, and precipitation were calculated from data in refs. 30, 31, and 32, respectively. Transfer coefficients for sensible and latent heat are from ref. 28. The uncertainty in the temperature estimate is largely related to uncertainty in the estimated ELA depression. This method suggests that an ELA lowering of −300 to −500 m is equivalent to a temperature depression of 2.6–4.3°C, using the modern annual precipitation of 950 mm (Fig. 5).
Fig. 5.
Relationship between temperature change and precipitation from ELA and pollen data. The small arrow indicates the modern precipitation amount.
Palynology and Biome Migration During the LIA.
Pollen evidence from two nearby sites (Piedras Blancas and L. Victoria; Fig. 1) documents the expansion of the superpáramo (alpine tundra) ecotone and a lowering of Andean biomes by several hundred meters coeval to the glacial advances in L. Mucubají. Quantitative estimates for this biome lowering [Δhbiome (15)] at the Piedras Blancas site (13) indicates a gradual decrease in Δhbiome during the LIA, with an average LIA value of approximately −220 m and a minimum of −460 m near the LIA termination (Fig. 2D). The temperature and precipitation change associated with Δhbiome is calculated from the climatology at the modern forest–páramo and páramo–superpáramo biome transitions, and the corresponding vertical gradients of temperature and precipitation. Compared with the NW slopes of the Venezuelan Andes, the modern forest–páramo and páramo–superpáramo boundaries are higher on SE-facing slopes, with mean annual temperatures that are 2.9 and 2.0°C lower, respectively. This difference is primarily a function of the precipitation gradient between these aspects (+1,225 and +755 mm·yr−1, respectively) and provides a constraint on the effect precipitation has on the temperature of the forest–páramo and páramo–superpáramo boundaries (kavg = −0.0025°C·yr·mm−1). Thus, the temperature (T) and precipitation (P) combinations that define the modern and LIA forest-páramo boundary are
This equation can be rewritten to include a change in the elevation of the biomes (Δhbiome) using the vertical gradients in P and T and solved for the LIA temperature change (ΔT = TLIA − Tm) as follows:
Eq. 2 gives the relationship between precipitation and temperature change when the elevation shift of biomes is known. Vertical gradients in temperature and precipitation were calculated from data in refs. 30 and 32, respectively, and used to determine the climatic changes associated with the lowering of biomes during the LIA.
The magnitude of climate changes during the LIA depends on the exact values of ΔELA and Δhbiome used in the reconstruction. Δhbiome provides a continuous measure of climate change because there is very little lag between climate shifts and plant pollen production [on the order of decades (33)]. In contrast, ΔELA provides an estimate of the climate during maximum glacial extent. We reconcile these differences by using a value for ΔELA intermediate between the −300- and −500-m minimum and maximum estimates and a Δhbiome average (−308 m) of the maximum Δhbiome from each glacial advance. The intersection of the ELA and pollen estimates indicate that during the LIA the Venezuelan Andes were both cooler (−3.2°C) and wetter (+208 mm·yr−1, +22%) than present (Fig. 5). Propagation of the uncertainty in ΔELA (±100 m estimated from the minimum and maximum ΔELA values) and Δhbiome [we use the larger uncertainty of ±250 m in the Δhbiome calculation (15) rather than the ±100-m range around the −308 m average] provides uncertainties of ±1.4°C and ±590 mm·yr−1 in these T and P estimates.
Discussion of LIA Climatic Change.
The reconstructed LIA temperature depression in the high altitudes of the Venezuelan Andes is greater than that inferred for Caribbean sea-surface temperatures (SSTs) [≈2°C (34–36)]. This result is likely a consequence of changes in adiabatic lapse rates due to cooling. Cooler tropical SSTs would reduce the absolute humidity of the lower troposphere and steepen the slope of the moist adiabat above the condensation level. This effect would lead to cooling at 4,500 m above sea level, which was ≈1.5 times that at sea-level (Fig. 6), in agreement with our glacier- and pollen-temperature estimates.
Fig. 6.
Vertical profiles of temperature change (A) and enhancement of surface cooling at high elevations (B). Vertical temperature profiles were calculated by using standard meteorological formulae and a surface relative humidity of 80%. (A) Temperature change is the difference from the 26°C surface temperature vertical profile. [Average tropical Atlantic surface temperature and humidity are 26°C and 80%, respectively (31)]. The temperature altitude gradient is enhanced for cooler sea level temperatures such as those predicted for the LIA. (B) The cooling enhancement is the magnitude of the temperature change at a given altitude divided by the temperature change at sea level. Cooling enhancement is independent of the magnitude of the temperature change (overlapping curves in B are for the −0.5 to −2.0°C temperatures changes plotted in A).
Both the L. Blanca and Piedras Blancas P/E records support the increased precipitation inferred from the ELA-pollen reconstruction. However, the wetter conditions indicated by the L. Blanca and Piedras Blancas records also could be the result of decreased evaporation due to lower temperatures. A 3°C decrease in air and lakewater temperatures would reduce evaporation by approximately −20% (37), although decreased atmospheric water vapor due to cooling would likely decrease precipitation amounts (approximately −20% if precipitation is proportional to the partial pressure of water vapor) and offset the reduced evaporation. Accordingly, the P/E change documented in the Venezuelan Andes for the LIA strongly suggests but does not require an increase in precipitation.
Intuitively, it would seem that cooler temperatures and lower absolute humidity would lead to less precipitation in the Venezuelan Andes during the LIA. However, this view may be reconciled with the paleoclimate data for increased precipitation at the study sites by recognizing that it is the transport of moisture to high elevations that most likely controls the precipitation amount, as has been clearly documented for the Bolivian/Peruvian Andes (38). During the LIA, a steeper latitudinal temperature gradient induced stronger easterly trade winds (20), which may have actually enhanced the transport of moisture to the Venezuelan Andes. Thus, greater moisture flux may have more than compensated for the reduced atmospheric water-vapor concentration.
Paleoclimate records from other tropical sites support our interpretation of the glacier and sedimentary records in Venezuela. P/E changes on the Yucatan Peninsula, Mexico, are coherent with solar irradiance over the past 2 millennia (Fig. 2G; ref. 19). Trade-wind strength off the Venezuelan coast was also higher during solar minima (Fig. 2H; ref. 20). These changes are in phase with the Venezuelan records, indicating that the P/E shifts were geographically extensive, involving both the ITCZ and subtropical high pressure.
A notable exception to the regional picture of wetter LIA conditions in northern South America is the record of terrigenous sediment input to the Cariaco Basin (39). Lower concentrations of titanium were found in Cariaco sediments during the LIA, suggesting decreased terrestrial sediment delivery to the basin. One possible explanation for this difference is an antiphasing of precipitation between coastal Venezuela (near the Cariaco Basin) and the Venezuelan Andes. For example, 20th-century Venezuelan climate records show that rainy-season precipitation anomalies have opposite signs in coastal and Andean regions (40). This finding suggests the possibility that, during the LIA, positive rainfall anomalies in the Andes were accompanied by negative anomalies in coastal drainages entering the Cariaco Basin. Alternately, catchments draining the Venezuelan Andes may not directly influence the sedimentology of the Cariaco Basin, because they are either filtered by L. Maracaibo or drain to the Orinoco River.
Conclusions
The data presented here suggest that solar activity has exerted a strong influence on century-scale tropical climate variability during the late Holocene, modulating both precipitation and temperature. Surface cooling is enhanced at high altitudes by feedbacks involving water vapor, ultimately depressing temperatures in the Venezuelan Andes by −3.2 ± 1.4°C during the LIA. It is likely that this mechanism also may serve to amplify the effects of warming trends, irrespective of their origin, which raises concern that global warming will adversely affect high-altitude tropical montane regions (41). Supporting this concern, 20th-century temperature increases have raised the ELAs of tropical glaciers, leading to accelerated ablation and disappearance in many cases (12, 42–44). Our data suggest considerable sensitivity of tropical climate to small changes in radiative forcing from solar irradiance variability. Conservative estimates of net anthropogenic greenhouse-gas radiative forcing for the next 50 yr surpass that of solar forcing in previous centuries (45), implying that profound climatic impacts can be predicted for tropical montane regions.
Materials and Methods
Sediment Chronology.
In 1999, we recovered sediment cores from L. Mucubají and L. Blanca with percussion and square-rod coring systems (46). Duplicate cores and undisturbed sediment/water interface cores were retrieved from L. Mucubají, and the interface core was extruded at 0.5-cm intervals in the field. A composite sediment record for L. Mucubají was constructed from the two long cores and the interface core by matching visual stratigraphy and variations in volume MS, total organic carbon (TOC), total nitrogen (TN), δ13CTOC, δ15NTN, and C/N ratios. A composite sediment record for L. Blanca was developed by matching visual stratigraphy and variations of TOC, MS, and dry density between sediment sections.
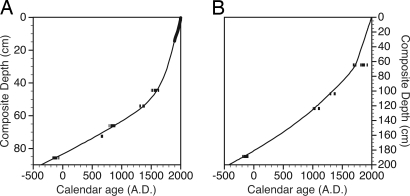
Accelerator mass-spectrometry radiocarbon dates and excess 210Pb profiles constrained the age–depth relationship for the cores. Excess 210Pb profiles were converted to calendar ages with the constant rate of supply model (47) and the 1964 137Cs nuclear testing peak. Radiocarbon ages were converted to calendar ages by using the calib 4.2 data set (Table 1; refs. 18 and 48). Age models (Fig. 7) were constructed with polynomial spline curves to interpolate ages between radiocarbon dates. A single radiocarbon date at 72.5 cm in L. Mucubají was excluded from the age–depth model because it produced sedimentation rates that were anomalous in the context of the complete 8,000-yr record.
Table 1.
Accelerator mass spectrometry radiocarbon ages on L. Mucubají and L. Blanca sediments
| Lab code* | Lake | Core | Material† | Composite depth, cm | 14C age, yr A.D. | 1σ calibrated age ranges, A.D. |
|---|---|---|---|---|---|---|
| CAMS-96809 | L. Mucubají | 99 A | Wood | 44.5 | 1,620 ± 40 | 1495–1500, 1508–1532, 1541–1600, 1614–1636 |
| AA-35204 | L. Mucubají | 99 C | Aq macro | 54.2 | 1,315 ± 45 | 1299–1325, 1349–1391 |
| CURL-4959 | L. Mucubají | 99 C | Aq macro | 66.2 | 770 ± 30 | 782–791, 809–845, 846–891 |
| CAMS-96810 | L. Mucubají | 99 A | Aq macro | 72.5 | 585 ± 30 | 645–685‡ |
| CURL-4960 | L. Mucubají | 99 C | Aq macro | 85.8 | −160 ± 35 | −194 to −193, −172 to −89, −74 to −59 |
| CURL-4973 | L. Blanca | 99 A | Wood | 64.5 | 1,820 ± 35 | 1679–1708, 1719–1739, 1805–1822, 1827–1885, 1912–1935 |
| CURL-4974 | L. Blanca | 99 A | Leaf | 103.5 | 1,290 ± 35 | 1290–1312, 1354–1387 |
| CAMS-73134 | L. Blanca | 99 A | Wood | 123.5 | 970 ± 40 | 1002–1012, 1016–1045, 1088–1121 |
| CAMS-96802 | L. Blanca | 99 A | Wood | 188.6 | −170 ± 35 | −197 to −187, −180 to −91 |
*CAMS, Center for Accelerator Mass Spectrometry, Lawrence Livermore National Laboratory; AA, Accelerator Mass Spectrometry Laboratory, University of Arizona; CURL, National Ocean Sciences Accelerator Mass Spectrometry Facility, Woods Hole Oceanographic Institute.
†Aq macro, aquatic macrophyte.
‡Not included in age model.
Fig. 7.
Age–depth curves for L. Mucubají (A) and L. Blanca (B). Calibrated 1σ radiocarbon age ranges are indicated by the horizontal bars. The thick black line in A represents 210Pb ages.
Sediment Geochemistry.
Clastic material represents the nonbiogenic component of sediments and can be used as an indicator of sediment supply from the catchment. In L. Mucubají clastic sediment content was calculated as the total minus the sum of biogenic silica and organic matter content (no carbonates were present in these sediments). Biogenic silica was analyzed by time-dissolution experiments (49, 50) following the recommendations of ref. 51. Dissolved silica from the dissolution experiments was determined by inductively coupled plasma–atomic emission spectrometry (ICP-AES) (52). TOC was measured with a CHNS elemental analyzer (Carlo Erba Reagenti, Milan) connected via a ConFlo-II interface to a mass spectrometer (Model 252; Finnigan-MAT, San Jose, CA). Total organic matter (TOM) was calculated as 2.05 × TOC based on eight samples where TOM was measured by loss-on-ignition (53, 54) and compared with TOC values. In cores from both L. Blanca and L. Mucubají, MS was measured on split sediment cores with a TS2 automated sediment track (Department of Geology, Lund University, Lund, Sweden) and an MS2E1 high-resolution surface-scanning sensor (Bartington Instruments, Oxford) connected to a Bartington Instruments MS2 magnetic susceptibility meter.
Glacier Reconstruction.
The Mucubají valley paleoglacier ELA was calculated by reconstructing the glacier topography and applying the AAR method (55). Glacier topography was reconstructed by defining the glacial limits, calculating ice thickness along the glacier centerline, and contouring the glacier surface. Glacier limits were drawn from field data, visual observations of aerial photographs, and 1:24,000 topographic maps. The glacier centerline was defined by connecting the lowest points in topographic cross-sections of the glacier area. The surface slope along the glacier centerline was reconstructed with a basal shear stress (τb) of 100 kPa (56). (Alternate constructions with τb = 50 and 150 kPa did not alter the contours significantly.) The surface slope was integrated along the glacier centerline, starting at the glacier terminus, to give the ice elevation. The glacier surface was contoured by connecting reconstructed centerline elevations and bedrock contour lines at the glacier margin. A hypsometric curve of glacier area vs. elevation was developed from the contour plot and used to construct a normalized cumulative area vs. elevation profile. If the glacier AAR (the ratio of accumulation area to total glacier area) is known, these profiles can be used to determine the ELA. For comparison with the Mucubají paleo-ELA, the ELA of modern glaciers in the Cordillera de Mérida was determined by constructing cumulative elevation profiles from the maps of ref. 25.
Acknowledgments
We thank Carsten Braun, Nathan Stansell, Mathias Vuille, and Meagan Mazzarino for their help with fieldwork. This work was supported by National Science Foundation Grants ATM 98-08943, ATM 98-09472, and OISE-0004425; the Geological Society of America; and the Department of Geoscience, University of Massachusetts.
Abbreviations
- AAR
accumulation–area ratio
- A.D.
anno Domini
- ELA
equilibrium-line altitude
- ITCZ
intertropical convergence zone
- L.
Laguna
- LIA
Little Ice Age
- MS
magnetic susceptibility
- P/E
precipitation/evaporation
- TOC
total organic carbon.
Footnotes
Conflict of interest statement: No conflicts declared.
References
- 1.Pfister C. In: Climate Since AD 1500. Bradley R. S., Jones P. D., editors. London: Routledge; 1992. pp. 118–142. [Google Scholar]
- 2.Jones P. D., Mann M. E. Rev. Geophys. 2004;42 doi: 10.1029/2003RG000143. [DOI] [Google Scholar]
- 3.Mann M. E., Bradley R. S., Hughes M. K. Geophys. Res. Lett. 1999;26:759–762. [Google Scholar]
- 4.Crowley T. J. Science. 2000;289:270–277. doi: 10.1126/science.289.5477.270. [DOI] [PubMed] [Google Scholar]
- 5.Enfield D. B. Geophys. Res. Lett. 1996;23:3305–3308. [Google Scholar]
- 6.Hastenrath S. Mon. Weather Rev. 1984;112:1097–1107. [Google Scholar]
- 7.Thompson L. G., Mosley-Thompson E., Bolzan J. F., Koci B. R. Science. 1985;229:971–973. doi: 10.1126/science.229.4717.971. [DOI] [PubMed] [Google Scholar]
- 8.Kaser G. J. Glaciol. 2001;47:195–204. [Google Scholar]
- 9.Seltzer G. O., Rodbell D. T., Baker P. A., Fritz S. C., Tapia P. M., Rowe H. D., Dunbar R. B. Science. 2002;296:1685–1686. doi: 10.1126/science.1070136. [DOI] [PubMed] [Google Scholar]
- 10.Schubert C. Erdwissenschaftliche Forschung. 1984;18:269–278. [Google Scholar]
- 11.Stansell N. M.Sc. thesis. Pittsburgh: University of Pittsburgh; 2005. [Google Scholar]
- 12.Schubert C. Erdkunde. 1992;46:58–64. [Google Scholar]
- 13.Rull V., Salgado-Labouriau M. L., Schubert C., Valastro S., Jr. Palaeogeogr. Palaeoclimatol. Palaeoecol. 1987;60:109–121. [Google Scholar]
- 14.Rosqvist G. Holocene. 1995;5:111–117. [Google Scholar]
- 15.Rull V. Holocene. 2006;16:105–117. [Google Scholar]
- 16.Bard E., Raisbeck G., Yiou F., Jouzel J. Tellus. 2000;52B:985–992. [Google Scholar]
- 17.Lean J., Beer J., Bradley R. S. Geophys. Res. Lett. 1995;22:3195–3198. [Google Scholar]
- 18.Stuiver M., Reimer P. J., Bard E., Beck J. W., Burr G. S., Hughen K. A., Kromer B., McCormac F. G., van der Plicht J., Spurk M. Radiocarbon. 1998;40:1041–1083. [Google Scholar]
- 19.Hodell D. A., Brenner M., Curtis J. H., Guilderson T. Science. 2001;292:1367–1370. doi: 10.1126/science.1057759. [DOI] [PubMed] [Google Scholar]
- 20.Black D. E., Peterson L. C., Overpeck J. T., Kaplan A., Evans M. N., Kashgarian M. Science. 1999;286:1709–1713. doi: 10.1126/science.286.5445.1709. [DOI] [PubMed] [Google Scholar]
- 21.Seltzer G. O. Quaternary Sci. Rev. 1990;9:137–152. [Google Scholar]
- 22.Glasser N. F., Hambrey M. J., Aniya M. Holocene. 2002;12:113–120. [Google Scholar]
- 23.Bond G., Kromer B., Juerg B., Muscheler R., Evans M. N., Showers W., Hoffman S., Lotti-Bond R., Hajdas I., Bonani G. Science. 2001;294:2130–2136. doi: 10.1126/science.1065680. [DOI] [PubMed] [Google Scholar]
- 24.Solanki S. K., Usoskin I. G., Kromer B., Schüssler M., Beer J. Nature. 2004;431:1084–1087. doi: 10.1038/nature02995. [DOI] [PubMed] [Google Scholar]
- 25.Schubert C. Zeitschrift Gletscherkunde Glazialgeologie. 1972;VIII:189–202. [Google Scholar]
- 26.Kaser G., Osmaston H. Tropical Glaciers. Cambridge, U.K.: Cambridge Univ. Press; 2002. [Google Scholar]
- 27.Klein A. G., Seltzer G. O., Isacks B. L. Quaternary Sci. Rev. 1999;18:63–84. [Google Scholar]
- 28.Kuhn M. In: Glacier Fluctuations and Climate Change. Oerlemans J., editor. Dordrecht, The Netherlands: Kluwer Academic; 1989. pp. 407–417. [Google Scholar]
- 29.Seltzer G. O. J. Quaternary Sci. 1992;7:87–98. [Google Scholar]
- 30.Bradley R., Yuretich R., Weingarten B. In: Late Quaternary Climatic Fluctuations of the Venezuelan Andes. Yuretich R., editor. Amherst, MA: Department of Geosciences, Univ. of Massachusetts; 1991. pp. 45–62. [Google Scholar]
- 31.Kalnay E., Kanamitsu M., Kistler R., Collins W., Deaven D., Gandin L., Iredell M., Saha S., White G., Woollen J., et al. Bull. Am. Meteorol. Soc. 1996;77:437–471. [Google Scholar]
- 32.Pulwarty R. S., Barry R. G., Hurst C. M., Sellinger K., Mogollon L. F. Meteorol. Atmospheric Phys. 1998;67:217–237. [Google Scholar]
- 33.Rull V., Abbott M. B., Polissar P. J., Wolfe A. P., Bezada M., Bradley R. S. Quaternary Res. 2005;64:308–317. [Google Scholar]
- 34.Winter A., Ishioroshi H., Watanabe T., Oba T., Christy J. Geophys. Res. Lett. 2000;27:3365–3368. [Google Scholar]
- 35.Watanabe T., Winter A., Oba T. Marine Geol. 2001;173:21–35. [Google Scholar]
- 36.Nyberg J., Malmgren B. A., Kuijpers A., Winter A. Palaeogeogr. Palaeoclimatol. Palaeoecol. 2002;183:25–41. [Google Scholar]
- 37.Pickard G. L., Emery W. J. Descriptive Physical Oceanography. Oxford: Pergamon; 1990. [Google Scholar]
- 38.Garreaud R. D. Mon. Weather Rev. 2000;128:3337–3346. [Google Scholar]
- 39.Haug G. H., Hughen K. A., Sigman D. M., Peterson L. C., Röhl U. Science. 2001;293:1304–1308. doi: 10.1126/science.1059725. [DOI] [PubMed] [Google Scholar]
- 40.Pulwarty R. S., Barry R. G., Riehl H. Erdkunde. 1992;46:273–289. [Google Scholar]
- 41.Bradley R. S., Keimig F. T., Diaz H. F. Geophys. Res. Lett. 2004;31 doi: 10.1029/2004GL020229. [DOI] [Google Scholar]
- 42.Hastenrath S., Kruss P. D. Ann. Glaciol. 1992;16:127–134. [Google Scholar]
- 43.Kaser G. Global Planet. Change. 1999;22:93–103. [Google Scholar]
- 44.Ramirez E., Francou B., Ribstein P., Descloitres M., Guerin R., Mendoza J., Gallaire R., Pouyaud B., Jordan E. J. Glaciol. 2001;47:187–194. [Google Scholar]
- 45.Hansen J., Sato M., Ruedy R., Lacis A., Oinas V. Proc. Natl. Acad. Sci. USA. 2000;97:9875–9880. doi: 10.1073/pnas.170278997. [DOI] [PMC free article] [PubMed] [Google Scholar]
- 46.Wright H. E., Mann D. H., Glaser P. H. Ecology. 1984;65:657–659. [Google Scholar]
- 47.Appleby P. G., Oldfield F. Catena. 1978;5:1–8. [Google Scholar]
- 48.Stuiver M., Reimer P. J., Braziunas T. F. Radiocarbon. 1998;40:1127–1151. [Google Scholar]
- 49.DeMaster D. J. Ph.D. dissertation. New Haven, CT: Yale Univ.; 1979. [Google Scholar]
- 50.DeMaster D. J. Geochim. Cosmochim. Acta. 1981;45:1715–1732. [Google Scholar]
- 51.Conley D. J. Marine Chem. 1998;63:39–48. [Google Scholar]
- 52.Carter S. J., Colman S. M. J. Great Lakes Res. 1994;20:751–760. [Google Scholar]
- 53.Dean W. E., Jr. J. Sediment. Petrol. 1974;44:242–248. [Google Scholar]
- 54.Heiri O., Lotter A. F., Lemcke G. J. Paleolimnol. 2001;25:101–110. [Google Scholar]
- 55.Meirding T. C. Quaternary Res. 1982;18:289–310. [Google Scholar]
- 56.Paterson W. S. B. The Physics of Glaciers. New York: Pergamon; 1981. [Google Scholar]


