Abstract
At low temperatures, proteins exist in a glassy state, a state that has no conformational flexibility and shows no biological functions. In a hydrated protein, at temperatures ≳220 K, this flexibility is restored, and the protein is able to sample more conformational substates, thus becoming biologically functional. This “dynamical” transition of protein is believed to be triggered by its strong coupling with the hydration water, which also shows a similar dynamic transition. Here we demonstrate experimentally that this sudden switch in dynamic behavior of the hydration water on lysozyme occurs precisely at 220 K and can be described as a fragile-to-strong dynamic crossover. At the fragile-to-strong dynamic crossover, the structure of hydration water makes a transition from predominantly high-density (more fluid state) to low-density (less fluid state) forms derived from the existence of the second critical point at an elevated pressure.
Keywords: glass transition, liquid–liquid transition, protein dynamics, quasi-elastic neutron scattering
Without water, a biological system would not function. Dehydrated enzymes are not active, but a single layer of water surrounding them restores their activity. It has been shown that the enzymatic activity of proteins depends crucially on the presence of at least a minimum amount of solvent water (1, 2). It is believed that ≈0.3 g of water per g of protein is sufficient to cover most of the protein surface with one single layer of water molecules and to fully activate the protein functionality. Thus, biological functions (3) such as enzyme catalysis can only be understood with a precise knowledge of the behavior of this single layer of water and how that water affects conformation and dynamics of the protein. The knowledge of the structure and dynamics of water molecules in the so-called hydration layer surrounding proteins is therefore of utmost relevance to the understanding of the protein functionality. It is well documented that at low temperatures proteins exist in a glassy state (4, 5), which is a solid-like structure without conformational flexibility. As the temperature is increased, the atomic motional amplitude increases linearly initially, as in a harmonic solid. In hydrated proteins, at ≈220 K, the rate of the amplitude increase suddenly becomes enhanced, signaling the onset of additional anharmonic and liquid-like motion (6–9). This “dynamical” transition of proteins is believed to be triggered by their strong coupling with the hydration water through the hydrogen bonding. The reasoning is derived from the finding that the protein hydration water shows some kind of dynamic transition at a similar temperature (10, 11). Here we demonstrate, through a high-resolution quasi-elastic neutron scattering (QENS) experiment, that this dynamic transition of hydration water on lysozyme protein is in fact the fragile-to-strong dynamic crossover (FSC) at 220 K, similar to that recently observed in confined water in cylindrical nanopores of silica materials (12, 13). Computer simulations on both bulk water (14) and protein hydration water around lysozyme (15) have led to the interpretation of the FSC as arising from crossing the locus of maximum in the correlation length (“Widom line”), which emanates from a critical point into the one-phase region; if this interpretation is correct, then our experiments provide evidence supporting the existence of a liquid–liquid critical point in protein hydration water, which previously has been proposed only for bulk water (16).
Water molecules in a protein solution may be classified into three categories: (i) the bound internal water; (ii) the surface water, i.e., the water molecules that interact with the protein surface strongly; and (iii) the bulk water. The bound internal water molecules, which occupy internal cavities and deep clefts, are extensively involved in the protein-solvent H-bonding and play a structural role in the folded protein itself. The surface water, which is usually called the hydration water, is the first layer of water that interacts with the solvent-exposed protein atoms of different chemical character, feels the topology and roughness of the protein surface, and exhibits the slow dynamics. Finally, water that is not in direct contact with the protein surface but continuously exchanges with the surface water has properties approaching that of bulk water. In this work, we deal with dynamics of the hydration water in a powder of the globular protein lysozyme. This hydration water is believed to have an important role in controlling the biofunctionality of the protein.
The biochemical activity of proteins also depends on the level of hydration. In lysozyme, enzymatic activity remains very low up to a hydration level (h) of ≈0.2 (h is measured in g of water per g of dry protein) and then increases sharply with an increase in h from 0.2 to 0.5 (17). Various experiments (18) and computer simulations (19) have demonstrated the strong influence of the hydration level on protein dynamics.
It has been found that many proteins exhibit a sharp slowing down of their functions (kinetic or biochemical reactions) at a temperature somewhere within the interval of T between 200 and 250 K. An analysis of the mean-squared atomic displacement, 〈x2〉, by using Mössbauer (20), x-ray (9), and neutron scattering (21) spectroscopy, in hydrated proteins shows sharp changes around a certain sample temperature range: 〈x2〉 varies approximately linearly as a function of T at low T and then increases sharply above T between 200 and 250 K. The sharp rise in 〈x2〉 was attributed to a certain dynamic transition in biopolymers at this temperature range. The coincidence of the characteristic temperatures, below which the biochemical activities slow down, and the onset of the dynamic transition suggests a direct relation between these two phenomena. It also has been demonstrated that the dynamic transition can be suppressed in dry biopolymers or in biopolymers dissolved in trehalose (22). It also can be shifted to higher temperatures, e.g., between 270 and 280 K, for proteins dissolved in glycerol (23). Thus, the solvent plays a crucial role in the dynamic transition in biopolymers. This observation led to a suggestion by many authors that proteins are “slaves” to the solvent (24). Despite many experimental studies, the nature of the dynamic transition in proteins remains unclear. Many authors interpret the dynamic transition as a kind of glass transition in a biopolymer (7, 8, 25). Our experiments described below demonstrate that the origin of the characteristic temperature controlling both the activity of the protein and the transition in the behavior of 〈x2〉 is the FSC phenomenon in the hydration water, which shares the same crossover temperature with the protein.
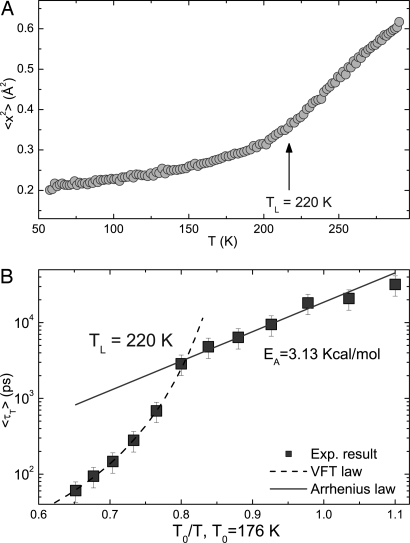
By using a high-resolution QENS method and the relaxing-cage model (RCM) (described in Methods) (26) for the analysis, we determine the temperature dependence of the average translational relaxation time, 〈τT〉, for the hydration water. The dynamic crossover temperature of hydration water is defined as follows. At high temperatures, 〈τT〉 follows a super-Arrhenius behavior [called a “fragile” behavior (27)] describable approximately by a Vogel–Fulcher–Tammann (VFT) law: 〈τT〉 = τ1 exp[DT0/(T − T0)], where D is a constant providing the measure of fragility and T0 is the ideal glass transition temperature at which the relaxation time appears to diverge. In reality, however, this divergence is avoided by the system. Instead, an Arrhenius behavior [called a “strong” behavior (27)] sets in below the crossover temperature TL where the functional dependence of the relaxation time switches to a law: 〈τT〉 = τ1 exp[EA/kBT], where EA is the activation energy for the relaxation process and kB is the Boltzmann constant. The crossover temperature TL is defined by the intersection of these two laws, which gives 1/TL = 1/T0 − (DkB)/EA. In the case of hydration water in lysozyme, we found TL = 220 K, which agrees well with the characteristic transition temperature in protein observed before (9). Because the average relaxation time 〈τT〉 is a measure of the mobility of a typical hydration water molecule, this result implies that the sudden change in the trend of mobility of water molecules at the crossover temperature triggers the so-called glass transition of protein molecules (7, 8, 19, 25).
Results
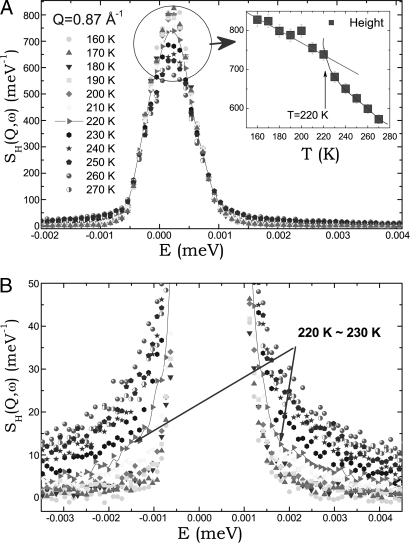
We show in Fig. 1, as an example, a complete set (temperature series) of QENS area-normalized spectra taken at Q = 0.87 Å−1 at ambient pressure. The broadening of the quasi-elastic peaks at the wing becomes more and more noticeable as temperature increases. And at the same time, the peak height decreases accordingly because the area is normalized to unity. In Fig. 1A Inset, we plot the peak height as a function of temperature. It is noticeable that the rate of increase as a function of temperature is different across the temperature 220 K. From Fig. 1B, we may notice, from the wings of these spectral lines, that two groups of curves, 270 K ≥ T ≥ 230 K and 210 K ≥ T ≥ 160 K, are separated by the curve at a temperature 220 K. This visual information obtained from the spectra before data analysis reinforces the result of the detail line shape analysis to be shown later in Fig. 3, that there is an abrupt dynamical transition at TL = 220 K.
Fig. 1.
Measured neutron spectra. Shown are normalized QENS spectra at Q = 0.87 Å−1, displaying the height of the peak (A) and the wing of the peak (B) at a series of temperatures. (A Inset) A plot of the peak heights vs. temperature. Arrows in B highlight the wing of the spectra at the crossover temperature.
Fig. 3.
Evidence for the dynamic transition. (A) The temperature dependence of the mean-squared atomic displacement of the hydrogen atom at 2-ns time scale measured by an elastic scan with resolution of 0.8 μeV. (B) Temperature dependence of the average translational relaxation times plotted in log(〈τT〉) vs. T0/T, where T0 is the ideal glass transition temperature. Here, there is a clear and abrupt transition from a Vogel–Fulcher–Tammann law at high temperatures to an Arrhenius law at low temperatures, with the fitted crossover temperature TL = 220 K and the activation energy EA = 3.13 kcal/mol extracted from the Arrhenius part indicated in the figure.
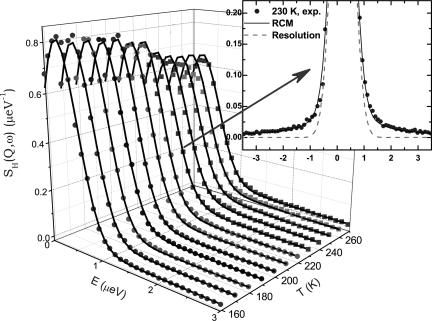
Fig. 2 shows the result of RCM analyses of the spectra taken at Q = 0.87 Å−1 for a series of temperatures ranging from 270 to 160 K (Fig. 2) and in particular at T = 230 K (Fig. 2 Inset). In Fig. 2, we display the instrument resolution function purposely for comparison with the measured spectrum. RCM, as can be seen, reproduces the experimental spectral line shapes of hydration water quite well. The broadening of the experimental data over the resolution function leaves enough dynamic information to be extracted by RCM. This result means that it requires a high-resolution backscattering instrument with an energy resolution of 0.8 μeV (1 eV = 1.602 × 10⁻¹⁹ J) to adequately study the FSC phenomena in hydration water.
Fig. 2.
Neutron spectra and their RCM analyses. Measured QENS spectra (filled symbols) and their RCM analysis results (solid lines) at Q = 0.87 Å−1 and at a series of temperatures are shown. (Inset) One particular spectrum at T = 230 K is singled out and contrasted with the resolution function of the instrument for this Q value (dashed line).
In Fig. 3A, we first present the mean-squared atomic displacement 〈x2〉 {calculated from the translational Debye–Waller factor, SH(Q, ω = 0) = exp[−Q2〈x2〉]} of the hydrogen atoms vs. T to indicate that there is a hint of a dynamic transition at a temperature between 200 and 220 K. In Fig. 3B, we then present in an Arrhenius plot the temperature dependence of the average translational relaxation time, 〈τT〉, for the hydrogen atom in a water molecule calculated by Eqs. 1 and 2 in Methods. The contribution from hydrogen atoms in the protein has been subtracted out during the signal processing. It is seen that, in the temperature range 270–230 K, 〈τT〉 obeys Vogel–Fulcher–Tammann law, a signature of fragile liquid, quite closely. But at T = 220 K it suddenly switches to an Arrhenius law, a signature of a strong liquid. Therefore, we have a clear evidence of FSC in a cusp form. The T0 for the fragile liquid turns out to be 176 K, and the activation energy for the strong liquid is EA = 3.13 kcal/mol.
Discussion and Summary
Recently, E. Mamontov (28) observed a similar dynamic crossover in the surface water on cerium oxide powder sample. The surface of cerium oxide is hydroxylated. The coverage of water is approximately two layers, and the crossover temperature is said to be at 215 K. The observed slow dynamics is attributed to the effect on the translational mobility of the water molecules in contact with the surface hydroxyl groups. Thus, our observation of the FSC in hydration water of protein may be a universal phenomenon for surface water.
It should be noted that the FSC in confined supercooled water is attributed to the crossing of the so-called Widom line in the pressure–temperature (phase) plane in a recent molecular dynamics simulation work on bulk water (14) and protein hydration water at ambient pressure (15). The Widom line is originated from the existence of the second critical point of water and is the extension of the liquid–liquid coexistence line into the one-phase region. Therefore, our observation of the FSC at ambient pressure implies that there may be a liquid–liquid phase transition line in the protein hydration water at elevated pressures. This dynamic crossover, when crossing the Widom line, causes the layer of the water surrounding a protein to change from the “more fluid” high-density liquid form (which induces the protein to adopt more flexible conformational substates) to the “less fluid” low-density liquid structure (which induces the protein to adopt more rigid conformational substates).
In summary, an investigation of the average translational relaxation time, or the α-relaxation time, of protein hydration water as a function of temperature reveals a hitherto unnoticed FSC at 220 K, close to the universal dynamic transition temperature documented for proteins in literature. This fact implies that the sudden transition of the water mobility on the surface of a protein at the FSC triggers the so-called glass transition, which is known to have a profound consequence on biological function of the protein itself.
Methods
Sample Preparation.
Hen egg white lysozyme used in this experiment was obtained from Fluka (L7651; three times crystallized, dialyzed, and lyophilized) and used without further purification. The sample was dried under vacuum in the presence of P2O5 to remove any water left. The dried protein powder then was hydrated isopiestically at 5°C by exposing it to water vapor in a closed chamber until h = 0.3 is reached (i.e., 0.3 g of H2O per g of dry lysozyme). The hydration level was determined by thermo-gravimetric analysis and also confirmed by directly measuring the weight of absorbed water. This hydration level was chosen to have almost a monolayer of water covering the protein surface (29). A second sample then was prepared by using D2O to subtract out the incoherent signal from the protein hydrogen atoms. Both hydrated samples had the same water or heavy water/dry protein molar ratio. Differential scanning calorimetry (DSC) analysis was performed to detect the absence of any feature that could be associated with the presence of bulk-like water.
Neutron Experiments.
The high-resolution incoherent QENS spectroscopy method was used to determine the temperature dependence of the average translational relaxation time for the hydration water. In this experiment, we measured both an H2O-hydrated sample and a D2O-hydrated sample and took the difference to obtain the signal contributed solely from hydration water. Because neutrons are predominantly scattered by an incoherent process from the hydrogen atoms in water (rather than by the coherent scattering process from the oxygen atoms), high-resolution QENS technique is an appropriate tool for the study of diffusional process of water molecules. By using the High-Flux Backscattering Spectrometer in the NIST Center for Neutron Research, we were able to measure the average translational relaxation time (α-relaxation time) from 60 ps to 20 ns over the temperature range of 270–180 K, spanning both below and above the fragile-to-strong crossover temperature. For the chosen experimental setup, the spectrometer has an energy resolution of 0.8 μeV and a dynamic range of ±11 μeV (30) to be able to extract the broad range of relaxation times covering both the fragile and strong regimes of the relaxation times from measured spectra.
Data Analysis.
QENS experiments essentially provide us with the Fourier transform of the intermediate scattering function (ISF) of the hydrogen atoms, FH(Q, t), of water molecules in the hydration layer. Molecular dynamics simulations have shown that the ISF of both bulk (31) and confined (32) supercooled water can be accurately described as a two-step relaxation: a short-time Gaussian-like (in-cage vibrational) relaxation followed by a plateau and then a long-time (time > 1.0 ps) stretched exponential relaxation of the cage. The RCM (26), which we used for data analysis, models closely this two-step relaxation and has been tested extensively against bulk and confined supercooled water through molecular dynamics and experimental data (12, 31, 32). By considering only the spectra with wave vector transfer Q < 1.1 Å−1, we can safely neglect the contribution from the rotational motion of water molecule in the ISF (26). The RCM describes the translational dynamics of water at supercooled temperature in terms of the product of two functions
 |
where the first factor, FS(Q, t), represents the short-time vibrational dynamics of the water molecule in the cage. This function is fairly insensitive to temperature variation and thus can be calculated from molecular dynamics simulation. The second factor, the α-relaxation term, contains the stretch exponent β and the Q-dependent translational relaxation time τT(Q), which is a strong function of temperature. The latter quantity is further specified by two phenomenological parameters τ0 and γ, the exponent controlling the power-law Q-dependence of τT(Q). The average translational relaxation time, which is a Q-independent quantity, that we use in this work is defined as
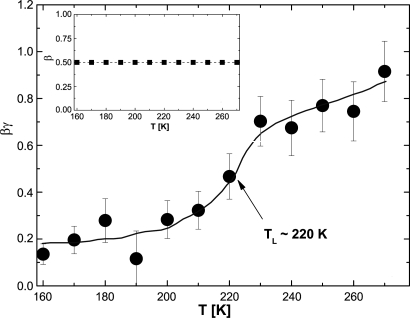
where Γ is the gamma function. The temperature dependences of the three phenomenological parameters, τ0, β, and γ, are obtained by analyzing simultaneously a group of nine quasi-elastic peaks at different Q values. Then the average translational relaxation time, 〈τT〉, was calculated according to Eq. 2 by using τ0 and β. As can be seen from Eqs. 1 and 2, the product βγ is an exponent expressing the Q-dependence of the ISF. Fig. 4 gives the temperature dependence of the exponent βγ, which indicates a precipitous drop at the crossover temperature 220 K from a high temperature value of ≈1 to a low temperature value of ≈0.2, whereas β maintains a value of 0.5 all of the way through (12). Note that the values of exponents β and βγ for free diffusion are 1 and 2, respectively, and the lower values of these two exponents signify an anomalous and more restrictive mobility of water compared with that of the free diffusion. Fig. 4 shows that although the mobility of hydration water molecule at a picosecond-to-nanosecond timescale deviates significantly from free diffusion at all temperatures measured, as temperature goes below the crossover temperature TL, the mobility becomes drastically reduced.
Fig. 4.
Temperature dependence of the exponents β (Inset) and βγ giving, respectively, the power laws of t and Q-dependence of the ISF.
Acknowledgments
We thank Dr. H. Eugene Stanley for a critical review of the manuscript. The research at the Massachusetts Institute of Technology is supported by Department of Energy Grants DE-FG02-90ER45429 and 2113-MIT-DOE-591. This work used facilities supported in part by National Science Foundation Agreement DMR-0086210. This work was supported in part by Consorzio Interuniversitario per lo Sviluppo dei Sistemi a Grande Interfase. We benefited from affiliation with European Union-Marie-Curie Research and Training Network on Arrested Matter.
Abbreviations
- FSC
fragile-to-strong dynamic crossover
- ISF
intermediate scattering function
- QENS
quasi-elastic neutron scattering
- RCM
relaxing-cage model.
Footnotes
Conflict of interest statement: No conflicts declared.
References
- 1.Gregory R. B., editor. Protein-Solvent Interactions. New York: Dekker; 1995. [Google Scholar]
- 2.Teeter M. M. Annu. Rev. Biophys. Biophys. Chem. 1991;20:577–600. doi: 10.1146/annurev.bb.20.060191.003045. [DOI] [PubMed] [Google Scholar]
- 3.Rupley J. A., Yang P.-H., Tollin G. In: Water in Polymers. Rowland S. P., editor. Washington, DC: Am. Chem. Soc.; 1980. pp. 111–132. [Google Scholar]
- 4.Iben I. R. T., Braunstein D., Doster W., Frauenfelder H., Hong M. K., Johnson J. B., Luck S., Ormos P., Schulte A., Steinbach P. J., et al. Phys. Rev. Lett. 1989;62:1916–1919. doi: 10.1103/PhysRevLett.62.1916. [DOI] [PubMed] [Google Scholar]
- 5.Angell C. A. Science. 1995;267:1924–1935. doi: 10.1126/science.267.5206.1924. [DOI] [PubMed] [Google Scholar]
- 6.Parak F., Knapp E. W. Proc. Natl. Acad. Sci. USA. 1984;81:7088–7092. doi: 10.1073/pnas.81.22.7088. [DOI] [PMC free article] [PubMed] [Google Scholar]
- 7.Doster W., Cusack S., Petry W. Nature. 1989;337:754–756. doi: 10.1038/337754a0. [DOI] [PubMed] [Google Scholar]
- 8.Doster W., Cusack S., Petry W. Phys. Rev. Lett. 1990;65:1080–1083. doi: 10.1103/PhysRevLett.65.1080. [DOI] [PubMed] [Google Scholar]
- 9.Rasmussen B. F., Stock A. M., Ringe D., Petsko G. A. Nature. 1992;357:423–424. doi: 10.1038/357423a0. [DOI] [PubMed] [Google Scholar]
- 10.Paciaroni A., Bizzarri A. R., Cannistraro S. Phys. Rev. E Stat. Phys. Plasmas Fluids Relat. Interdiscip. Top. 1999;60:R2476–R2479. doi: 10.1103/physreve.60.r2476. [DOI] [PubMed] [Google Scholar]
- 11.Caliskan G., Kisliuk A., Sokolov A. P. J. Non-Crystalline Solids. 2002;307–310:868–873. [Google Scholar]
- 12.Faraone A., Liu L., Mou C.-Y., Yen C.-W., Chen S.-H. J. Chem. Phys. 2004;121:10843–10846. doi: 10.1063/1.1832595. [DOI] [PubMed] [Google Scholar]
- 13.Liu L., Chen S.-H., Faraone A., Yen C.-W., Mou C.-Y. Phys. Rev. Lett. 2005;95:117802–1–117802–4. doi: 10.1103/PhysRevLett.95.117802. [DOI] [PubMed] [Google Scholar]
- 14.Xu L., Kumar P., Buldyrev S. V., Chen S.-H., Poole P. H., Sciortino F., Stanley H. E. Proc. Natl. Acad. Sci. USA. 2005;102:16558–16562. doi: 10.1073/pnas.0507870102. [DOI] [PMC free article] [PubMed] [Google Scholar]
- 15.Kumar P., Xu L., Yan Z., Mazza M. G., Buldyrev S. V., Chen S.-H., Sastry S., Stanley H. E. 2006 doi: 10.1103/PhysRevLett.97.177802. arXiv: cond-mat/0603557. [DOI] [PubMed] [Google Scholar]
- 16.Poole P. H., Sciortino F., Essmann U., Stanley H. E. Nature. 1992;360:324–328. [Google Scholar]
- 17.Rupley J. A., Careri G. Adv. Protein Chem. 1991;41:37–172. doi: 10.1016/s0065-3233(08)60197-7. [DOI] [PubMed] [Google Scholar]
- 18.Roh J. H., Novikov V. N., Gregory R. B., Curtis J. E., Chowdhuri Z., Sokolov A. P. Phys. Rev. Lett. 2005;95:038101-1–038101-4. doi: 10.1103/PhysRevLett.95.038101. [DOI] [PubMed] [Google Scholar]
- 19.Tarek M., Tobias D. J. Phys. Rev. Lett. 2002;88:138101-1–138101-4. doi: 10.1103/PhysRevLett.88.138101. [DOI] [PubMed] [Google Scholar]
- 20.Parak F., Frolov E. N., Mössbauer R. L., Goldanskii V. I. J. Mol. Biol. 1981;145:825–833. doi: 10.1016/0022-2836(81)90317-x. [DOI] [PubMed] [Google Scholar]
- 21.Ferrand M, Dianoux A. J., Petry W., Zaccai G. Proc. Natl. Acad. Sci. USA. 1993;90:9668–9672. doi: 10.1073/pnas.90.20.9668. [DOI] [PMC free article] [PubMed] [Google Scholar]
- 22.Cordone L., Ferrand M., Vitrano E., Zaccai G. Biophys. J. 1999;76:1043–1047. doi: 10.1016/S0006-3495(99)77269-3. [DOI] [PMC free article] [PubMed] [Google Scholar]
- 23.Tsai A. M., Neumann D. A., Bell L. N. Biophys. J. 2000;79:2728–2732. doi: 10.1016/S0006-3495(00)76511-8. [DOI] [PMC free article] [PubMed] [Google Scholar]
- 24.Lichtenegger H., Doster W., Kleinert T., Birk A., Sepiol B., Vogl G. Biophys. J. 1999;76:414–422. doi: 10.1016/S0006-3495(99)77208-5. [DOI] [PMC free article] [PubMed] [Google Scholar]
- 25.Vitkup D., Ringe D., Petsko G. A., Karplus M. Nat. Struct. Biol. 2000;7:34–38. doi: 10.1038/71231. [DOI] [PubMed] [Google Scholar]
- 26.Chen S.-H., Liao C., Sciortino F., Gallo P., Tartaglia P. Phys. Rev. E Stat. Phys. Plasmas Fluids Relat. Interdiscip. Top. 1999;59:6708–6714. doi: 10.1103/physreve.59.6708. [DOI] [PubMed] [Google Scholar]
- 27.Angell C. A. J. Non-Crystalline Solids. 1991;131–133:13–31. [Google Scholar]
- 28.Mamontov E. J. Chem. Phys. 2005;123:171101-1–171101-4. doi: 10.1063/1.2125729. [DOI] [PubMed] [Google Scholar]
- 29.Careri G. Prog. Biophys. Mol. Biol. 1998;70:223–249. doi: 10.1016/s0079-6107(98)00030-3. [DOI] [PubMed] [Google Scholar]
- 30.Meyer A., Dimeo R. M., Gehring P. M., Neumann D. A. Rev. Sci. Instrum. 2003;74:2759–2777. [Google Scholar]
- 31.Gallo P., Sciortino F., Tartaglia P., Chen S.-H. Phys. Rev. Lett. 1996;76:2730–2733. doi: 10.1103/PhysRevLett.76.2730. [DOI] [PubMed] [Google Scholar]
- 32.Gallo P., Rovere M., Spohr E. Phys. Rev. Lett. 2000;85:4317–4320. doi: 10.1103/PhysRevLett.85.4317. [DOI] [PubMed] [Google Scholar]


