Abstract
Carotenoids (Car) act as “wires” that discharge unwanted electrons in the reaction center of higher plants. One step in this “side-path” electron conduction is thought to be mediated by Car oxidation. We have carried out direct measurements of the conductance of single-Car molecules under potential control in a membrane-mimicking environment, and we found that when Car are oxidized conductance is enhanced and the electronic decay constant (β) is decreased. However, the neutral molecule may already be conductive enough to account for observed electron transfer rates.
Keywords: carotenoid, molecular electronics, photosynthesis, potential control, single molecule
Photosynthetic systems are natural photoelectronic devices, integrating electronic and photonic elements in a protein scaffold. Understanding the role played by the different components is important both for understanding photosynthetic processes as well as for using them in artificial molecular electronic devices. Carotenoids (Car) in photosynthesis contribute to light harvesting, structural stabilization, and protection from photooxidation. In photosystem II reaction centers, Car participate in the “side-path” electron donation reactions for reduction of P680+ as part of the photoprotective system. The role of the Car is thought to be that of an electron carrier (1, 2). It is believed that β-carotene in photosystem II is oxidized under illumination (1, 2). To investigate whether Car oxidation is a prerequisite for electron transport in photosystem II photoprotection, we measured the conductivity and the length-dependence of the tunneling rate for single-Car molecules under potential control. Measuring electron transport under potential control allows us to simulate the redox environment of the Car under natural conditions and to relate our electronic measurements to its function in vivo.
Single (neutral) Car polyenes are much more conductive than alkanes of equivalent length because of their conjugated π-electron system (3–5). We and others (6–9) have shown that the conductivity of redox-active single molecules can be regulated by changes in the molecule’s oxidation state. Here, we have extended our experimental methods to work in a water- and oxygen-free environment that mimics the conditions found in cell membranes. In this way, we hope to understand one of the roles of Car in photosynthesis and to explore their role as gatable electronic components. Finding such components remains a challenge to date (10).
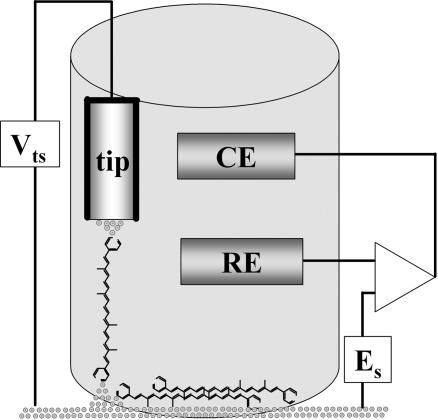
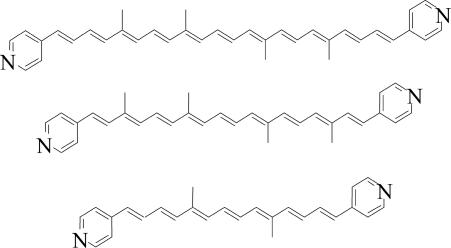
Single-molecule electron transport measurements under potential control were carried out by following the method developed by Xu and Tao (6, 11), for which a scanning tunneling microscope (STM) is used with a partially insulated probe to enable measurements in a conductive electrolyte, which is required for maintaining potential control. A scheme of the experimental setup is shown in Fig. 1 (see also the supporting information, which is published on the PNAS web site). Photosystem II is a transmembrane protein complex, so the surrounding environment of natural Car is nonaqueous. Moreover, Car generally undergo irreversible redox reactions in the presence of water or oxygen (12). Therefore, it was necessary to perform the measurements in an oxygen-free electrolyte based on an organic solvent. The solvent chosen was propylene carbonate, which has a low vapor pressure, low toxicity, and relatively low hygroscopicity (13). The probes were insulated with high-density polyethylene, which is insoluble in this electrolyte. The all-trans Car molecules measured here consist of a polyene backbone of 7, 9, or 11 double bonds terminated at both ends by pyridine rings, which serve as binding groups to the Au electrode via the nitrogen atom at positive potentials (Scheme 1) (14). The typical thickness of the adsorbed layer of nine-double-bonds Car was found (by ellipsometry) to be 7.5 ± 1.5 Å and was found to increase with longer adsorption times. Large variations between different measurements indicate a highly disordered layer. The layer thickness fits well with the estimated dimension of the Car’s width of 7.8 Å and is significantly smaller than the calculated length of 28.4 Å for the nine-double-bonds Car. We conclude that the molecules are likely to lie flat on the substrate in a nonordered fashion, as expected from the tendency of both end groups to adsorb to Au (see Fig. 1).
Fig. 1.
Schematic description of the electrochemical STM cell with the Au tip–Car–Au substrate measurement configuration (not to scale). The molecules that are not measured lie flat on the Au substrate surface. Es is the surface potential, RE is the Ag quasireference electrode, CE is the Pt counterelectrode, and Vts is the bias applied between the tip and the substrate.
Scheme 1.
Results and Discussion
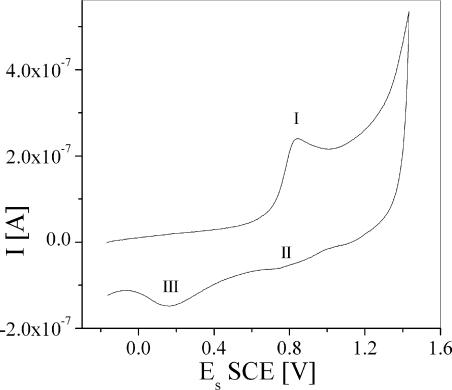
Our cyclic voltammetry measurements (Fig. 2 shows an example for the nine-double-bonds Car) show one oxidation peak (I), with the corresponding reduction peak (II) being significantly smaller. An additional reduction peak (III) could be assigned to the reduction of a deprotonated oxidation product. The appearance of one oxidation peak that is not entirely reversible is interpreted as a single electron transfer in the oxidation process. A one-electron oxidation also is deduced from calculating the experimental current function (15) and comparing the values to those obtained by simulations (for a detailed discussion, see the supporting information). Cyclic voltammetry of Car generally shows evidence of two oxidation processes: from the neutral Car to the radical cation (Car·+) and from Car·+ to the dication (Car2+), whose oxidation potentials may differ by 0–250 mV (16). The lack of the second oxidation process in our case, from Car·+ to Car2+, is caused by the instability of the Car·+, resulting from the pyridine end groups. However, the small reduction peak present (especially with 9 and 11 double bonds) may indicate that some Car·+ is still present even at high positive potentials, whereas the second oxidation peak is probably too small to be observed because of the small quantity of Car·+. Thus, it is likely that our studies at potentials equal to or greater than the oxidation potential involve both Car·+ and other, unknown species. The transport measurements show a spread of conductance values that probably reflects the presence of different species (see below). The oxidation potentials found for Car with 7, 9, and 11 double bonds were 0.977, 0.839, and 0.737 V vs. standard calomel electrode (SCE) (±0.005 V), respectively. These values are within the range generally found for natural Car, (16) and the small variations are consistent with those found for other Car with similar lengths (15).
Fig. 2.
Cyclic voltammogram of bipyridine carotene with nine double bonds. The working electrode was a Pt disk, and the solvent was CH2Cl2 with tetrabutylammonium hexafluorophosphate as a supporting electrolyte. The scan rate was 2 V/s. See the text for peak identification.
The conductances of single neutral molecules (see the data points for potentials close to 0 V in Fig. 3a) were found to be 0.66 ± 0.1 nS, 0.23 ± 0.05 nS, and 0.12 ± 0.05 nS for Car with 7, 9, and 11 double bonds, respectively. These values are in general agreement with the previously measured conductances of neutral Car of similar length with thiol linkers but measured without potential control (3, 5). The present measurements under potential control demonstrate that the conductance measured previously was indeed that of the neutral Car. Our experiments also determined the change in the rate of tunneling with the change in the length of the molecule. These data can be fitted with an exponential decay with length, G = G0 exp(−βNN) (triangles in Fig. 3b), where G is conductance, N is the number of double bonds in the polyene chain, and an effective electronic decay constant, β, per double bond, is βN = 0.43 ± 0.07 [corresponding to β = 0.17 ± 0.03 Å−1, assuming 2.48 Å as linear length between two consecutive double bonds (3)]. This empirically determined quantity is not the same as the coefficient of the exponential attenuation of the electron transfer matrix element (although it depends on it). The electrochemical data imply that energy levels shift as the length of the molecule is changed, so the parameter determined here contains contributions from both the intrinsic decay length and the length-dependence of the electronic properties.
Fig. 3.
Conductance of single Car molecules under potential control. (a) Single-molecule conductance of Car of various lengths as a function of surface potential vs. SCE. (Top) Seven double bonds. (Middle) Nine double bonds. (Bottom) Eleven double bonds. The filled squares show conductance of the high-current series of data, and the open circles show that of the low-current series (see text). The curves show fits of the high-conductance data to Gaussians. The bias was −500 mV. Error bars show the half-width at half-maximum of peaks of the current histogram (see the supporting information). (b) Semilog plot of conductance as a function of the number of double bonds in the Car polyene backbone. Conductance in the neutral state (triangles) was measured under potential close to zero, and that of the oxidized state (squares) was taken as the average maximum conductance measured for each length, at potential of ≈0.86 V vs. SCE. The error bars are calculated from multiple measurements.
The changes of conductance with molecular length in the neutral molecule are smaller than those observed with the thiol-linked Car, where we found βN = 0.556 ± 0.09 (β = 0.22 ± 0.04 Å−1) (3). The difference may be attributed to the effect of the end groups on the alignment of molecular states with the Fermi level of the electrode. This effect arises because of the bond-dipole moment associated with the chemistry of the contact. The relative “gap” between the Fermi level and the orbitals of the molecule that mediate tunneling is shifted by an amount equal to the product of the electronic charge and the surface dipole moment. β depends on the square root of this quantity. This analysis is supported by the different value of G0: 14 ± 12 nS, compared with 37 ± 18 nS found for thiol-terminated similar Car. The thiol linker incorporates an additional methylene group, yet it shows better transport properties than the pyridine linker. These transport properties indicate a significantly worse electronic coupling of the pyridine–Au bond compared with the thiol–Au bond and might be explained by the bonding through the nitrogen electrons, whose orbital is orthogonal to the conjugated π-electron system in the aromatic ring and polyene chain.
The potential dependence of the single-molecule conductance is shown in Fig. 3a and generally shows an increase followed by a decrease with increasing surface potential. It is important to note that this trend also was observed when the potential was scanned in the high-to-low direction. Thus, these changes are generally reversible, even though the cyclic voltammetry (Fig. 2) shows poor reversibility. It appears that molecules that undergo nonreversible oxidations do not conduct well so that the reversible population dominates the data. We frequently found evidence of two types of data under similar experimental conditions: low-current (conductance) and high-current (conductance) data. Most experimental runs would show both features, whereas one or the other would dominate in others. Multiple conductance values have been reported in experiments like this on other molecules where they were attributed to different contact geometries (17, 18). In this case, the observation of coexisting low- conductance values can also be explained by the presence of more than one Car species near (or above) the oxidation potential (see the supporting information). Both sets of data are shown in Fig. 3a (squares are high-conductance values, and circles are coexisting low-conductance data). The low-conductance data show no systematic dependence of conductance on potential possibly because there really is no dependence, but it is also possible that the lower signal-to-noise ratio in these data hides any effect. We have therefore omitted these data from the analysis shown in Fig. 4, where we averaged the high-current data from repeated experiments (we show the range of measured values by the length of the error bars).
Fig. 4.
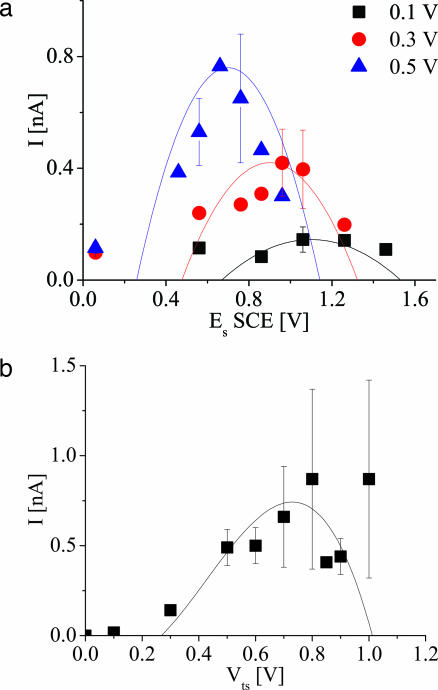
Current–voltage and current–potential characteristics of a single Car molecule. (a) Current–potential curves of single Car with nine double bonds measured with different tip-substrate bias (blue triangles, 0.5 V; red circles, 0.3 V; black squares, 0.1 V), compared with the curves calculated with the “molecular resistor” model (see text). The height of the peaks was adjusted to the measured peak current. (b) Single-molecule current–voltage data measured with surface potential held at 0.56 V vs. SCE (squares) and compared with curves calculated according to the molecular resistor model with no adjustable parameters. The symbols show average values, and the error bars show the range of measured values from repeated experiments.
The maximum enhancement in conductance owing to oxidation measured here is only ≈5-fold (Fig. 3a), much smaller than, for example, the effect of doping polyacetylene (19) or iodine-doping of Car films (20). These differences may be attributed to intermolecule interactions in the bulk materials that enhance the conductance in the charged state. Such interactions do not exist in our single-molecule measurements (21).
The charge in the Car radical cation Car·+ was shown to be delocalized over most of the polyene chain (22, 23). Therefore, we would expect that the conductance is enhanced and the electronic decay constant is reduced upon oxidation. Indeed, a reduced value of the empirically determined β parameter is found in the oxidized state (which probably includes the Car·+ among other species) compared with the neutral state (squares in Fig. 3b). We find βN = 0.28 ± 0.07 (β = 0.11 ± 0.03 Å−1). Such low β values reflect lowered sensitivity of the conductance to the barrier width (which can be related to chain length), suggesting that the change in the oxidation state results in intrinsic changes in electronic properties.
These measurements were made with bias applied across the molecule, which changes the local potential (6). This effect was probed directly by measuring the conductance as a function of the electrochemical potential, Es and the bias applied across the molecule, Vts (Fig. 4a). The potential for peak conductance varies linearly with applied bias, as was reported for similar measurements of oligoaniline molecules (6). Following Chen et al. (6), we fitted the conductance to a parabola (curves in Fig. 4a):
The data were fitted with α = 1, b = 1.2 V, and a = 7.8 nS/V2 (Fig. 4a). In the case of oligoaniline, this modification of the local potential resulted in negative differential resistance as the applied bias changed the oxidation state of the molecule. For the Car, the current vs. bias characteristic (at an otherwise fixed surface potential) also is highly nonlinear (Fig. 4b). Using the same the fitting parameters that were used to fit Eq. 1 to the conductance data in Fig. 4a, we predicted the current–voltage characteristic with no adjustable parameters (solid curve in Fig. 4b). The fit is surprisingly good. This fit demonstrates that the nonlinear current–voltage characteristic is a consequence of the change of oxidation state of the molecule induced by the applied probe bias.
A more microscopic model of redox-state-mediated charge transport has been proposed by Kuznetsov and Ulstrup (24) and others (7, 25). The energy of the redox state with relation to the tip and substrate Fermi levels is a critical parameter and is affected both by the surface potential (which shifts the redox state) and the bias (which shifts the tip or substrate Fermi levels with respect to the redox state). Kuznetsov and Ulstrup’s expression for the current–potential:
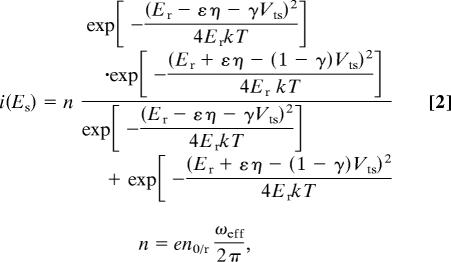 |
where Er is the reorganization Gibbs free energy; eη is the fraction of the overpotential drop at the redox site, eη = eEs − E0; E0 is the oxidation potential; γ is the fraction of the bias dropped at the redox site; k is the Boltzmann constant; n0/r is the number of electron transmitted; and ωeff is the effective vibrational frequency of the phonon associated with charging. It should be noted that the Kuznetsov–Ulstrup model assumes a tunneling gap between the STM tip and the molecule, whereas, in our case, the molecule is chemically bound to the tip. This model also could predict a peak in the general shape of the current–surface potential curve; the measured data were not fitted to this model because such fits required too many unknown fitting parameters. Additionally, the Kuznetsov–Ulstrup model predicts a decrease in peak width with decreasing bias, which was not observed in our experiments (Fig. 4a). We conclude that the observed changes in conductance result mostly from changes in the molecular properties as determined directly from the conductance vs. potential data in Fig. 3a.
When the bias is smallest (100 mV in our case), its effect on the local potential is minimal, and the peak position is expected to be near the potential that aligns the redox level with the electrodes’ Fermi levels. In the Marcus theory, the redox energy level ε0 is related to the redox potential E0 through ε0 = E0 + Er (26). If the mechanism is tunnel transport through states that do not relax as a result of the transport, then the conductance peak will be shifted from the formal potential by an amount equal to Er (27). Er is expected to be smaller than that determined from electrochemical measurements due to the very limited radius of the electrolyte shell involved and is estimated to be 0.25–0.5 eV (7, 24, 25, 27). In our case, the peak potential measured for a molecule with nine double bonds under bias of 0.1 V was ≈1.16 V (Fig. 4a), which is shifted ≈0.3 V from the measured oxidation potential. This analysis implies that transport is mediated by tunneling unaccompanied by relaxation with Er ≅ 0.4 ± 0.1 eV.
Conclusions
In this study, we have measured electron transport through single Car molecules under potential control in an STM break junction in an organic (oxygen- and water-free) environment. Oxidation of the Car resulted in the formation of radical cations and other molecular species. Electron transport was enhanced, and the decay of tunneling rate with distance was decreased at potentials close to the oxidation potential. This enhancement of tunneling points to an increase in the intrinsic molecular conductance upon oxidation. Our data show that the conductance of these electrochemically active molecules can be modified by the applied bias as well as by the electrochemical potential. Car molecules are therefore candidates for components in molecular electronic devices.
What light do these single-molecule data shed on the role of Car as an electron carrier in photosystem II (1, 2)? The molecular conductance G has been related to the electron transfer rate constant, ket, for charge transfer through a molecular bridge: (28, 29)
where DOS is the effective density of states associated with the standard Golden Rule formulation of the rate constant. Taking G ≅ 0.1 nS (the smallest conductance measured in this study for neutral Car with 11 double bonds) (Fig. 3a Bottom) yields ket = 0.28 × 10⁶ s−1 or τ = 3.5 μs, assuming Er = 0.4 eV. Taking G ≅ 2 nS (the largest conductance measured for Car with 9 double bonds under oxidizing potential) (Fig. 3a Middle) yields ket = 5.6 × 10⁶ s−1 or τ = 0.18 μs. Both time scales are significantly smaller than that assumed for electron transfer from QA− to P680+ via β-carotene in photosystem II (200 μs to 1 ms) (1, 30), indicating that the electron transfer is not limited by the transfer across the Car but more likely by other steps in the photoprotection mechanism. Additionally, it is likely that electron transfer in our system involves ballistic tunneling of many electrons as opposed to consecutive oxidation and reduction for the transfer of each electron. The latter process is the one suggested to occur in photosystem II, but we have shown that it is not required to explain the estimated electron transfer rates in the natural system. Although the exact oxidation state of Car in photosystem II may be difficult to ascertain [although it appears to be singly oxidized at low temperature (1, 2)], our measurements, which encompass a wide range of molecular potentials, show that oxidation is not required for the molecule to function in its photoprotective role.
Materials and Methods
The all-trans Car molecules measured consist of a polyene backbone of 7, 9, and 11 double bonds terminated at both ends by pyridine rings that serve as binding groups to the Au electrode via the nitrogen atom at positive potentials (14). The dipyridylcarotenes with 7, 9, and 11 double bonds were synthesized by double Wittig reactions under the conditions reported in refs. 3 and 31, in which 4-[(diphenylphosphoryl)methyl]pyridine, 10,10′-diapocarotene-10,10′-dial, 8,8′-diapocarotene-8,8′dial, and 6,6′-diapocatotene-6,6′-dial were used as starting materials. Pyridine was chosen as the binding group to prevent dimerization as commonly seen with thiol-binding groups. Similar transport measurements on a single bipyridine molecule show that the voltage drop on the contacts is expected to be negligible (11). A submonolayer of molecules was adsorbed on a Au(111) substrate (32), immediately after hydrogen flame annealing, from a solution in toluene (typical adsorption time was 18 h). The sample was then rinsed, dried under nitrogen, and placed into the electrochemical STM liquid cell. The presence of molecules on the surface and the submonolayer coverage were confirmed with Fourier transform infrared, contact angle measurements, and x-ray photoelectron spectroscopy (data not shown). The molecular structure was determined with MM2 energy minimization by using chem3d (CambridgeSoft, Cambridge, MA).
The electrolyte was tetrabutylammonium hexafluorophosphate (electrochemical grade; Fluka)/10 mM in propylene carbonate (99.7%, HPLC grade; Sigma–Aldrich). The counterelectrode was a platinum wire, and the surface potential was controlled with respect to a silver-wire, quasireference electrode. Potentials here are presented vs. SCE by calibration with ferrocene in similar electrolyte solution. All preparation processes and measurements were done in the dark under soft red light to prevent isomerization. To eliminate the presence of water or oxygen, all liquids were kept over molecular sieve type 3A for at least 12 h and thoroughly degassed in N2 flow before use, and the electrochemical STM cell was sealed and flushed with dried Ar or N2 before and during the measurements. Transport measurements were performed with a PicoSTM (Molecular Imaging, Tempe, AZ), and the current was recorded with a digital oscilloscope (model DL 750, Yokogawa, Tokyo). For transport measurement, the second electrode was a Au wire (0.25 mm in diameter, 99.999%, Premion) cut for use as an STM tip. The tips were partially insulated with high-density polyethylene in a process similar to that described in ref. 33 to reduce the Faradaic leakage current during current measurements. In contrast to conventional current–voltage measurements done with STM, here the molecule was chemically attached to both electrodes using the method described in ref. 11. Each current/conductance data point presented here is an average of 1,000–3,000 measurements of single molecules. The notation of potentials is such that the surface potential is applied (independently) to the substrate (vs. the quasireference electrode), and the bias is applied to the substrate with respect to the tip.
Supplementary Material
Acknowledgments
This work was supported by National Science Foundation Nanoscale Interdisciplinary Research Teams Grant ECS 01101175 and U.S. Department of Energy Grant DE-FG02-03ER15393. I.V.-F. was supported by the Fulbright program and the Yad Hanadiv–Rothschild Foundation for postdoctoral fellowships.
Abbreviations
- Car
carotenoid
- STM
scanning tunneling microscope
- SCE
standard calomel electrode.
Footnotes
Conflict of interest statement: No conflicts declared.
This paper was submitted directly (Track II) to the PNAS office.
References
- 1.Vrettos J. S., Stewart D. H., de Paula J. C., Brudvig G. W. J. Phys. Chem. B. 1999;103:6403–6406. [Google Scholar]
- 2.Faller P., Pascal A., Rutherford A. W. Biochemistry. 2001;40:6431–6440. doi: 10.1021/bi0026021. [DOI] [PubMed] [Google Scholar]
- 3.He J., Chen F., Li J., Sankey O. F., Terazono Y., Herrero C., Gust D., Moore T. A., Moore A. L., Lindsay S. M. J. Am. Chem. Soc. 2005;127:1384–1385. doi: 10.1021/ja043279i. [DOI] [PubMed] [Google Scholar]
- 4.Li J., Tomfohr J. K., Sankey O. F. Phys. E. 2003;19:133–138. [Google Scholar]
- 5.Ramachandran G. K., Tomfohr J. K., Li J., Sankey O. F., Zarate X., Primak A., Terazono Y., Moore T. A., Moore A. L., Gust D., et al. J. Phys. Chem. B. 2003;107:6162–6169. [Google Scholar]
- 6.Chen F., He J., Nuckolls C., Roberts T., Klare J. E., Lindsay S. M. Nano Lett. 2005;5:503–506. doi: 10.1021/nl0478474. [DOI] [PubMed] [Google Scholar]
- 7.Tao N. J. Phys. Rev. Lett. 1996;76:4066–4069. doi: 10.1103/PhysRevLett.76.4066. [DOI] [PubMed] [Google Scholar]
- 8.Gittins D. I., Bethell D., Schiffrin D. J., Nichols R. J. Nature. 2000;408:67–69. doi: 10.1038/35040518. [DOI] [PubMed] [Google Scholar]
- 9.Alessandrini A., Salerno M., Frabboni S., Facci P. Appl. Phys. Lett. 2005;86:133902. [Google Scholar]
- 10.Nitzan A., Ratner M. A. Science. 2003;300:1384–1389. doi: 10.1126/science.1081572. [DOI] [PubMed] [Google Scholar]
- 11.Xu B., Tao N. J. Science. 2003;301:1221–1223. doi: 10.1126/science.1087481. [DOI] [PubMed] [Google Scholar]
- 12.Khaled M., Hadjipetrou A., Kispert L. J. Phys. Chem. B. 1990;94:5164–5169. [Google Scholar]
- 13.Sawyer D. T., Sobkowiak A., Roberts J. L. J. Electrochemistry for Chemists. New York: Wiley; 1995. [Google Scholar]
- 14.Cunha F., Tao N. J., Wang X. W., Jin Q., Duong B., D’Agnese J. Langmuir. 1996;12:6410–6418. [Google Scholar]
- 15.Fungo F., Otero L., Durantini E., Thompson W. J., Silber J. J., Moore T. A., Moore A. L., Gust D., Sereno L. Phys. Chem. Chem. Phys. 2003;5:469–475. [Google Scholar]
- 16.Liu D., Gao Y., Kispert L. D. J. Electroanal. Chem. 2000;488:140–150. [Google Scholar]
- 17.He J., Sankey O., Lee M., Tao N.-J., Li X., Lindsay S. Faraday Discuss. Chem. Soc. 2006;131:145–154. doi: 10.1039/b508434m. [DOI] [PubMed] [Google Scholar]
- 18.Hu Y., Zhu H., Gao H., Guo H. Phys. Rev. Lett. 2005;95:156803. doi: 10.1103/PhysRevLett.95.156803. [DOI] [PubMed] [Google Scholar]
- 19.Shirakawa H., Louis E. J., McDiarmid A. G., Chiang C. K., Heeger A. J. J. Chem. Soc. Chem. Comm. 1977:578–580. [Google Scholar]
- 20.Sen S., Pal P., Misra T. N. J. Mater. Sci. 1993;28:1367–1371. [Google Scholar]
- 21.Heinze J., Tschuncky P., Smie A. J. Solid State Electrochem. 1998;2:102–109. [Google Scholar]
- 22.Ehrenfreund E., Moses D., Heeger A. J., Cornil J., Bredas J. L. Chem. Phys. Lett. 1992;196:84–90. [Google Scholar]
- 23.Lutnaes B. F., Kildahl-Andersen G., Krane J., Liaaen-Jensen S. J. Am. Chem. Soc. 2004;126:8981–8990. doi: 10.1021/ja0492541. [DOI] [PubMed] [Google Scholar]
- 24.Zhang J., Grubb M., Hansen A. G., Kuznetsov A. M., Boisen A., Wackerbarth H., Ulstrup J. J. Phys. Condens. Matter. 2003;15:S1873–S1890. [Google Scholar]
- 25.Mazur U., Hipps K. W. J. Phys. Chem. 1995;99:6684–6688. [Google Scholar]
- 26.Marcus R. A. J. Chem. Phys. 1965;43:679–701. [Google Scholar]
- 27.Schmickler W., Widrig C. J. Electroanal. Chem. 1992;336:213–221. [Google Scholar]
- 28.Nitzan A. J. Phys. Chem. A. 2001;105:2677–2679. [Google Scholar]
- 29.Adams D. M., Brus L., Chidsey C. E. D., Creager S., Creutz C., Kagan C. R., Kamat P. V., Lieberman M., Lindsay S. M., Marcus R. A., et al. J. Phys. Chem. B. 2003;107:6668–6697. [Google Scholar]
- 30.Hanley J., Deligiannakis Y., Pascal A., Faller P., Rutherford A. W. Biochemistry. 1999;38:8189–8195. doi: 10.1021/bi990633u. [DOI] [PubMed] [Google Scholar]
- 31.Arrhenius T. S., Blanchard-Desce M., Devolaitzky M., Lehn J.-M., Malthete J. Proc. Natl. Acad. Sci. USA. 1986;83:5355–5399. doi: 10.1073/pnas.83.15.5355. [DOI] [PMC free article] [PubMed] [Google Scholar]
- 32.DeRose J. A., Thundat T., Nagahara L. A., Lindsay S. M. Surf. Sci. 1991;256:102–108. [Google Scholar]
- 33.Nagahara L. A., Thundat T., Lindsay S. M. Rev. Sci. Instrum. 1989;60:3128–3130. [Google Scholar]
Associated Data
This section collects any data citations, data availability statements, or supplementary materials included in this article.


