

Abstract
We previously reported a linkage region on chromosome 10q for age-at-onset (AAO) of Alzheimer (AD) and Parkinson (PD) diseases. Glutathione S-transferase, Omega-1 (GSTO1) and the adjacent gene GSTO2, located in this linkage region, were then reported to associate with AAO of AD and PD. To examine whether GSTO1 and GSTO2 (hereafter referred to as GSTO1h) are responsible for the linkage evidence, we identified 39 families in AD that lead to our previous linkage and association findings. The evidence of linkage and association was markedly diminished after removing these 39 families from the analyses, thus providing support that GSTO1h drives the original linkage results. The maximum average AAO delayed by GSTO1h SNP 7-1 (rs4825, A nucleotide) was 6.8 (± 4.41) years for AD and 8.6(± 5.71) for PD, respectively. This is comparable to the magnitude of AAO difference by APOE-4 in these same AD and PD families. These findings suggest the presence of genetic heterogeneity for GSTO1h’s effect on AAO, and support GSTO1h’s role in modifying AAO in these two disorders.
Keywords: Alzheimer disease, GSTO1, Age at onset, Association, Linkage
1. Introduction
We have previously reported that a variation in the Glutathione S-transferase omega-1 genes (GSTO1) modifies the age-at-onset (AAO) of Alzheimer (AD) and Parkinson (PD) diseases [8]. Our study found that the Ala140Asp (rs4825, SNP 7 in Li et al.[8]) polymorphism in exon 4 of GSTO1 was significantly associated with the AAO of both AD and PD (P=0.007 for AD and P=0.026 for PD, respectively). In terms of an allelic effect on AAO, we reported that the A nucleotide change at SNP 7 (SNP 7-1 allele), resulting in the less common aspartate (Asp) amino acid change, is associated with a later AAO. This association of GSTO1 with AAO of AD was recently corroborated by others [5].
A second polymorphism, lying in the promoter (SNP 9, rs2297235) of GSTO2, was also found to be highly associated with AAO in both disorders (P=0.005 for AD and P=0.042 for PD, respectively). GSTO2 lies adjacent to GSTO1, and SNPs 7 and 9 are in strong linkage disequilibrium (LD) (r2= 0.89 by Li et al. [8] and r2= 1.0 by Perlegen (http://genome.perlegen.com) [4]), implying that the observed associations were actually the same event. Thus, owing to the strong LD between these two markers, it is difficult to differentiate between the roles of GSTO1 and GSTO2 on this AAO effect. GSTO1 was the main focus of our previous report for several reasons. First, GSTO1 is significantly differentially expressed in AD hippocampus versus control [8]. Second, GSTO1 has been shown to be involved in the processing of interleukin 1-β, a proinflammatory cytokine and known to be overexpressed in AD and PD brains [8]. Finally, SNP7 has been shown to affect the functional activity of the enzyme versus some substrates [11]. To date, little data is available related to the function of GSTO2. Therefore, it is difficult to assess the potential biological role of GSTO2 in AD and PD. For the purpose of this study, which is to measure the effect of this association, we will refer to this association as the GSTO1 haplotype (GSTO1h), acknowledging the potential contributions of either or both genes.
To support our initial report, we use three different approaches to further investigate the role of GSTO1h in both AD and PD. First, the methodology used for the previous association analysis, the orthogonal model (OM) [1] and Monks-Kaplan method (MK) [10] from the QTDT program do not provide an estimate of how many years the polymorphisms of GSTO1h shift the AAO. To evaluate this effect, we used several different approaches to compute and confirm the AAO difference between SNP 7-1 carriers and SNP 7-22 individuals for each family and examined their distributions in the overall data set, as well as other stratified data sets related to the association results.
Second, if GSTO1h is the gene that provided our initial AAO linkage results to chromosome 10q [9], then stratifying the data set based on the association results should affect the linkage results. Here, we have identified a set of AD families that contribute to both linkage results of chromosome 10q and association results of GSTO1h.
Finally, in our previous linkage study of AAO in AD [9], we found no evidence to suggest that the linkage results were driven by families from any specific ascertainment center. Here, we examined whether the same conclusion holds for our association study.
2. Materials and methods
2.1 Data set
The AD data set used in the previous GSTO1h association study [8] includes 606 multiplex and 105 discordant sibpairs families (N=711 total AD families, hereafter referred to as the association data set), in which 441 families (437 multiplex and 4 singleton families) were included in the previous genomic screen study [9] (Table 1). There were 173 families ascertained through Indiana Alzheimer’s Disease Research Center National Cell Repository (IADRC), 399 from the National Institute of Mental Health (NIMH), and 139 from Duke University and collaborators (Duke). The PD data set, which was also used in the previous study mentioned above, included 282 multiplex families and 16 discordant sibpairs [8]. In this study, we examined the four SNPs, 5 (rs11191972), 6 (rs2164624), 7 (rs4925), and 8 (rs1147611) (Table 4 in Li et al.[8]), genotyped for GSTO1 in the AD data set. A subset of analysis focused primarily on SNP 7 in both AD and PD because it provided the strongest significant association with AAO and is a part of GSTO1h.
Table 1.
Summary of family data.
|
Number of Families |
|||
|---|---|---|---|
| Overall data | Positive subseta | Negative subseta | |
| Linkage data set | 449 | 215 | 234 |
| Association data set | 711 | 128 | 104 |
| Both data sets | 441 | 39 | 45 |
Positive/negative subsets were based on the family specific LOD score (for linkage) and MK score (for association).
2.2 Dissecting linkage and association signals in AD
In our previous genomic screen study, there were 18 microsatellite markers genotyped on chromosome 10. The reported linkage peak for AAO of AD was at D10S1237 with the highest LOD score of 2.39 [9]. To identify the subset of families that influence both linkage and association signals, we computed LOD scores using the PEDLOD analysis in SOLAR and the Monks-Kaplan statistic (hereafter called MK score) based on the TQP and TQS described by Monks and Kaplan [10] for each family. The family-specific LOD score was computed based on D10S1237. The family-specific MK score was computed based on the presence of SNP 7-1 allele (SNP 7-1 allele is associated with later AAO in the families). Clearly, the number of informative families for computing the MK score is affected by SNP 7-1 allele frequency and the availability of AAO information.
To dissect the relationship between association and linkage signals in the original linkage data set, we performed two sets of analysis. First, we applied the same association tests to the data set previously used for the AD AAO linkage study [9] as well as the subsets of families with positive and negative LOD scores. Second, we applied an ad hoc approach to search for a set of families that potentially influence both linkage and association. That is, we removed a set of families from the linkage data set that have both positive MK and LOD scores. We then performed SOLAR linkage analysis on this new data set and compared the results to the previously reported linkage results on chromosome 10. We also applied the same approach to the AD association data set previously used for studying GSTO1 [8]. In other words, we removed the same set of families from the association data set and tested it by the OM and MK methods.
2.3 The effect on AAO by SNP 7
We evaluated the differences in AAO attributed to SNP 7 in three AD data sets: the overall AD data set, the positive association subset representing the families with SNP 7-1 allele associated with later AAO (families with positive MK scores), and the set of families that showed both positive linkage and association signals. Within each family, we computed the average AAO for SNP 7-1 carriers (11 and 12) and SNP 7-22 subjects, respectively, and their difference. We, then, obtained the average and standard deviation of AAO differences between SNP 7-1 carriers and SNP 7-22 individuals for each data set.
Since significant association was also found between SNP 7 and AAO of PD, we applied the same approaches described above to examine the AAO differences between SNP 7-1 carriers and SNP 7-22 individuals within each family for PD. That is, we examined both the overall PD data set and a subset of families with SNP 7-1 allele associated with late AAO of PD for the AAO differences.
We also examined the AAO differences due to Apolipoprotein E (APOE) in our data sets. APOE is a confirmed gene that affects the risk and AAO of AD [3] and PD [7]. In addition, the AAO effect of APOE was also confirmed by our previous genomic screen study with a LOD score of 3.28 [9]. APOE possesses three functional polymorphisms (APOE-2, -3, and -4), in which individuals who carry APOE-4 alleles tend to have an earlier AAO (opposite to SNP 7-1 allele). Therefore, the magnitude of years that APOE-4 accelerates the onset of the disease will provide us a baseline to evaluate the effect size of SNP 7 on AAO of AD and PD. Similarly, we computed the family-specific MK score based on the allele counts of APOE-4 and then identified a subset of families representing APOE-4 allele associated with early AAO (the positive association subset) for AD and PD, respectively. The AAO differences were computed for APOE-4 carriers versus non-APOE-4 carriers and APOE-44 individuals versus non-APOE-4 carriers in the overall data set and the positive association subset.
2.4 The effect of ascertainment centers
In order to evaluate whether families from any specific ascertainment center are the driving force of the GSTO1h association, we first examined whether the association results of GSTO1h changed by incorporating the ascertainment center as a covariate in the QTDT OM analysis [1]. Second, we stratified the analysis by ascertainment sites in order to evaluate the association of GSTO1h within each data set. We used both OM and MK methods in the stratification analysis.
3. Results
Among the 449 families used in our previous linkage study of AD [9] (hereafter referred to as the linkage data set), the PEDLOD analysis identified 215 families with positive LOD score (positive linkage subset) and 234 families with negative LOD score (negative linkage subset). Among 711 AD families in the association data set, we identified 232 families that are informative for computing MK scores at SNP 7, in which 128 families show positive MK scores (positive association subset) and 105 families show negative MK scores (negative association subset). Overall, only 39 families (15 IADRC, 21 NIMH, and 3 DUKE) from the positive association subset overlap with the positive linkage subset (Table 1).
Both SNP 7 and SNP 8 showed significant association with AAO in the linkage data set (e.g. P=0.004 for SNP 7 and 0.019 for SNP 8 by OM method, Table 2) and marginally significant results in positive linkage subset (P=0.036 for SNP 7 and 0.042 for SNP 8 by OM method). A marginally significant result was also observed for SNP 7 in the negative linkage subsets (P=0.05 by OM method). Interestingly, SNP 8 became significant in both the linkage data set and the positive linkage subset, which was not observed in the association data set. The families in the linkage data sets may contribute stronger association signals of GSTO1 than those additional families included in the association data set.
Table 2.
Results of family-based association tests for AAO using the orthogonal model (OM) [1] and Monks-Kaplan method (MK) [10] for the overall data set, each ascertainment site (NIMH, IADRC, and DUKE), and linkage data sets.
|
GSTO1 |
|||||
|---|---|---|---|---|---|
| Data Set (No. of Families) | Method | SNP 5 | SNP 6 | SNP 7 | SNP 8 |
| AD Association data set (711) | OM | 0.185 | 0.176 | 0.007 | 0.096 |
| MK | 0.281 | 0.117 | 0.023 | 0.132 | |
| AD Association data set (711) | OM with covariate at center* | 0.227 | 0.259 | 0.011 | 0.143 |
| OM | 0.617 | 0.488 | 0.024 | 0.067 | |
| NIMH (399) | MK | 0.556 | 0.319 | 0.05 | 0.068 |
| OM | 0.093 | 0.153 | 0.177 | 0.179 | |
| IADRC (173) | MK | 0.133 | 0.166 | 0.204 | 0.345 |
| OM | 0.68 | 0.862 | 0.689 | 0.351 | |
| DUKE (139) | MK | 0.765 | 0.564 | 0.773 | 0.557 |
| AD linkage data set (449) | OM | 0.365 | 0.389 | 0.004 | 0.019 |
| MK | 0.419 | 0.460 | 0.003 | 0.018 | |
Including index of ascertainment centers as a covariate in the OM method.
The SOLAR linkage analysis was performed on the linkage data set without the 39 families that show both positive linkage and association signals. Figure 1 depicts the multipoint results of chromosome 10 from the original genomic screen of AAO in AD [9] and the new data set that excludes the 39 families from the linkage data set, respectively. Similar multipoint curves were observed in both linkage analyses, but the linkage peak was markedly diminished after removing the 39 families. To reinforce the significant effect of these 39 families, we also performed the same analysis by excluding all families with positive MK scores that overlap with the linkage data set (93 out of 128 families). The multipoint linkage curve falls between the ones from the above two linkage analyses (Figure 1) suggesting that 39 families have the strongest effect on the linkage signals observed in chromosome 10q. Furthermore, the association tests performed on the data set (672 families) that excludes the 39 families from the association data set did not detect any significant results in all four GSTO1 SNPs either (e.g. P=0.338 for SNP 7 by MK method). The significantly different results derived from these two data sets (with and without the 39 families) suggest that these 39 families are the driving force of both linkage and association observed in chromosome 10q and GSTO1h for AAO in AD.
Figure 1.
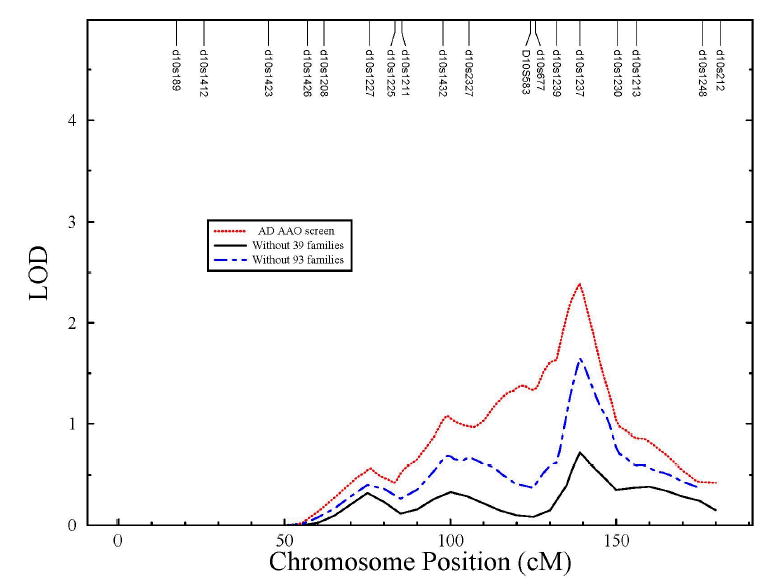
Comparison of the multipoint linkage results for AAO on chromosome 10 using the full linkage data set [9] (dot line), the same data set without the 39 families showing positive association and linkage information (solid line), and the same linkage data set without families with positive MK scores (93 families) (dash-dot line).
Clinical review of the 39 families revealed more multi-generation families when compared to the 45 families with negative LOD and MK scores (Table 1). The average number of affected individuals per family was similar between the 39 families (2.6 per family) and the 45 “negative” families (2.4 per family). However, the intra-family AAO correlation is smaller in the 39 families than the 45 families (0.15 vs. 0.22), which implies larger within-family AAO variation in the 39 families data set.
The pattern of the average AAO difference between SNP 7-1 carriers and SNP 7-22 subjects for each AD data set is the following: 1.6 (± 7.17) years for the overall AD data set (232 informative families); 6.8±4.41 years for the positive association subset (128 families); 7.9±4.78 years for the 39 families that showed positive association and linkage signals (Figure 2). We also computed the average AAO differences by SNP 7-1 allele using 282 multiplex PD families that were previously studied [8]. As described earlier, the MK score can be computed only in the informative families, that is, families whose siblings have AAO information and carry different numbers of SNP 7-1 allele. In our PD data set, only 57 families were informative for SNP 7-1 allele and 35 families showed positive association with AAO. The reduction of informative families is consistent with the frequency of SNP 7-1 allele (31.6%) in PD. The number of years that SNP 7-1 allele delays the onset of PD is similar to AD with a larger standard deviation, that is, 1.9±11.01 years in the overall PD and 8.6±5.71 years in the positive association families.
Figure 2.
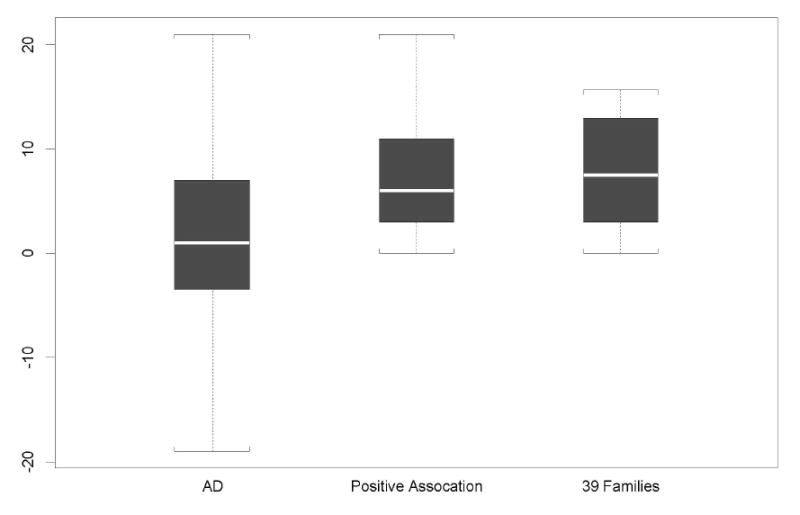
The distribution of AAO differences between the SNP 7-1 carriers and SNP 7-22 individuals in the overall AD data set, positive association subset, and the 39 families with strong association and linkage signals.
In the overall AD data set, there are 156 families in which at least one individual carried an APOE-4 allele. The average AAO difference between APOE-4 carriers and their non-APOE-4 siblings is 2±6.98 years. This difference increases to 4.7±8.21 years when we compared APOE-44 individuals with their non-APOE-4 siblings. A clear dose effect by APOE-4 was observed. However, the average AAO difference increases even more in a set of 96 families that show positive association between APOE-4 and early AAO of AD, that is, 6.3±4.44 years between APOE-4 carriers and their non-APOE-4 siblings. Only nine out of 96 positive associated families have APOE-44 individuals, in which the average AAO difference between APOE-44 and non-APOE-4 carriers was 10.8±5.16 years.
The AAO differences by APOE-4 in PD were not much different from that in AD. In total, only 45 families are informative for computing AAO differences based on APOE-4. APOE-4 carriers show an average of 1.8±9.94 years earlier onset than non-APOE-4 carriers in PD. This difference increases to 8.4±6.58 years in a set of 23 families that show positive association between APOE-4 and early AAO of PD. Clearly, larger standard deviations were found in PD than in AD, which are likely due to the small number of informative families in PD. We do not show the AAO differences between APOE-44 and non-APOE-4 carriers for each family here, because the number of informative families was very small (3 families).
Finally, we examined whether different ascertainment centers have an effect on the association results of GSTO1h in AD. Similar pattern of association results remain between the analyses with and without center effect as a covariate in AD data set. In other words, only SNP 7 showed significant results (P=0.011, Table 2), suggesting that the correction of multiple ascertainment sites does not influence the results of GSTO1h association with AAO in AD. This is consistent with what we found in a previous linkage study of AAO of AD [9]. For the association analysis in each subset stratified by ascertainment center, SNP 7 was found to be significant only in the NIMH data set, but not in the IADRC and Duke data sets. It is possible that NIMH families are more informative for the markers demonstrating association between GSTO1h and AAO. However, smaller sample sizes in IADRC and Duke may be a reason for this inconsistency as well.
4. Discussion
We have previously reported three lines of evidence including genetic linkage, gene expression, and allelic association as supporting a strong effect in modifying AAO in AD and PD [8] for a GSTO1-GSTO2 haplotype (GSTO1h) [8]. In addition, the biological function of GSTO1 suggests that this is most likely the functional causal gene, although we cannot rule-out GSTO2 at this time. GSTO1 has been reported to be involved in the activation of Interleukin-1β (IL-1β), a fundamental component in the inflammatory response [6]. Benner et al [2] has demonstrated that passive immunization can significantly reduce the loss of dopamine neurons in the MPTP mouse, providing further support to inflammation as a modifier of neurodegeneration. In addition, recently Kölsch et al [5] has confirmed an association of GSTO1 with AAO in AD, as well as vascular dementia and stroke, although with the opposite allele for late AAO to the one that we originally reported. We have rechecked our allele correlation results and confirmed our original findings. The reason for this difference is not clear, but it could suggest that this SNP, while a marker for the association, is not the actual causal factor. In addition, Whitbread et al [12] reported no association of GSTO1 and AAO in a case-control study of PD, in which they only compare in overall AAO between genotypes. Given the genetic heterogeneity and small AAO differences between SNP 7 genotypes seen in our overall AD and PD data sets, such a case-control study may have less power to detect the AAO effect than family-based approaches.
Since linkage analysis is often the initial step in a gene identification study, a frequently asked question is whether the subsequent candidate gene identified by association tests in the linkage peak explains the original linkage results. To investigate this question for GSTO1h, we used the AD data set to explore possible answers. We first computed the contribution of association signals (the MK score) from each family at the SNP 7, the main contributor to the significant association results. Since SNP 7-1 allele showed positive association with AAO by the MK test, it implies that the total positive MK score is significantly greater than the total negative MK score at SNP 7 when the SNP 7-1 allele is coded as the target allele. Presumably, there should be a set of families with positive MK scores significantly influencing the association results in GSTO1h as well as the linkage results of chromosome 10.
Here, we identified 39 families that strongly affect the linkage results of chromosome 10 [9] and the association results of GSTO1h [8], supported by the following two experiments (1) the peak LOD score of chromosome 10 dropped from 2.39 to 0.72 after removing these 39 families from the linkage data set; (2) the SNP 7 of GSTO1 was no longer significant in the QTDT analysis when these 39 families were excluded from the association data set (P=0.338). We believe that the strategies presented here for identifying a set of families that link both linkage and association signals are potentially useful for other similar studies.
Since the MK test detected a positive association between SNP 7-1 and AAO, one may expect that all families with positive MK scores showed the strongest effect on the linkage results. However, we observed only a marginal decrease of LOD score by excluding this set of families (93 families) from the linkage data set (Figure 1). This is likely due to the fact that 54 out of the 93 families had negative linkage signals. This points out that not all families with a positive association MK score at SNP 7-1 allele are also having strong linkage signals to AAO in AD in the linkage region of chromosome 10q. Our analysis showed that the 39 families represent the subset that impacts both linkage of chromosome 10q and association of GSTO1h with AAO in AD. This would suggest further heterogeneity in the AD phenotype, at least in terms of modifying factors, with a subset of families being more influenced by the GSTO1h than others.
In practice, it is more important to quantify GSTO1h’s effect on delaying the onset of AD than to simply report significant p-values from association tests. However, the answer is potentially confounded by the level of genetic heterogeneity in the data and how informative the family is for the SNPs involved. Therefore, in considering all the SNP 7-1 carriers, the delay of AAO in AD is only 1.6 years on average, but with a large standard deviation (± 7.17). However, for all families with positive association signal with the SNP 7-1 allele (128 families), the SNP 7-1 carriers showed 6.8 years on average later onset than SNP 7-22 individuals with a much smaller standard deviation (± 4.41), which explains the homogeneity in this subset.
Similar average AAO differences were observed in PD, but the standard deviation of AAO differences was larger in PD than AD (11.01 vs. 7.17 in the overall data sets). It should be noted that our PD data set is much smaller than AD, and this could explain why association results of GSTO1h on AAO were more moderate in PD than in AD. Interestingly, we found the magnitude of GSTO1h’s effect on AAO of AD and PD is comparable to APOE. This finding is encouraging, because it demonstrates that the effect size of GSTO1h on AAO is actually quite strong. However, APOE should still account for more of an overall genetic effect than GSTO1 because of its role in controlling both risk and AAO, and the strong dose effect by APOE-4 that we have not yet observed in GSTO1.
Our overall analysis showed that the 39 families with positive association and linkage signals are the key members contributing to the finding of linkage of chromosome 10q and GSTO1h association with AAO in AD. While it is important to further dissect the clinical similarity among these 39 families, we took the first step to examine the AAO information in this set of families. The average AAO of these 39 families was 73 (± 7.5), which is similar to the overall average of AAO in the association data set (71.5±8.1) and linkage data set (72.8±6.8). However, the average AAO difference between SNP 7-1 carriers and SNP 7-22 individuals increases to 7.9 years in the 39 families. Furthermore, the intra-family AAO variance is greater in these 39 families than the 45 families (negative linkage and association families). Clearly, the variation of AAO among siblings in these 39 families leads to the significant association between SNP 7-1 and late AAO of AD.
In summary, we have presented several analytical approaches that allow us to provide additional insightful information about GSTO1h in AD and PD. The delay of AAO by GSTO1h can be as long as 13 years in both AD and PD. We believe that the effect size of GSTO1 is large as it delays onset in a similar scale to APOE-4, which plays a different role in accelerating onset of AD and PD. We have previously presented an association analysis of GSTO1 by treating the number of APOE-4 allele as a covariate and found that the association results of GSTO1 were not affected by APOE [8]. This evidence further demonstrates the important role of GSTO1 and GSTO2 in modifying AAO of AD and PD.
Acknowledgments
We thank the patients with Alzheimer disease and their families whose help and participation made this work possible. We also thank the personnel of the Duke Center for Human Genetics, Vanderbilt Center for Human Genetics Research, and the Joseph and Kathleen Bryan Alzheimer Disease Research Center. Furthermore, we thank Dr. Donald E. Schmechel for his help on our AD ascertainment. This work was supported by the National Institute of Health (NIH) NS311530 (JMV), AG021547 (MPV), AG19757 (MPV), and AG05128 (MPV) grants; a T.L.L. Temple Award (TLL-97-012) and a Zenith Award (ZEN-01-2935) from the Alzheimer’s Association (MPV); the 2001 Louis D. award from the Institut de France (MPV); an American Federation for Aging Research (AFAR) 2002 Research Grant (YJL); and a New Investigator Research Grant Award (Hilles Families Foundation Award) from the Alzheimer’s Association (YJL). We appreciate the biomaterial and clinical data contributed by Indiana Alzheimer’s Disease Research Center National Cell Repository (IADRC). The National Institute of Mental Health (NIMH) data and biomaterials were collected in three projects that participated in the NIMH Alzheimer Disease Genetics Initiative. From 1991–98, the Principal Investigators and Co-Investigators were: Massachusetts General Hospital, Boston, MA, U01 MH46281, Marilyn S. Albert, Ph.D., and Deborah Blacker, M.D., Sc.D.; Johns Hopkins University, Baltimore, MD, U01 MH46290, Susan S. Bassett, Ph.D., Gary A. Chase, Ph.D., and Marshal F. Folstein, M.D.; University of Alabama, Birmingham, AL, U01 MH46373, Rodney C.P. Go, Ph.D., and Lindy E. Harrell, M.D.
References
- 1.Abecasis GR, Cardon LR, Cookson WO. A general test of association for quantitative traits in nuclear families. Am J Hum Genet. 2000;66:279–292. doi: 10.1086/302698. [DOI] [PMC free article] [PubMed] [Google Scholar]
- 2.Benner EJ, Mosley RL, Destache CJ, Lewis TB, Jackson-Lewis V, Gorantla S, Nemachek C, Green SR, Przedborski S, Gendelman HE. Therapeutic immunization protects dopaminergic neurons in a mouse model of Parkinson's disease. Proc Natl Acad Sci (USA) 2004;101:9435–9440. doi: 10.1073/pnas.0400569101. [DOI] [PMC free article] [PubMed] [Google Scholar]
- 3.Corder EH, Saunders AM, Strittmatter WJ, Schmechel DE, Gaskell PC, Small GW, Roses AD, Haines JL, Pericak-Vance MA. Gene dose of apolipoprotein E type 4 allele and the risk of Alzheimer's disease in late onset families. Science. 1993;261:921–923. doi: 10.1126/science.8346443. [DOI] [PubMed] [Google Scholar]
- 4.Hinds DA, Stuve LL, Nilsen GB, Halperin E, Eskin E, Ballinger DG, Frazer KA, Cox DR. Whole-genome patterns of common DNA variation in three human populations. Science. 2005;307:1072–1079. doi: 10.1126/science.1105436. [DOI] [PubMed] [Google Scholar]
- 5.Kolsch H, Linnebank M, Lutjohann D, Jessen F, Wullner U, Harbrecht U, Thelen KM, Kreis M, Hentschel F, Schulz A, von Bergmann K, Maier W, Heun R. Polymorphisms in glutathione S-transferase omega-1 and AD, vascular dementia, and stroke. Neurology. 2004;63:2255–2260. doi: 10.1212/01.wnl.0000147294.29309.47. [DOI] [PubMed] [Google Scholar]
- 6.Laliberte RE, Perregaux DG, Hoth LR, Rosner PJ, Jordan CK, Peese KM, Eggler JF, Dombroski MA, Geoghegan KF, Gabel CA. Glutathione s-transferase omega 1-1 is a target of cytokine release inhibitory drugs and may be responsible for their effect on interleukin-1beta posttranslational processing. J Biol Chem. 2003;278:16567–16578. doi: 10.1074/jbc.M211596200. [DOI] [PubMed] [Google Scholar]
- 7.Li YJ, Hauser MA, Scott WK, Martin ER, Booze MW, Qin XJ, Walter JW, Nance MA, Hubble JP, Koller WC, Pahwa R, Stern MB, Hiner CB, Jankovic J, Goetz CG, Small GW, Mastaglia F, Haines JL, Pericak-Vance MA, Vance JA. Apolipoprotein E controls the risk and age at onset of Parkinson Disease. Neurology. 2004;62:2005–2009. doi: 10.1212/01.wnl.0000128089.53030.ac. [DOI] [PubMed] [Google Scholar]
- 8.Li YJ, Oliveira SA, Xu P, Martin ER, Stenger JE, Scherzer CR, Hauser MA, Scott WK, Small GW, Nance MA, Watts RL, Hubble JP, Koller WC, Pahwa R, Stern MB, Hiner BC, Jankovic J, Goetz CG, Mastaglia F, Middleton LT, Roses AD, Saunders AM, Schmechel DE, Gullans SR, Haines JL, Gilbert JR, Vance JM, Pericak-Vance MA, Hulette C, Welsh-Bohmer KA. Glutathione S-transferase omega-1 modifies age-at-onset of Alzheimer disease and Parkinson disease. Hum Mol Genet. 2003;12:3259–3267. doi: 10.1093/hmg/ddg357. [DOI] [PubMed] [Google Scholar]
- 9.Li YJ, Scott WK, Hedges DJ, Zhang F, Gaskell PC, Nance MA, Watts RL, Hubble JP, Koller WC, Pahwa R, Stern MB, Hiner BC, Jankovic J, Allen FA, Jr, Goetz CG, Mastaglia F, Stajich JM, Gibson RA, Middleton LT, Saunders AM, Scott BL, Small GW, Nicodemus KK, Reed AD, Schmechel DE, Welsh-Bohmer KA, Conneally PM, Roses AD, Gilbert JR, Vance JM, Haines JL, Pericak-Vance MA. Age at onset in two common neurodegenerative diseases is genetically controlled. Am J Hum Genet. 2002;70:985–993. doi: 10.1086/339815. [DOI] [PMC free article] [PubMed] [Google Scholar]
- 10.Monks SA, Kaplan NL. Removing the sampling restrictions from family-based tests of association for a quantitative-trait locus. Am J Hum Genet. 2000;66:576–592. doi: 10.1086/302745. [DOI] [PMC free article] [PubMed] [Google Scholar]
- 11.Tanaka-Kagawa T, Jinno H, Hasegawa T, Makino Y, Seko Y, Hanioka N, Ando M. Functional characterization of two variant human GSTO 1-1s (Ala140Asp and Thr217Asn) Biochem Biophys Res Commun. 2003;301:516–520. doi: 10.1016/s0006-291x(02)03066-8. [DOI] [PubMed] [Google Scholar]
- 12.Whitbread AK, Mellick GD, Silburn PA, Le Couteur DG, Board PG. Glutathione transferase Omega class polymorphisms in Parkinson disease. Neurology. 2004;62:1910–1911. doi: 10.1212/01.wnl.0000125282.09308.b1. [DOI] [PubMed] [Google Scholar]