

Abstract
PAR [poly(ADP-ribose)] is a structural and regulatory component of multiprotein complexes in eukaryotic cells. PAR catabolism is accelerated under genotoxic stress conditions and this is largely attributable to the activity of a PARG (PAR glycohydrolase). To overcome the early embryonic lethality of parg-knockout mice and gain more insights into the biological functions of PARG, we used an RNA interference approach. We found that as little as 10% of PARG protein is sufficient to ensure basic cellular functions: PARG-silenced murine and human cells proliferated normally through several subculturing rounds and they were able to repair DNA damage induced by sublethal doses of H2O2. However, cell survival following treatment with higher concentrations of H2O2 (0.05–1 mM) was increased. In fact, PARG-silenced cells were more resistant than their wild-type counterparts to oxidant-induced apoptosis while exhibiting delayed PAR degradation and transient accumulation of ADP-ribose polymers longer than 15-mers at early stages of drug treatment. No difference was observed in response to the DNA alkylating agent N-methyl-N′-nitro-N-nitrosoguanidine, suggesting a specific involvement of PARG in the cellular response to oxidative DNA damage.
Keywords: DNA damage response, H2O2, N-methyl-N′-nitro-N-nitrosoguanidine (MNNG), poly(ADP-ribose) glycohydrolase (PARG), silencing, RNA interference
Abbreviations: 3-AB, 3-aminobenzamide; ADP-HPD, ADP (hydroxymethyl)pyrrolidinediol; ARH3, ADP-ribosyl-(arginine)-hydrolase 3; DTNB, 5,5′-dithiobis-(2-nitrobenzoic acid); DTT, dithiothreitol; DMEM, Dulbecco's modified Eagle's medium; FBS, fetal bovine serum; GAPDH, glyceraldehyde-3-phosphate dehydrogenase; MEF, mouse embryonic fibroblast; MNNG, N-methyl-N′-nitro-N-nitrosoguanidine; NLS, nuclear localization signal; PAR, poly(ADP-ribose); PARG, PAR glycohydrolase; PARP, PAR polymerase; PCNA, proliferating-cell nuclear antigen; PI3K, phosphoinositide 3-kinase; RNAi, RNA interference; siRNA, small interfering RNA; SVPDE, snake venom phosphodiesterase
INTRODUCTION
PAR [poly(ADP-ribose)] comprises a group of negatively charged, variably sized ADP-ribose polymers with a branching frequency of up to 3% [1]. PAR occurs in almost every major compartment in eukaryotic cells except Saccharomyces cerevisiae and Schizosaccharomyces pombe [2]; it is synthesized by a large family of PARPs (PAR polymerases) that are expressed with differential abundance and subcellular localization [3]. In the nucleus, most of the PAR stays covalently bound to PARP-1, while approx. 5–10% becomes covalently attached to non-PARP proteins [2]. The turnover of PAR is tightly regulated; its catabolic half-life ranges from seconds to hours depending on polymer size, complexity, protein associations and the particular stress conditions to which cells are exposed [1–4]. PAR catabolism to ADP-ribose is catalysed by PARG (PAR glycohydrolase) [4]. The co-ordinate action of PARPs and PARG is required for proper cellular response to DNA damage and maintenance of genomic stability [2–4]. Although the role of PARPs has been extensively studied [2,3,5–7], the function of PARG is still unclear. A number of PARG-inhibitor studies employing tannins, a class of plant-derived polyphenols, suggested a role in oxidative stress-induced cytotoxicity [8,9]. However, the specificity of tannins has been recently challenged [10]; at least some of the cellular effects elicited by these compounds seem unrelated to the inhibition of PARG activity. Erdèlyi et al. [11] have shown altered expression of several cytokines and chemokines in A549 lung epithelial cells after gallotannin treatment, but no effects on PAR levels.
In mice, a single parg gene expresses two PARG isoforms of 110 and 60 kDa, with the latter being predominantly cytoplasmic; however, the full-length 110 kDa protein is also present in the nucleus and accounts for most of the PARG activity [12]. In human cells, two alternative splice variants of the primary PARG transcript lead to the expression of two cytoplasmic isoforms of 102 and 99 kDa, while the full-length 111 kDa protein is localized to the nucleus due to an NLS (nuclear localization signal) encoded by exon 1 [13]. A nuclear export signal is also present in mammalian PARG [14] and together with the NLS may prompt cell cycle-dependent changes in the subcellular distribution of the enzyme [15,16]. Relocation of nuclear and cytoplasmic isoforms has been observed during radiation-induced DNA damage [17]. The PARG nucleocytoplasmic ratio changes during the differentiation of rat germinal cells [18], as well as in PMA-treated human promyelocytic leukaemia cells [19]. Finally, PARG associates with ribonucleoprotein complexes, suggesting an involvement in RNA metabolism [20].
Whether individual PARG isoforms have different enzymological properties, regulatory mechanisms and/or functions remains to be established. Depletion of the full-length nuclear form of the PARG protein (but not the 60 kDa isoform) by deletion of exons 2 and 3 of the murine parg gene produces viable and fertile mice expressing a hypersensitivity to genotoxic stress, endotoxic shock [12] and partial protection against renal and splanchnic ischaemia/reperfusion injury [21,22]. Moreover, PARP-1 automodification is severely compromised in cells deficient in 110 kDa PARG [12].
Disruption of the parg gene by targeting exon 4 in the germline of mice, leading to complete suppression of functional PARG, causes early embryonic lethality [23] due to PAR accumulation. In fact, trophoblast stem cell lines derived from these parg-null early embryos are viable, but only in the presence of PARP inhibitors [23]. In addition, these cells are hypersensitive to the cytotoxic effects of MNNG (N-methyl-N′-nitro-N-nitrosoguanidine) and menadione [23]. Similarly, a loss-of-function mutation of PARG in Drosophila results in larval lethality; this effect can be partially overcome by raising the temperature from 25 to 29 °C [24]. However, PARG-deficient adult flies show neurodegeneration, reduced locomotor activity and a short lifespan, suggesting an involvement of PARG in normal neuronal cell metabolism and aging [24].
Although the gene knockout approach has offered some important insights into PARG function, the embryonic lethality has precluded further functional studies. Likewise, the lack of potent, specific and cell-permeable inhibitors has made it difficult to investigate PARG function in cells. In the present study, we used RNAi (RNA interference) to selectively down-regulate PARG in both murine and human cells. We report the consequences of reduced PARG content on cell growth and viability, and on the expression of cell cycle and/or apoptosis regulators [PCNA (proliferating-cell nuclear antigen), p53 and bax], both under normal culture conditions and in response to genotoxic stress.
MATERIALS AND METHODS
Cell culture
All media and supplements used for cell cultures were obtained from Gibco. MEFs (mouse embryonic fibroblasts), human cervical carcinoma cells (HeLa S3) and human breast cancer cells (MCF-7) were cultured at 37 °C in a water-saturated 5% CO2/95% air atmosphere, in DMEM (Dulbecco's modified Eagle's medium) containing 4500 mg/l glucose and supplemented with 10% (v/v) FBS (fetal bovine serum) and antibiotics (complete DMEM).
Synthesis of siRNAs (small interfering RNAs) and transfection
siRNAs were synthesized in vitro from oligonucleotide templates (Microsynth) using an siRNA construction kit (Ambion), according to the manufacturer's instructions. Purified siRNAs were dissolved in water at a concentration of 20 μM and stored at −80 °C until use. The following 21-nt sequences in the coding region of mouse PARG cDNA (GenBank® accession no. NM_011960) were chosen as targets for RNAi: 5′-AAATGGGACTTTACAGCTTTG-3′ (siRNA1); 5′-AAGCTGATGGCGATCTTAGGA-3′ (siRNA2); and 5′-AAGACTATTACTACTTGGATG-3′ (siRNA3). A scrambled version of siRNA1 was also synthesized and used as a negative control.
Cells were grown to 50–70% confluence in 24-well plates and transfected with siRNAs at a final concentration of 80 nM in 250 μl of OptiMEM, using siPORT amine (Ambion) as the transfection reagent. After incubation at 37 °C for 4 h, 1 ml/well complete DMEM was added and cells were allowed to grow for up to 72 h. Cells were collected at various times after transfection to determine PARG activity, as well as PARG protein and mRNA levels. In initial experiments, actual uptake of siRNA under the employed transfection conditions was assessed by fluorescence microscopy after transfection of cells with an FITC-labelled doublestranded RNA oligomer (BLOCK-iT fluorescent oligo; Invitrogen).
In some experiments, silenced cells were harvested by trypsinization, seeded in 24-well plates and transfected again exactly under the conditions described above. Several rounds of subculturing, transfection and growth were repeated on the same cell stocks. Samples were collected at each subculture (72 h after transfection) to detect PARG activity and protein levels by enzymatic assay and Western blotting respectively.
Cell extracts
Cells grown in 24-well plates were collected in 30 mM Tris/HCl (pH 7.5) buffer, containing 0.5 M NaCl, 20% (v/v) glycerol and 1% Triton X-100 (0.5 ml/well), and incubated for 30 min on ice. Whole-cell extracts were obtained after centrifugation at 10000 g for 10 min at 4 °C. Supernatants were divided into 50 μl aliquots and stored at −80 °C until use. Alternatively, a cell fractionation procedure was applied to separate cytoplasm and nuclei, before salt extraction of the latter. Briefly, cells were collected by centrifugation in ice-cold PBS, resuspended in 30 mM Tris/HCl (pH 7.5) containing 1.5 mM MgCl2, 10 mM KCl, 20% glycerol and 1% Triton, incubated on ice for 5 min and then centrifuged at 1000 g for 90 s. Supernatants (cytoplasm) were divided into 20 μl aliquots and stored at −80 °C. Pelleted nuclei were digested for 30 min at 25 °C with 6 units of DNaseI (Sigma) in 100 mM Tris/HCl (pH 7.2), 0.3 M sucrose, 50 mM NaCl and 5 mM MgCl2, then NaCl was added from a stock solution to a final concentration of 0.5 M and, after 30 min of incubation on ice, nuclear extracts were recovered by centrifugation at 10000 g for 5 min. A protease inhibitor cocktail (Complete™, EDTA-free; Boehringer Mannheim) was added to all buffers at the recommended concentration just before use.
Synthesis of PARP-bound [32P]PAR
PARP-bound [32P]PAR was synthesized in vitro, by incubation of 1.5 units of PARP-1 (Biomol) in 100 mM Tris/HCl (pH 8.0) buffer, containing 400 μM [32P]NAD+ (0.1 μCi/nmol), 10 mM MgCl2, 2 mM DTT (dithiothreitol), 0.5 μg of nicked calf thymus DNA, 10% (v/v) ethanol and 10% glycerol, in a final volume of 27 μl. After 30 min of incubation at 30 °C, the reaction was stopped by precipitation with 0.7 vol. of propan-2-ol in the presence of 0.3 M sodium acetate (pH 5.2) [25]. The pellet containing PARP-bound [32P]PAR was collected by centrifugation, washed with ethanol, air-dried and finally resuspended in 50 mM Tris/HCl (pH 7.4), containing 14 mM 2-mercaptoethanol, 0.5 mM PMSF and 20% glycerol. This sample was subsequently used as a substrate to determine enzymatic PAR degradation in cell extracts.
PAR degradation assays
PARG activity was determined in cell extracts by an enzymatic assay using PARP-bound [32P]PAR as a substrate and 2 μl of cell extracts as the enzyme source. Incubation was in 50 mM potassium phosphate buffer (pH 7.4), containing 50 mM KCl, 10 mM 2-mercaptoethanol and 100 μg/ml BSA [25], in a final volume of 24 μl. When indicated, 10 mM EDTA, 10 mM MgCl2 or 1 μM ADP-HPD [ADP (hydroxymethyl)pyrrolidinediol; Calbiochem], a specific PARG inhibitor, was included. Reactions were started by adding 200 pmol of protein-bound [32P]PAR and allowed to proceed for 10 min at 37 °C. Then, an equal volume of ice-cold 40% (w/v) trichloroacetic acid was added and, after centrifugation at 13000 g for 15 min, the radioactivity in the supernatant was measured in a liquid-scintillation counter. All assays were performed in duplicate. PARG activity in siRNA-transfected cells was expressed as percentage of the values detected for control cells, transfected with scrambled siRNA.
PAR degradation by phosphodiesterase-like activities was assayed under similar conditions with 50 mM Tris/HCl (pH 9.0) substituting for the potassium phosphate buffer and in the presence of 10 mM MgCl2 [26].
Purified calf thymus PARG and commercial SVPDE (snake venom phosphodiesterase; Boehringer Mannheim) were used as digestion controls.
Western-blot analyses
Cells were washed with ice-cold PBS and then harvested directly in Laemmli buffer [60 mM Tris/HCl, pH 6.8, 2% (w/v) SDS, 2% (v/v) 2-mercaptoethanol, 8% glycerol and 0.0025% Bromophenol Blue], sonicated and incubated at 95 °C for 1 min. Soluble proteins were collected in the supernatant after centrifugation, separated by SDS/PAGE (12% gel) and finally electroblotted on to PVDF membranes (Bio-Rad). Blots were probed with polyclonal anti-PARG antibodies (Ab-01; Oncogene; 1:8000) and monoclonal anti-GADPH (glyceraldehyde-3-phosphate dehydrogenase) antibodies (Ambion; 1:50000), in succession. Other antibodies used in these studies include: monoclonal anti-PCNA (BD Biosciences; 1:5000), anti-bax (Calbiochem; 1:2000); anti-p53 (Oncogene; Ab-1; 1:5000), anti-PARP-1 (Alexis; C2-10; 1:5000); anti-DNA topoisomerase I (BD PharMingen; 1:5000); polyclonal anti-PAR (Alexis; LP96-10; 1:10000) and anti-phospho-Akt (Ser473; Serotec; 1:4000). Peroxidase-conjugated secondary antibodies were used in all cases, except for PARG detection; in the latter case, best results were obtained with the ImmunoPure ABC peroxidase staining kit (Pierce), employing biotinylated anti-(rabbit IgG). Immunodetection was performed by enhanced chemiluminescence (Pierce; ECL® detection kits). Images were acquired by exposure to autoradiographic films and quantification was carried out by scanning densitometry with ImageQuant software (Molecular Dynamics/GE Healthcare).
PCR analyses
cDNA was produced from control and siRNA-transfected cells without prior isolation of RNA, using the Cells-to-cDNA II kit (Ambion) under the conditions described in the manufacturer's manual. These samples were then used as templates for GAPDH and PARG amplification in quantitative real-time PCR, with specifically designed primers (Assay-on-demand Gene Expression products; Applied Biosystems), in a reaction mixture including TaqMan Universal PCR Master Mix (Applied Biosystems). Analyses were carried out on an ABI PRISM 7700 cycler, at the default setting programme (95 °C, 15 s; 60 °C, 1 min; 40 cycles). Fold changes (FC) in parg gene expression were calculated with the comparative Ct (threshold cycle) method (ΔΔCt), using the formula FC=2ΔΔCt, where ΔCt is the difference between the Ct values of the parg gene and the endogenous control GAPDH, and ΔΔCt equals the difference between the ΔCt values of silenced and wild-type cells.
Cell growth and viability assay
Cell growth and viability were assessed by a dye reduction bioassay (Alamar Blue assay; Serotec). Briefly, 72 h after transfection, confluent cells were harvested by trypsinization, resuspended in complete DMEM containing 10% (v/v) Alamar Blue and seeded into white clear bottom 96-well plates at a density of 10000 cells/well. Metabolic reduction of the vital dye was assessed by spectrofluorimetry: fluorescence was monitored periodically over 3 days of growth, at 530 nm excitation wavelength and 590 nm emission wavelength, using an LS 55 luminescence spectrometer (PerkinElmer).
To determine drug-induced cytotoxicity, MNNG or H2O2 was added to exponentially growing cells in 96-well plates. After a 20 h incubation at 37 °C, the medium was replaced with Alamar Blue-containing DMEM and fluorescence was recorded 4 h later. MNNG was dissolved in DMSO at 2.0 M and diluted in complete DMEM just before use. H2O2 was diluted from a 30% stock solution in OptiMEM and immediately added to the cells. After a 1 h incubation at 37 °C, FBS was supplied to a 10% final concentration and cells were maintained in culture for an additional 19 h before carrying out the Alamar Blue assay.
Measurement of the ADP/ATP ratio
The ADP/ATP ratio was determined using the ApoGlow kit (LumiTech); the assay is based on bioluminescent measurement of the adenylate nucleotides and allows the assessment of the mode of cell death [27]. Cells were grown in white clear-bottom 96-well plates and treated exactly as indicated above; at different times after treatment, cells were lysed in Nucleotide-releasing Reagent and processed for ATP and ADP determination as described in the kit's instruction manual. Luminescence was measured using the MLX Microtitre Plate luminometer (Dynex Technologies). Triplicate determinations were performed on different cell populations in two independent silencing experiments.
PAR analysis by immunofluorescence
At 72 h after transfection with either PARG-specific or scrambled siRNA, cells were subcultured and grown on coverslips for 24 h before treatment with 100 μM H2O2 for 15 min. Then the drug-containing medium was removed and cells were either washed with ice-cold PBS and immediately fixed, or allowed to recover for up to 40 min in complete DMEM, at 37 °C. Fixation was with methanol/acetone (1:1) at −20 °C for 20 min. After washing with PBS, cells were incubated with 3% (w/v) milk and 0.05% Tween 20 in PBS (PBS-TM) for 1 h at 37 °C and then treated with a polyclonal antibody against PAR (LP96-10; Alexis) diluted 1:200 in PBS-TM for 1 h at 37 °C. Finally, samples were incubated with an Alexa Fluor® 488-conjugated secondary antibody (Molecular Probes) at 1:200 dilution, for 1 h at room temperature (20 °C). DNA was stained with Hoechst 33258 dissolved in PBS at 0.2 μg/ml. Coverslips were mounted on glass slips with 0.1% Mowiol (Calbiochem) and examined with a fluorescence microscope (Nikon) connected to a digital camera (Kappa).
PAR size analysis
Cells were transfected with siRNAs (either control or PARG-specific) and treated with 100 μM H2O2, as described above. Then, adherent cells were washed in situ with PBS, overlaid with 100 mM Tris/HCl (pH 8.0) containing 10 mM MgCl2, 2 mM DTT, 20 μg/ml digitonin and 1 μCi [32P]NAD and incubated at 37 °C for 15 min. At the end of the incubation time, citric acid was added to a final concentration of 25 mM; cells were harvested, transferred on to ice and immediately precipitated by addition of trichloroacetic acid (20%, final concentration). Trichloroacetic acid pellets were collected by centrifugation, washed three times with ethanol and once with diethyl ether, and finally resuspended in TE buffer (10 mM Tris/HCl, pH 8.0, and 1 mM EDTA) containing 0.5 mg/ml proteinase K. After a 1 h incubation at 37 °C, pH was raised to 12.0 by Tris/NaOH addition; samples were further incubated at 60 °C for 1 h and finally subjected to high-resolution PAGE and autoradiography. Polymer size distributions were analysed by densitometric scanning and quantification of autoradiographic band intensities (ImageQuant 3.15; Molecular Dynamics/GE Healthcare).
Alkaline single-cell gel electrophoresis (Comet) assay
DNA strand breakage and resealing were assessed by the single-cell gel electrophoresis assay under alkaline conditions, using a kit from Trevigen. Either untreated or H2O2-treated cells were harvested by trypsinization, resuspended in PBS, mixed with molten low-melting-point agarose (37 °C), pipetted on Comet slides and immediately transferred on to ice. Cell lysis, electrophoresis and staining were carried on as described in the Trevigen instruction manual. Slides were examined using a fluorescence microscope; images were captured using a digital camera and the tail moment of the comets was calculated using the TriTek CometScore software. A total of 100 cells were analysed per sample in at least two independent experiments. The extent of DNA damage is expressed as Olive tail moment, defined as the product of the fraction of total DNA in the tail and the mean distance of migration in the tail [28].
Measurement of GSH
GSH was measured using the improved DTNB [5,5′-dithiobis-(2-nitrobenzoic acid)] method (QuantiChrom Glutathione Assay kit; BioAssay Systems). DTNB reacts with GSH to form a yellow product. Absorbance (A) was measured at 412 nm and GSH in cellular extracts was quantified on the basis of a calibration curve generated using GSH as a standard. Data were normalized to cellular protein content.
Other methods
Protein concentration was determined using the Bradford protein assay reagent (Bio-Rad), with BSA as a standard.
RESULTS
Down-regulation of PARG expression by RNAi
Three 21-nt sequences in the coding region of mouse PARG cDNA were selected as potential targets for RNAi and the corresponding siRNAs (siRNA1–siRNA3) were synthesized in vitro as described in the Materials and methods section. One of these sequences (siRNA1) is identical with a corresponding region in human PARG mRNA and allowed parallel analysis of RNAi efficiency in MEFs and human cancer cells (HeLa and MCF-7). A scrambled version of siRNA1 was used as negative control (siRNAc).
To evaluate the gene-specific targeting efficacy of the chosen siRNAs, PARG was quantified in transfected cells in terms of enzymatic activity, as well as at the protein and mRNA levels. First, a time-course analysis of PAR-degrading activity was carried out in whole-cell lysates. As shown in Figure 1, when transfected into MEFs, all PARG-siRNAs (siRNA1–siRNA3) caused a progressive loss of enzymatic activity that was maximal after 72 h. However, the extent of reduction was different, ranging from 55%±6% (siRNA2) to 83%±4% (siRNA3) and 84%±6% (siRNA1). As expected, siRNA1 that targets homologous regions in mouse and human PARG mRNA was similarly effective in MEFs and in the two human cell lines, HeLa and MCF-7, whose PARG activity was lowered by 84%±7% and 78%±6% respectively, 72 h after transfection. The scrambled siRNAc was completely ineffective, as judged by comparison with non-transfected cells, and was taken as the negative control. When PAR degradation was assayed in cytoplasmic and nuclear extracts separately, the extent of the reduction in PARG specific activity was found to be similar in the two fractions (Figure 2). Cross-contamination of nuclear and cytoplasmic extracts was excluded on the basis of Western-blot analyses, using antibodies against both the nuclear enzyme DNA topoisomerase I and the cytoplasmic enzyme GAPDH (Figure 2, inset).
Figure 1. Effect of siRNA on PAR degradation in vitro.

PARG activity was assayed in whole-cell extracts as described in the Materials and methods section at different times after transfection with either control (siRNAc) or PARG-specific siRNAs (siRNA1–siRNA3). All data were normalized to protein content and the values obtained with siRNAc-transfected cells were set at 100%. The distribution around the median of data from several independent experiments (n≥5) is shown as a box plot.
Figure 2. PAR degradation in subcellular fractions.

PARG activity was assayed in cytoplasmic and nuclear extracts at different times after transfection with either siRNAc (control) or siRNA1. Data are normalized to protein content and are shown as means±S.E.M. for three independent experiments. Inset: Western-blot analysis of nuclear (N) and cytoplasmic (C) extracts from control (siRNAc) and siRNA1-transfected MEFs. Topo I, DNA topoisomerase I.
The possibility that the loss in enzymatic activity was specifically due to reduced PARG expression was confirmed by Western blotting, using a polyclonal antibody directed against the C-terminus of the enzyme. As siRNA1 and siRNA3 were comparably effective at reducing PARG activity, only siRNA1 was used for this and further analyses. Figure 3 shows that, indeed, siRNA-transfected MEFs contain lower amounts of PARG protein (57%±5.6% and 13.3%±3.5% in siRNA2- and siRNA1-transfected cells respectively). These values are in agreement with those recorded by activity assay (Figure 1), and the reduction concerns both high (110 kDa)- and low (∼60 kDa)-molecular-mass isoforms.
Figure 3. Effect of siRNA on protein expression.
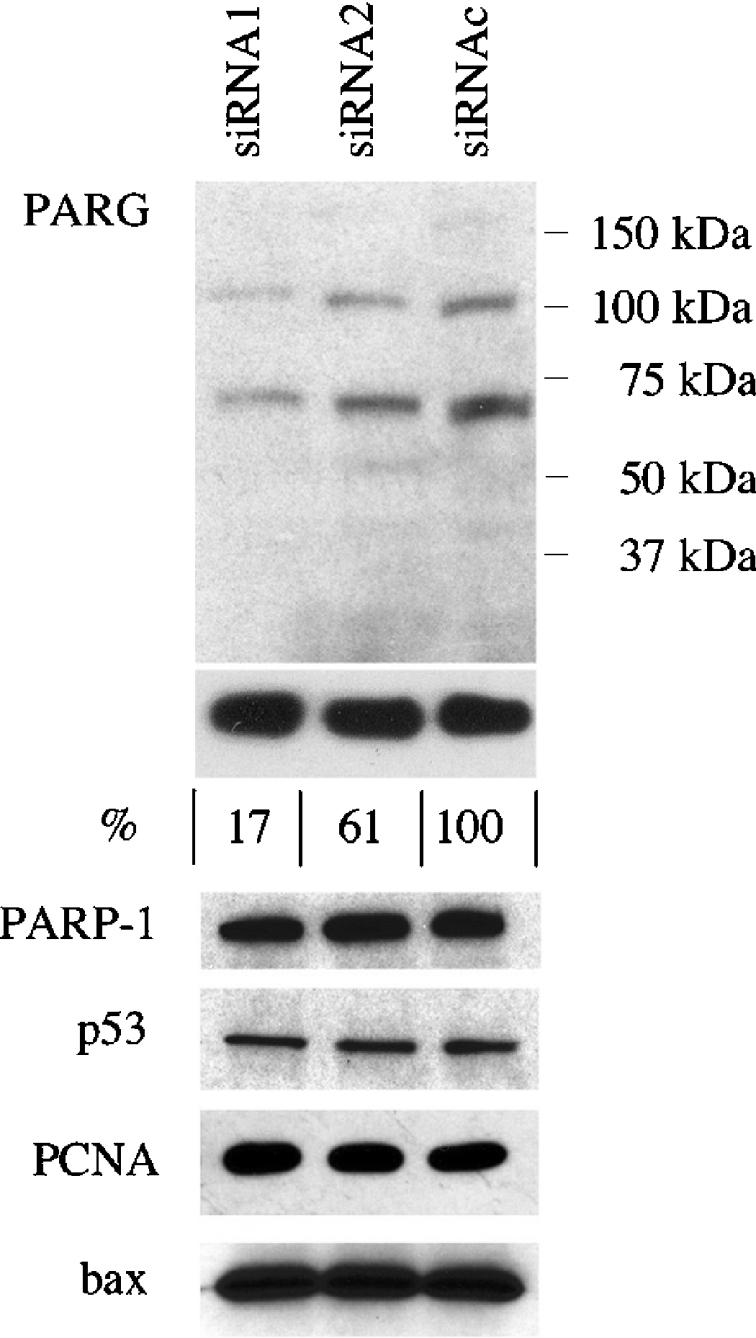
SDS/PAGE and Western-blot analyses of protein samples from control (siRNAc) and PARG-specific (siRNA1 and siRNA2) siRNA-transfected MEFs. Immunodetected proteins are indicated on the left. The migration of molecular-mass standard proteins is indicated on the right. Numbers below the GAPDH panel refer to PARG quantification: band intensities were measured by scanning densitometry and data were normalized to GAPDH content. The value obtained for siRNAc-transfected cells was set at 100%. Results are representative of at least two independent experiments.
Finally, quantification by real-time PCR confirmed a time-dependent decrease in PARG mRNA levels that reached values of 22% and 13.6%±4.5% respectively, 48 and 72 h after transfection with siRNA1, and 58% and 42%±8.5% at the same times after transfection with siRNA2.
Effect of PARG silencing on cell growth and viability
PARG silencing did not cause any morphological changes, growth defects or cell death, as assessed by light microscopy, cell counting, viability assays and biochemical analyses of protein expression. In fact, the levels of a number of proteins, including the metabolic enzyme GAPDH, the PARG anabolic counterpart PARP-1, PCNA, the cell cycle/apoptosis regulator p53 and the pro-apoptotic protein bax, remained unchanged in control and PARG-siRNA-transfected MEFs (Figure 3). Furthermore, no apoptotic fragmentation of either PARG [29] or PARP-1 [30] could be detected in any of our gene-silencing experiments, confirming the absence of primary (transfection-related) or secondary (PARG down-regulation-related) cytotoxic effects. Indeed, PARG-silenced cells maintained the ability to attach and proliferate under routine subculture conditions (Figure 4). Likewise, by reiterating the transfection method on successive subculturing generations, PARG levels could be maintained as low as 10% of control values for more than 1 month (Figure 4B) without any overt phenotypic alteration.
Figure 4. Effect of PARG silencing on cell growth and viability.

Following transfection with either control (siRNAc) or PARG-specific siRNA (siRNA1), MEFs were grown for 72 h and then collected by trypsinization and either plated in 96-well plates in the presence of 10% Alamar Blue (A) or propagated in 24-well plates and subjected to several rounds of transfection, growth and subculture (B), as described in the Materials and methods section and outlined in (C). (A) Fluorimetric analysis of metabolic reduction of Alamar Blue. Results are shown as means±S.D. for 16 determinations in one experiment. (B) Western-blot analysis of samples from successive subculture (S) generations; S0 refers to the initially silenced cells, collected 48 h (S0-48 h) and 72 h (S0-72 h) after siRNA transfection. Cells from subsequent subculturing generations (S1–S7) were harvested 72 h after transfection. Arrowheads point to high- and low-molecular-mass PARG isoforms. Cells from intermediate subculture/transfection cycles (S3–S6) were analysed separately with identical results.
Effect of PARG silencing on PAR catabolism in vivo and in vitro
Intracellular PAR levels are usually low but they increase substantially following DNA damage [1] due to the activation of PARP-1 and PARP-2 by their binding to DNA strand breaks [2,3,5–7,31]. The enhanced synthesis of PAR is accompanied by an acceleration of the polymer catabolism that reduces PAR half-life from hours to seconds [1,4].
We examined the effects of PARG down-regulation on the dynamics of PAR synthesis and degradation in DNA-damaged living cells by immunofluorescence. At 72 h after transfection with either siRNA1 or scrambled siRNAc, cells were subcultured and grown on coverslips for 24 h before exposure to a genotoxic stress. PARG activity assays on cell extracts confirmed the persistence of the silencing effect under such conditions. In the experiment illustrated in Figure 5, MEFs were treated with 100 μM H2O2 for 15 min and then allowed to recover in carcinogen-free medium for an increasing amount of time (Figure 5, bottom right panel). Under these conditions, large amounts of PAR were formed both in control- and PARG-siRNA-transfected cells (Figure 5, first and third column panels). As expected, DNA-damage-stimulated polymer synthesis was suppressed by the PARP inhibitor 3-AB (3-aminobenzamide; Figure 5, bottom left).
Figure 5. Immunofluorescence analysis of PAR turnover in H2O2-treated cells.

MEFs were transfected with either control (siRNAc) or PARG-specific siRNA (siRNA1) as described in the Materials and methods section. PAR was detected by immunofluorescence immediately after (zero time) or at increasing recovery times following treatment with 100 μM H2O2 (first and third columns). As a control, one set of cells was pretreated with the PARP inhibitor 3-AB (1 mM). Hoechst 33258 staining of cellular DNA is shown (second and fourth columns). The experimental design is schematized in the bottom right panel. Residual PARG activity in silenced cells was 19% of controls.
PAR accumulation was only transient and was followed by rapid polymer degradation, irrespective of the PARG status (Figure 5, first and third column panels); however, reconstitution of basal PAR levels was considerably delayed in PARG-silenced cells: in fact, whereas PAR was completely turned over by 20 min in control cells, the polymer was still detectable after 40 min in PARG-down-regulated cells. Similar results were obtained with HeLa cells (results not shown) and confirmed by Western-blot analysis of poly(ADP-ribosyl)ated proteins that migrated as a broad band in the high-molecular-mass region of the gel (Figure 6). Notably, PAR hydrolysis in silenced cells was dramatically reduced in the first 10 min after H2O2 treatment, but appeared to recover thereafter. A more in-depth analysis of PAR synthesis under such conditions revealed an altered molecular composition of the polymer populations, with increased proportions of PAR molecules longer than 15-mers in PARG-silenced cells (Figure 7).
Figure 6. Western-blot analysis of PAR turnover in H2O2-treated cells.

MEFs were treated with 100 μM H2O2 for 15 min and then allowed to recover in drug-free medium as described in the legend to Figure 5 and in the Materials and methods section. Cells were collected in Laemmli buffer and analysed by SDS/PAGE and Western blotting using anti-GAPDH or anti-PAR antibodies, immediately after the treatment (0 min recovery) or after 10 and 20 min recovery time. Numbers on the right mark the migration position of molecular mass standard proteins. Numbers below the GAPDH panel refer to PAR quantification: band intensities were measured by scanning densitometry and data were normalized to GAPDH content. The values obtained at zero time recovery were set at 100% both for siRNAc- and siRNA1-transfected cells. Results are representative of two independent experiments.
Figure 7. PAR size analysis.

PAR synthesized by either wild-type (siRNAc-transfected) or PARG-silenced (siRNA1-transfected) MEFs, both under basal conditions (control) and after 15 min treatment with 100 μM H2O2, was radiolabelled, isolated and analysed by PAGE and autoradiography (left panel), as described in the Materials and methods section. Band intensities were measured by scanning densitometry; individual polymer size classes, expressed as fractions of total, were allocated in three major groups as shown in the bar graphs on the right.
The short existence of PAR in H2O2-treated controls as well as PARG-silenced cells prompted us to examine the possibility that other enzymatic activities might compensate for severe PARG down-regulation. In fact, PAR is a substrate recognized by type I phosphodiesterase; for instance, the polymer is efficiently hydrolysed by SVPDE in vitro to AMP and phosphoribosyl-AMP [1]. Indeed a PAR-degrading pyrophosphatase activity has been described in rat liver [32] and kidney [12], as well as in cultured mouse erythroleukaemia cells [33] and in plants [32]. However, we did not detect any PAR hydrolysis when the reaction was carried out at pH 9.0 in the presence of MgCl2, with SVPDE serving as a positive digestion control (Figure 8). Moreover, PAR degradation was in all cases fully sensitive to the specific PARG inhibitor ADP-HPD, whereas it was not affected by EDTA, a negative modulator of phosphodiesterases (Figure 8). Optimal buffer conditions and inhibitor specificities were confirmed using purified PARG and SVPDE enzymes that were assayed in parallel with cell extracts (Figure 8).
Figure 8. PAR degradation in vitro.

PAR degradation was assayed either in potassium phosphate buffer (pH 7.4) or in Tris/HCl buffer (pH 9.0) in the presence of MgCl2, as described in the Materials and methods section. Calf thymus PARG or SVPDE was assayed in parallel with whole-cell extracts from siRNAc- (control) and siRNA1-transfected MEFs. ADP-HPD, specific PARG inhibitor.
Consequences of PARG silencing on the cellular response to DNA damage
Poly(ADP-ribosyl)ation plays a dual role in the response to a genotoxic insult. In fact, while required for efficient repair in the presence of low levels of DNA lesions, PARP activity promotes cell death under severe genotoxic stress conditions [2,5–7,30,34]. To find out whether PARG silencing affected the cell's ability to adequately respond to DNA damage, MEFs transfected with either siRNAc or siRNA1 were treated with H2O2 concentrations ranging from 0.01 to 1 mM; then single-cell gel electrophoresis (Comet assay) or an assay based on metabolic reduction of a vital dye (Alamar Blue assay) was performed to determine the extent of DNA repair or cell survival respectively. H2O2 concentrations of between 1 and 25 μM had no effect on cell viability over a 24 h period. We found that both wild-type and PARG-silenced cells were able to repair efficiently DNA damage induced by sublethal doses of H2O2; indeed no difference could be detected either in the extent of initial DNA damage or in the kinetics of repair, which was completed within 30 min after treatment with 10 μM H2O2 (Figure 9A).
Figure 9. Effect of PARG silencing on DNA repair and cell viability.

Wild-type (siRNAc-transfected) and PARG-silenced (siRNA1-transfected), exponentially growing MEFs were treated with different concentrations of either H2O2 or MNNG, as described in the Materials and methods section. (A) DNA strand breakage and resealing were assessed by the Comet assay. Cells were treated with 10 μM H2O2 for 15 min and then allowed to recover in drug-free medium for 30 min. Results shown are the averages of the mean tail moments of two independent experiments (200 cells/sample) with maximum deviation from average <10%. (B, C) Cell viability was assessed 20 h after treatment with the indicated drug doses by the Alamar Blue assay. 3-AB: cells grown in the presence of the PARP inhibitor 3-AB (1 mM) for 30 min before and during the entire subsequent treatment time. Results represent the means±S.D. for three independent experiments.
In another series of experiments, MEFs were treated with increasing concentrations of either H2O2 or the DNA-alkylating agent MNNG, then viable cells were detected by the Alamar Blue assay. As shown in Figures 9(B) and 9(C), reduced PARG activity had differential effects on cell viability, depending on the type of DNA damage. In fact, MNNG and H2O2 both caused a dose-dependent reduction in the number of viable cells; however, PARG-silenced cells were considerably more resistant to H2O2-induced cytotoxicity than their wild-type counterparts. The impact of PARG silencing on cell survival was already evident at the lowest effective H2O2 concentration (50 μM) and was maintained over a one order of magnitude dose range (Figure 9B). The cellular antioxidant capacity was not affected by PARG silencing, as judged by GSH measurements. In fact, control and PARG-silenced cells contained comparable amounts of GSH (5.7±0.58 and 6.17±0.39 nmol/mg of protein respectively) and both underwent a 40%±3% decrease in GSH content after 100 μM H2O2 treatment.
In contrast, PARG down-regulation did not influence cellular sensitivity to MNNG (Figure 9C). On the other hand, PARP inhibition by 3-AB protected wild-type MEFs against both H2O2 and MNNG cytotoxicity; such an effect was more pronounced at the highest drug concentrations: at 1 mM H2O2, when up to 90% wild-type and PARG-silenced cells died, 3-AB increased cell viability up to 36%±7.4% (Figure 9B). Likewise, 20 μM MNNG killed virtually all cells, unless 3-AB was added to the culture medium; in the presence of the PARP inhibitor, approx. 50% of the cells remained viable (Figure 9C).
Mode of H2O2-induced cell death
H2O2 is known to induce both apoptotic and necrotic cell death, depending on the concentration of the oxidant and/or the cell type being examined [35,36]. To define the mode of death of MEFs with either a wild-type level or reduced PARG content, we used a validated method for detection of necrosis and apoptosis, based on the measurement of the ADP/ATP ratio [27]. In addition, the method allows the assessment of the degree of apoptosis in a cell population with an accuracy that is comparable with that provided by other techniques, including TUNEL (terminal deoxynucleotidyl transferase-mediated dUTP nick-end labelling) and flow cytometric analysis of hypodiploidy [27]. The ADP/ATP ratio is expected to be below 0.11 for healthy viable cells, between 0.11 and 1.0 for cells undergoing apoptosis, while much higher values characterize necrotic cells, due to the dissipation of intracellular energy levels that occurs in necrosis [27,37]. In our experiments, the ADP/ATP ratio increased proportionally to increasing H2O2 concentration, from 0.1±0.02 in untreated cells up to a maximum of 0.45±0.07 in PARG wild-type cells treated with 1 mM H2O2 (Figure 10A): such values are compatible with increasing levels of apoptosis in the cell population as the magnitude of the oxidative challenge is enhanced. Likewise, H2O2-dependent apoptosis occurred in PARG-down-regulated MEFs (Figure 10A); however, at all the oxidant concentrations, the ADP/ATP ratio of silenced cells was lower than the corresponding value of their wild-type counterparts, confirming the protective effect of reduced PARG expression, as first revealed by cell viability assays. Accordingly, the ADP/ATP ratio increased following treatment of MEFs with 10 μM MNNG; however, no significant difference could be detected between control and PARG-silenced cells (0.37±0.04 versus 0.4±0.06).
Figure 10. ADP/ATP ratio measurement and Western-blot analysis of protein markers of cell death/survival signalling.

(A) Cells were treated with increasing concentrations of H2O2 and processed for luminescence detection of the adenylate nucleotides after 8 h. Results are the means±S.D. for triplicate determinations in two independent experiments. siRNAc, wild-type MEFs; siRNA1, PARG-silenced MEFs. (B) Cells were either left untreated (control) or treated with 500 μM H2O2 for different times. Whole-cell lysates were subjected to SDS/PAGE and Western-blot analysis. Ser473-phospho-Akt (P-Akt), p53 and GAPDH were detected on the same blot, in succession. PARP-1 immunodetection in the same samples was performed separately: these data are not normalized to GAPDH content.
To establish the role of PARG in H2O2-induced apoptotic cell death signalling, we analysed the levels of the tumour suppressor protein p53, a well-known regulator of apoptosis [38], as well as the phosphorylation of Akt/protein kinase B, a key event in a PI3K (phosphoinositide 3-kinase)-dependent survival pathway. Incidentally, activation of the PI3K/Akt system appears to contribute to the cytoprotective effect of PARP inhibitors in oxidatively stressed human hepatocytes [39]. As shown in Figure 10(B), Akt phosphorylation is an early response to oxidative challenge in MEFs, regardless of the PARG status: Akt phosphorylation increased dramatically within 30 min of treatment with 500 μM H2O2, remained high for at least 3 h and declined towards basal levels thereafter. Moreover, apoptotic cell death was neither accompanied by significant changes in p53 levels (Figure 10B) nor required caspase activation, as judged by the lack of cleavage of PARP-1 (Figure 10B), a physiological substrate for the effector caspases 3 and 7 [30,34]. In any case, none of the investigated parameters appeared to be sensitive to the different PARG content of the cells.
DISCUSSION
The discovery of PARG as a specific PAR-catabolizing enzyme dates back to more than 30 years ago [40]. Since then, several aspects of PARG structure, substrate specificity, mode of action in vitro and subcellular localization have been clarified [1,4,13,15–20,41]; however, the biological function(s) and regulatory mechanism(s) of PARG remain largely unknown. Studies at the cellular level have been hampered by the lack of potent, cell-permeable and specific PARG inhibitors [10]; in addition, genetic disruption of the parg gene has been recently shown to cause early embryonic lethality [23].
Here, we used RNAi to selectively down-regulate PARG in MEFs and human cancer cell lines (HeLa and MCF-7); this allowed us to highlight a specific role for PARG in the cellular response to oxidative stress.
PARG is present in mammalian cells as multiple isoforms resulting from alternative splicing of the primary mRNA transcript [13] or arising as alternative translation products [12]. Transfection with in vitro synthesized siRNAs caused down-regulation of both high- and low-molecular-mass PARG isoforms (Figure 3) and a similar reduction of PAR-degrading activity in nuclear and cytoplasmic fractions (Figure 2). At the molecular level, a major consequence of reduced PARG expression was an altered ability of the cells to hydrolyse PAR in response to DNA damage. In fact, when exposed to oxidative stress, both control and PARG-silenced cells suffered DNA strand breakage and exhibited transient PAR accumulation in nuclei (Figures 5 and 6); however, in wild-type cells, more than 60% of newly synthesized PAR was degraded within 10 min after H2O2 treatment, and polymer turnover was complete by 20 min. In contrast, PAR levels remained initially high in PARG-silenced cells, with very little catabolism in the first 10 min of recovery from oxidative challenge; significant turnover could only be detected after 20 min (Figures 5 and 6). Thus it appears that, while it does not interfere with PAR synthesis, PARG down-regulation poses a hurdle that has to be removed before PAR degradation can occur. As relocation of PARG isoforms has been described in DNA-damaged cells [17], there is a possibility that recruitment of the residual cytoplasmic enzyme to the nucleus in silenced cells may be a limiting step, required to raise nuclear PARG concentration above a critical threshold. Such a possibility is also supported by the observation that PAR is efficiently degraded, both under basal conditions and following H2O2 treatment, in embryonic fibroblasts from mice genetically depleted of the 110 kDa PARG nuclear isoform [12]. Alternatively, the participation of other PAR-hydrolysing enzyme(s) should be considered. Indeed, PAR degradation by a phosphodiesterase-like activity has been described in mammalian and plant cells [12,32,33]. Notwithstanding, we could not detect any PAR consumption by whole-cell extracts from both control and PARG-silenced MEFs, under conditions that would favour a putative phosphodiesterase (Figure 8). However, more in-depth enzymological studies need to be carried out before conclusive assessments can be made. In fact, a novel 39 kDa protein with PAR hydrolase activity has been recently identified, purified and characterized [42]. This enzyme, termed ARH3 [ADP-ribosyl-(arginine)-hydrolase 3], shares sequence similarity with ARH1 and ARH2, but, like PARG, cleaves PAR to produce ADP-ribose monomers.
The fact that PAR catabolism was delayed but not suppressed in PARG-silenced cells may explain the apparent lack of functional consequences of PARG down-regulation under physiological cell growth conditions. In fact, in spite of the reduced PARG activity, both mouse and human cells appeared morphologically normal, failed to exhibit any evident growth defects and maintained the ability to attach and proliferate under routine subculture conditions (Figure 4). These observations are in striking contrast with the lethal phenotype of parg-knockout mice and the defective growth of parg−/− embryonic trophoblast stem cell lines [23]. A speculative explanation may be that a higher level of PAR metabolism in non-differentiated cells makes PARG an essential enzyme in early embryogenesis. In fact, PAR accumulation and concurrent apoptosis have been observed in parg-null embryos, as well as in cultured parg−/− trophoblast stem cells [23]. Another possibility is that the recently discovered ARH3 [42] and/or other, as yet unidentified, PAR-specific enzymatic activities compensate for severe PARG deficiency in post-embryonic cells.
In addition to (or as a consequence of) altered turnover, we found that oxidant-induced PAR in silenced cells was enriched in polymers longer than 15-mers, when compared with PARG wild-type cells (Figure 7). PAR has been shown to play an active role in the cellular response to particular types of DNA damage, by allowing rapid recruitment of the BER (base excision repair) complex to the injured sites [43,44] and also acting as a signalling molecule interacting with, and affecting the function of key regulators of cell cycle, cell death and pro-inflammatory pathways [7,34,45–48]. Both polymer size and number have been shown to be critical determinants of PAR function(s). Thus the extended time of DNA damage-induced PAR accumulation and increased amounts of long polymers in PARG-silenced cells may be expected to have an impact on the cellular response to genotoxic stress. Indeed, PARG down-regulation enhanced cellular resistance against the cytotoxic effects of H2O2 (Figures 9B and 10A), but not of the DNA-alkylating agent MNNG (Figure 9C), suggesting a selective involvement of PARG in the cellular response to oxidative DNA damage. Although the molecular mechanisms involved remain to be clarified, reduced PAR turnover may favour survival pathways over cell death signalling. Interestingly, depletion of 110 kDa PARG, leading to an 80–30% reduction of PAR-degrading activity in mice, has also been found to be protective against renal or splanchnic ischaemia/reperfusion injury [21,22], thus highlighting PARG as a potential target for therapeutic intervention in such kinds of pathologies. In these [21,22] and other studies [9,49], the beneficial effects of reduced PARG activity under conditions of genotoxic stress have been attributed to an indirect influence on the catalytic activity of PARPs. In fact, blocking PAR degradation would ‘trap’ DNA-damage-dependent PARPs (mainly PARP-1) in the auto-(ADP-ribosyl)ated inactive state. This would result in a lower NAD+ consumption and consequently in the prevention of energy store depletion. In such a scenario, the functional outcome of PARG inactivation is therefore analogous to that elicited by PARP inhibitors [50]. However, we found that no massive energy dissipation occurred under our experimental conditions and cells essentially died by apoptosis, irrespective of their PARG content (Figure 10A); in all cases, cell death occurred without significant changes in p53 levels and did not require caspase activation (Figure 10B). Thus PARG down-regulation did not interfere with the cascade of events leading to apoptotic cell death, but it apparently increased the threshold for the activation of the apoptotic programme (Figures 9B and 10A). Treatment of wild-type cells with the PARP inhibitor 3-AB also reduced the level of apoptotic cell death (Figures 9B and 9C). This observation is in line with the view that the role of PARP(s) in the life-or-death decision making of damaged cells may involve molecular events that are distinct from the effects of PARP activation on the cellular energy stores [7,30,34,46–48]. In addition, contrary to PARG silencing, 3-AB reduced the cytotoxicity by both oxidative (H2O2) and non-oxidative (MNNG) DNA-damaging agents. Moreover, the protection afforded by PARG silencing against H2O2-induced apoptosis was similar in its extent to that provided by 3-AB up to 100 μM H2O2; the 3-AB effect became larger thereafter and was by far superior at very high concentrations of the oxidant. Altogether, these results suggest that PARG may play an autonomous role in the cellular response to oxidative DNA damage. We propose that it acts as a negative regulator of survival in oxidatively stressed cells, and thus contributes to genomic stability by counteracting the propagation of genetically compromised cells.
References
- 1.Amé J. C., Jacobson E. L., Jacobson M. K. ADP-ribose polymer metabolism. From DNA Damage and Stress Signalling to Cell Death. In: de Murcia G., Shall S., editors. Poly ADP-ribosylation Reactions. Oxford: Oxford University Press; 2000. pp. 1–34. [Google Scholar]
- 2.D'Amours D., Desnoyers S., D'Silva I., Poirier G. G. Poly(ADP-ribosyl)ation reactions in the regulation of nuclear functions. Biochem. J. 1999;342:249–268. [PMC free article] [PubMed] [Google Scholar]
- 3.Amé J. C., Spenlehauer C., de Murcia G. The PARP superfamily. BioEssays. 2004;26:882–893. doi: 10.1002/bies.20085. [DOI] [PubMed] [Google Scholar]
- 4.Davidovic L., Vodenicharov M., Affar E. B., Poirier G. G. Importance of poly(ADP-ribose) glycohydrolase in the control of poly(ADP-ribose) metabolism. Exp. Cell Res. 2001;268:7–13. doi: 10.1006/excr.2001.5263. [DOI] [PubMed] [Google Scholar]
- 5.Bürkle A., Schreiber V., Danzter F., Oliver F. J., Niedergang C., de Murcia G., Menissier-de Murcia J. Biological significance of poly(ADP-ribosyl)ation reactions: molecular and genetic approaches. From DNA Damage and Stress Signalling to Cell Death. In: de Murcia G., Shall S., editors. Poly ADP-ribosylation Reactions. Oxford: Oxford University Press; 2000. pp. 80–124. [Google Scholar]
- 6.Ménissier de Murcia J., Ricoul M., Tartier L., Niedergang C., Huber A., Dantzer F., Schreiber V., Amé J. C., Dierich A., LeMeur M., et al. Functional interaction between PARP-1 and PARP-2 in chromosome stability and embryonic development in mouse. EMBO J. 2003;22:2255–2263. doi: 10.1093/emboj/cdg206. [DOI] [PMC free article] [PubMed] [Google Scholar]
- 7.Kim M. Y., Zhang T., Kraus W. L. Poly(ADP-ribosyl)ation by PARP-1: PAR-laying NAD+ into a nuclear signal. Genes Dev. 2005;10:1951–1967. doi: 10.1101/gad.1331805. [DOI] [PubMed] [Google Scholar]
- 8.Bakondi E., Bai P., Erdèlyi K., Szabo C., Gergely P., Virag L. Cytoprotective effect of gallotannin in oxidatively stressed HaCaT keratinocytes: the role of poly(ADP-ribose) metabolism. Exp. Dermatol. 2004;13:170–178. doi: 10.1111/j.0906-6705.2004.0150.x. [DOI] [PubMed] [Google Scholar]
- 9.Ying W., Sevigny M. B., Chen Y., Swanson R. A. Poly(ADP-ribose) glycohydrolase mediates oxidative and excitotoxic neuronal death. Proc. Natl. Acad. Sci. U.S.A. 2001;98:12227–12232. doi: 10.1073/pnas.211202598. [DOI] [PMC free article] [PubMed] [Google Scholar]
- 10.Falsig J., Christiansen S. H., Feuerhahn S., Bürkle A., Oei S. L., Keil C., Leist M. Poly(ADP-ribose) glycohydrolase as a target for neuroprotective intervention: assessment of currently available pharmacological tools. Eur. J. Pharmacol. 2004;497:7–16. doi: 10.1016/j.ejphar.2004.06.042. [DOI] [PubMed] [Google Scholar]
- 11.Erdèlyi K., Kiss A., Bakondi E., Bai P., Szabo C., Gergely P., Erdodi F., Virag L. Gallotannin inhibits the expression of chemokines and inflammatory cytokines in A549 cells. Mol. Pharmacol. 2005;68:895–904. doi: 10.1124/mol.105.012518. [DOI] [PubMed] [Google Scholar]
- 12.Cortes U., Tong W. M., Coyle D. L., Meyer-Ficca M. L., Meyer R. G., Petrilli V., Herceg Z., Jacobson E. L., Jacobson M. K., Wang Z. Q. Depletion of the 110-kilodalton isoform of poly(ADP-ribose) glycohydrolase increases sensitivity to genotoxic and endotoxic stress in mice. Mol. Cell. Biol. 2004;24:7163–7178. doi: 10.1128/MCB.24.16.7163-7178.2004. [DOI] [PMC free article] [PubMed] [Google Scholar]
- 13.Meyer-Ficca M. L., Meyer R. G., Coyle D. L., Jacobson E. L., Jacobson M. K. Human poly(ADP-ribose) glycohydrolase is expressed in alternative splice variants yielding isoforms that localize to different cell compartments. Exp. Cell Res. 2004;297:521–532. doi: 10.1016/j.yexcr.2004.03.050. [DOI] [PubMed] [Google Scholar]
- 14.Shimokawa T., Masutani M., Nagasawa S., Nozaki T., Ikota N., Aoki Y., Nagakama H., Sugimura T. Isolation and cloning of rat poly(ADP-ribose) glycohydrolase: presence of a potential nuclear export signal conserved in mammalian orthologs. J. Biochem. 1999;126:748–755. doi: 10.1093/oxfordjournals.jbchem.a022512. [DOI] [PubMed] [Google Scholar]
- 15.Bonicalzi M. E., Vodenicharov M., Coulombe M., Gagnè J. P., Poirier G. G. Alteration of poly(ADP-ribose) nucleocytoplasmic shuttling characteristics upon cleavage by apoptotic proteases. Biol. Cell. 2003;95:635–644. doi: 10.1016/j.biolcel.2003.10.003. [DOI] [PubMed] [Google Scholar]
- 16.Ohashi S., Kanai M., Hanai S., Uchiumi F., Maruta H., Tanuma S., Miwa M. Subcellular localization of poly(ADP-ribose) glycohydrolase in mammalian cells. Biochem. Biophys. Res. Commun. 2003;307:915–921. doi: 10.1016/s0006-291x(03)01272-5. [DOI] [PubMed] [Google Scholar]
- 17.Haince J. F., Ouellet M. E., McDonald D., Hendzel M. J., Poirier G. G. Dynamic relocation of poly(ADP-ribose) glycohydrolase isoforms during radiation-induced DNA damage. Biochim. Biophys. Acta. 2006;1763:226–237. doi: 10.1016/j.bbamcr.2005.11.015. [DOI] [PubMed] [Google Scholar]
- 18.Di Meglio S., Denegri M., Vallefuoco S., Tramontano F., Scovassi A. I., Quesada P. Poly(ADP-ribose) polymerase-1 and poly(ADP-ribose) glycohydrolase level and distribution in differentiating rat germinal cells. Mol. Cell. Biochem. 2003;248:85–91. doi: 10.1023/a:1024136927637. [DOI] [PubMed] [Google Scholar]
- 19.Uchiumi F., Ikeda D., Tanuma S. Changes in the activities and gene expression of poly(ADP-ribose) glycohydrolase during the differentiation of promyelocytic leukemia cell line HL-60. Biochim. Biophys. Acta. 2004;1676:1–11. doi: 10.1016/j.bbaexp.2003.10.001. [DOI] [PubMed] [Google Scholar]
- 20.Gagné J. P., Bonicalzi M. E., Gagné P., Ouellet M. E., Hendzel M. J., Poirier G. G. Poly(ADP-ribose) glycohydrolase is a component of the FMRP-associated messenger ribonucleoparticles. Biochem. J. 2005;392:499–509. doi: 10.1042/BJ20050792. [DOI] [PMC free article] [PubMed] [Google Scholar]
- 21.Cuzzocrea S., Di Paola R., Mazzon E., Cortes U., Genovese T., Muià C., Li W., Xu W., Li J. H., Zhang J., Wang Z. Q. PARG activity mediates intestinal injury induced by splanchnic occlusion and reperfusion. FASEB J. 2005;19:558–566. doi: 10.1096/fj.04-3117com. [DOI] [PubMed] [Google Scholar]
- 22.Patel N. S. A., Cortes U., Di Paola R., Mazzon E., Mota-Filipe H., Cuzzocrea S., Wang T. W., Thiemermann C. Mice lacking the 110-kD isoform of poly(ADP-ribose) glycohydrolase are protected against renal ischemia/reperfusion injury. J. Am. Soc. Nephrol. 2005;16:712–719. doi: 10.1681/ASN.2004080677. [DOI] [PubMed] [Google Scholar]
- 23.Koh D. W., Lawler A. M., Poitras M. F., Sasaki M., Wattler S., Nehls M. C., Stöger T., Poirier G. G., Dawson V. L., Dawson T. M. Failure to degrade poly(ADP-ribose) causes increased sensitivity to cytotoxicity and early embryonic lethality. Proc. Natl. Acad. Sci. U.S.A. 2004;101:17669–17704. doi: 10.1073/pnas.0406182101. [DOI] [PMC free article] [PubMed] [Google Scholar]
- 24.Hanai S., Kanai M., Ohashi S., Okamoto K., Yamada M., Takahashi H., Miwa M. Loss of poly(ADP-ribose) glycohydrolase causes progressive neurodegeneration in Drosophila melanogaster. Proc. Natl. Acad. Sci. U.S.A. 2004;101:82–86. doi: 10.1073/pnas.2237114100. [DOI] [PMC free article] [PubMed] [Google Scholar]
- 25.Brochu G., Shah G. M., Poirier G. G. Purification of poly(ADP-ribose) glycohydrolase and detection of its isoforms by a zymogram following one- or two-dimensional electrophoresis. Anal. Biochem. 1994;218:265–272. doi: 10.1006/abio.1994.1177. [DOI] [PubMed] [Google Scholar]
- 26.Rossi L., Denegri M., Torti M., Poirier G. G., Scovassi I. Poly(ADP-ribose) degradation by post-nuclear extracts from human cells. Biochimie. 2002;84:1227–1233. doi: 10.1016/s0300-9084(02)00017-2. [DOI] [PubMed] [Google Scholar]
- 27.Bradbury D. A., Simmons T. D., Slater K. J., Crouch S. P. M. Measurement of the ADP:ATP ratio in human leukaemic cell lines can be used as an indicator of cell viability, necrosis and apoptosis. J. Immunol. Methods. 2000;240:79–92. doi: 10.1016/s0022-1759(00)00178-2. [DOI] [PubMed] [Google Scholar]
- 28.Olive P. L., Banath J. P., Durand R. E. Heterogeneity in radiation-induced DNA damage and repair in tumor and normal cells measured using the ‘comet’ assay. Radiat. Res. 1990;122:86–94. [PubMed] [Google Scholar]
- 29.Affar E. B., Germain M., Winstall E., Vodenicharov M., Shah R. G., Salvesen G. S., Poirier G. G. Caspase-3-mediated processing of poly(ADP-ribose) glycohydrolase during apoptosis. J. Biol. Chem. 2001;276:2935–2942. doi: 10.1074/jbc.M007269200. [DOI] [PubMed] [Google Scholar]
- 30.Scovassi A. I., Diederich M. Modulation of poly(ADP-ribosyl)ation in apoptotic cells. Biochem. Pharmacol. 2004;68:1041–1047. doi: 10.1016/j.bcp.2004.04.023. [DOI] [PubMed] [Google Scholar]
- 31.Schreiber V., Ricoul M., Amé J. C., Dantzer F., Meder V., Spenlehauer C., Stiegler P., Niedergang C., Sabatier L., Favaudon V., et al. PARP-2: structure–function relationship. In: Bürkle A., editor. Poly(ADP-ribosyl)ation. Georgetown: Landes Bioscience; 2005. [Google Scholar]
- 32.Althaus F. R., Richter C. Poly(ADP-ribose) catabolism. In: Solioz M., editor. ADP-ribosylation of Proteins. Enzymology and Biological Significance. Berlin: Springer-Verlag; 1987. pp. 38–44. [PubMed] [Google Scholar]
- 33.Boulikas T. Poly(ADP-ribose) synthesis and degradation in mammalian nuclei. Anal. Biochem. 1992;203:252–258. doi: 10.1016/0003-2697(92)90310-4. [DOI] [PubMed] [Google Scholar]
- 34.Bouchard V. J., Rouleau M., Poirier G. G. PARP-1, a determinant of cell survival in response to DNA damage. Exp. Hematol. 2003;31:446–454. doi: 10.1016/s0301-472x(03)00083-3. [DOI] [PubMed] [Google Scholar]
- 35.Gardner A. M., Xu F.-H., Fady C., Jacoby J., Duffey D. C., Tu Y., Lichtenstein A. Apoptotic vs. non-apoptotic cytotoxicity induced by hydrogen peroxide. Free Radical Biol. Med. 1997;22:73–83. doi: 10.1016/s0891-5849(96)00235-3. [DOI] [PubMed] [Google Scholar]
- 36.Palomba L., Sestili P., Columbaro M., Falcieri E., Cantoni O. Apoptosis and necrosis following exposure of U937 cells to increasing concentrations of hydrogen peroxide: the effect of the poly(ADP-ribose) polymerase inhibitor 3-aminobenzamide. Biochem. Pharmacol. 1999;58:1743–1750. doi: 10.1016/s0006-2952(99)00271-3. [DOI] [PubMed] [Google Scholar]
- 37.Tsujimoto Y. Apoptosis and necrosis: intracellular ATP levels as a determinant for cell death mode. Cell Death Differ. 1997;4:429–434. doi: 10.1038/sj.cdd.4400262. [DOI] [PubMed] [Google Scholar]
- 38.Harris S. L., Levine A. J. The p53 pathway: positive and negative feedback loops. Oncogene. 2005;24:2899–2908. doi: 10.1038/sj.onc.1208615. [DOI] [PubMed] [Google Scholar]
- 39.Tapodi A., Debreceni B., Hanto K., Bognar Z., Wittmann I., Gallyas F., Varbiro G., Sumegi B. Pivotal role of Akt activation in mitochondrial protection and cell survival by poly(ADP-ribose) polymerase-1 inhibition in oxidative stress. J. Biol. Chem. 2005;280:35767–35775. doi: 10.1074/jbc.M507075200. [DOI] [PubMed] [Google Scholar]
- 40.Ueda K., Oka J., Naruniya S., Miyakawa N., Hayaishi O. Poly ADP-ribose glycohydrolase from rat liver nuclei, a novel enzyme degrading the polymer. Biochem. Biophys. Res. Commun. 1972;46:516–523. doi: 10.1016/s0006-291x(72)80169-4. [DOI] [PubMed] [Google Scholar]
- 41.Patel C. N., Koh D. W., Jacobson M. K., Oliveira M. A. Identification of three critical acidic residues of poly(ADP-ribose) glycohydrolase involved in catalysis: determining the PARG catalytic domain. Biochem. J. 2005;388:493–500. doi: 10.1042/BJ20040942. [DOI] [PMC free article] [PubMed] [Google Scholar]
- 42.Oka S., Kato J., Moss J. Identification and characterization of a mammalian 39-kDa poly(ADP-ribose) glycohydrolase. J. Biol. Chem. 2006;281:705–713. doi: 10.1074/jbc.M510290200. [DOI] [PubMed] [Google Scholar]
- 43.El-Khamisy S. F., Masutani M., Suzuki H., Caldecott K. W. A requirement for PARP-1 for the assembly or stability of XRCC1 nuclear foci at sites of oxidative DNA damage. Nucleic Acids Res. 2003;31:5526–5533. doi: 10.1093/nar/gkg761. [DOI] [PMC free article] [PubMed] [Google Scholar]
- 44.Okano S., Lan L., Caldecott K. W., Mori T., Yasui A. Spatial and temporal cellular responses to single-strand breaks in human cells. Mol. Cell. Biol. 2003;23:3974–3981. doi: 10.1128/MCB.23.11.3974-3981.2003. [DOI] [PMC free article] [PubMed] [Google Scholar]
- 45.Pleschke J. M., Kleczkowska H. E., Strom M., Althaus F. R. Poly(ADP-ribose) binds to specific domains in DNA damage checkpoint proteins. J. Biol. Chem. 2000;275:40974–40980. doi: 10.1074/jbc.M006520200. [DOI] [PubMed] [Google Scholar]
- 46.Malanga M., Althaus F. R. The role of poly(ADP-ribose) in the DNA damage signaling network. Biochem. Cell Biol. 2005;83:354–364. doi: 10.1139/o05-038. [DOI] [PubMed] [Google Scholar]
- 47.Rapizzi E., Fossati S., Moroni F., Chiarugi A. Inhibition of poly(ADP-ribose)glycohydrolase by gallotannin selectively up-regulates expression of proinflammatory genes. Mol. Pharmacol. 2004;66:890–898. doi: 10.1124/mol.104.000968. [DOI] [PubMed] [Google Scholar]
- 48.Hong S. J., Dawson T. M., Dawson V. L. Nuclear and mitochondrial conversation in cell death: PARP-1 and AIF signaling. Trends Pharmacol. Sci. 2004;25:259–264. doi: 10.1016/j.tips.2004.03.005. [DOI] [PubMed] [Google Scholar]
- 49.Lu X. C., Massuda E., Lin Q., Li W., Li J. H., Zhang J. Post-treatment with a novel PARG inhibitor reduces infarct in cerebral ischemia in the rat. Brain Res. 2003;978:99–103. doi: 10.1016/s0006-8993(03)02774-4. [DOI] [PubMed] [Google Scholar]
- 50.Graziani G., Szabo C. Clinical perspectives of PARP inhibitors. Pharmacol. Res. 2005;52:109–118. doi: 10.1016/j.phrs.2005.02.013. [DOI] [PubMed] [Google Scholar]